
A Linear Look at AI: Power, Compute, Intelligence
Three components, one direction. China leads generation, America leads computation, and the ratio between them decides the next decade.
Part of theStocks Center
Artificial intelligence is discussed as though it were weather. It arrives, it intensifies, it disrupts. Forecasts are issued in the language of inevitability, and the argument moves quickly to consequences: which jobs, which margins, which nations.
That framing is comfortable and it is wrong. AI is not weather. It is a manufactured output at the end of a physical production line, and every production line has a first station. Trace it back far enough and you do not arrive at an algorithm, a research paper or a funding round. You arrive at a turbine.
This piece takes the least fashionable possible approach to the most fashionable subject in markets. It looks at AI linearly.
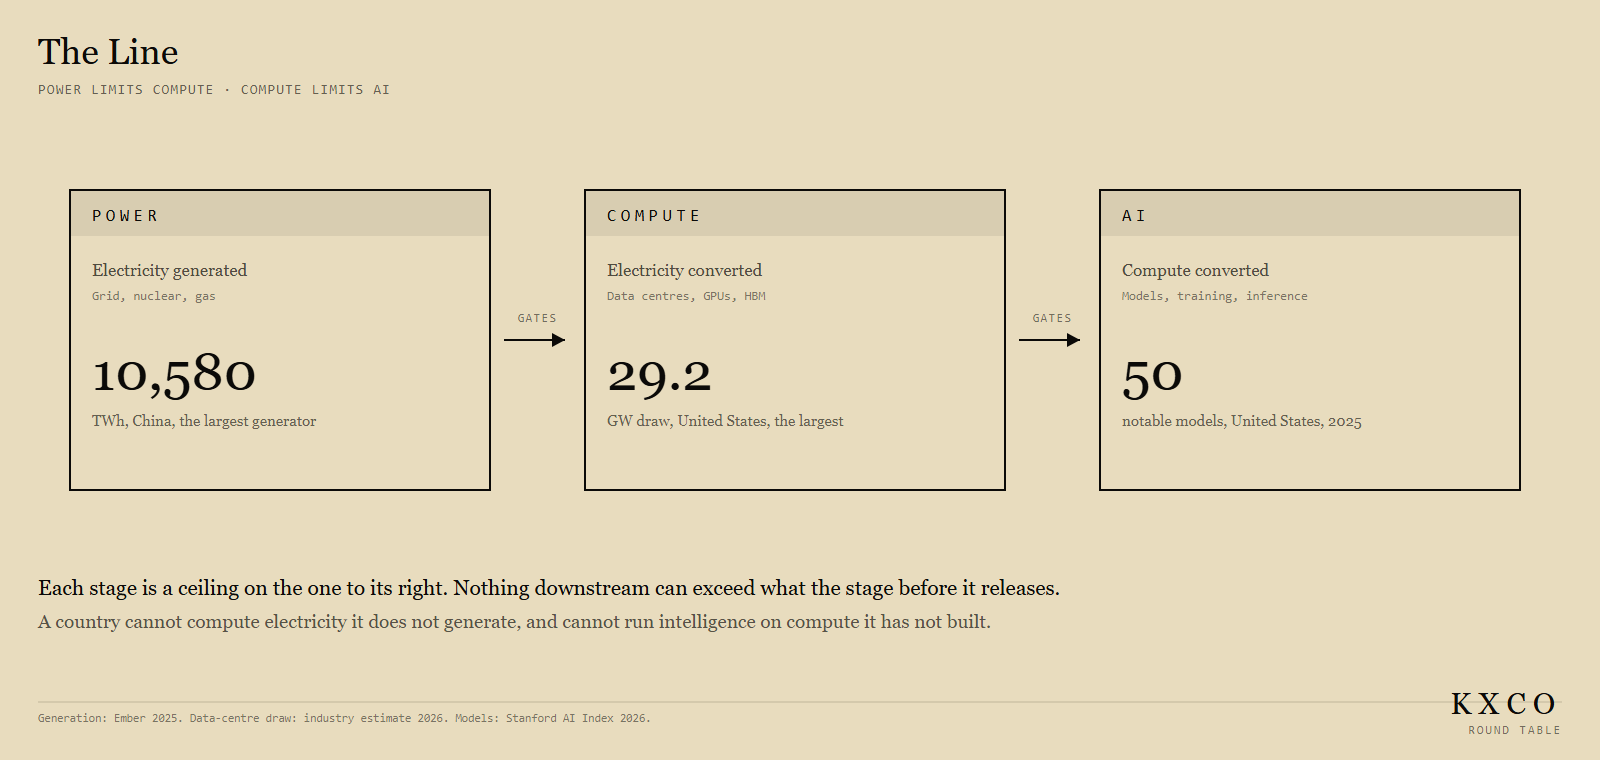
Three components, one direction
The line has three stations and it runs one way.
Power. Electricity generated. Turbines, reactors, gas plants, dams, panels. Measured in terawatt hours over a year, or gigawatts of capacity at an instant.
Compute. Electricity converted into calculation. Data centres, accelerators, high bandwidth memory, cooling, switchgear. Measured in gigawatts of draw, or in the number of chips actually running.
AI. Compute converted into capability. Training runs, model weights, inference served, decisions changed. Measured badly, by everyone, which is part of the problem.
Each station is a ceiling on the one after it. Nothing downstream can exceed what the station before it releases. This sounds obvious stated plainly. It is routinely ignored in practice, because the third station is where the excitement lives and the first station is where the permitting lives.
A country cannot compute electricity it does not generate. A company cannot train on compute it has not built. A model cannot serve inference on capacity that does not exist. These are not economic relationships that can be arbitraged, financed around or disrupted by a clever founder. They are conservation laws with a balance sheet attached.
The interesting question is therefore not "how fast is AI improving". It is "which station is currently binding, and who controls it".
Component one: power, and why it stopped being boring
For roughly forty years, electricity was the least interesting input in technology. It was abundant, cheap, and someone else's problem. A software company's relationship with the grid was a line item called utilities.
That ended. It ended quietly, in procurement departments, before it ended loudly in headlines.
The clearest evidence is not a forecast. It is a contract. When a company signs a twenty year power purchase agreement for a specific reactor at a specific site, it has stopped treating electricity as a commodity and started treating it as a strategic asset. Twenty year commitments are what you sign for things you are afraid of losing.
Look at what has actually been signed.
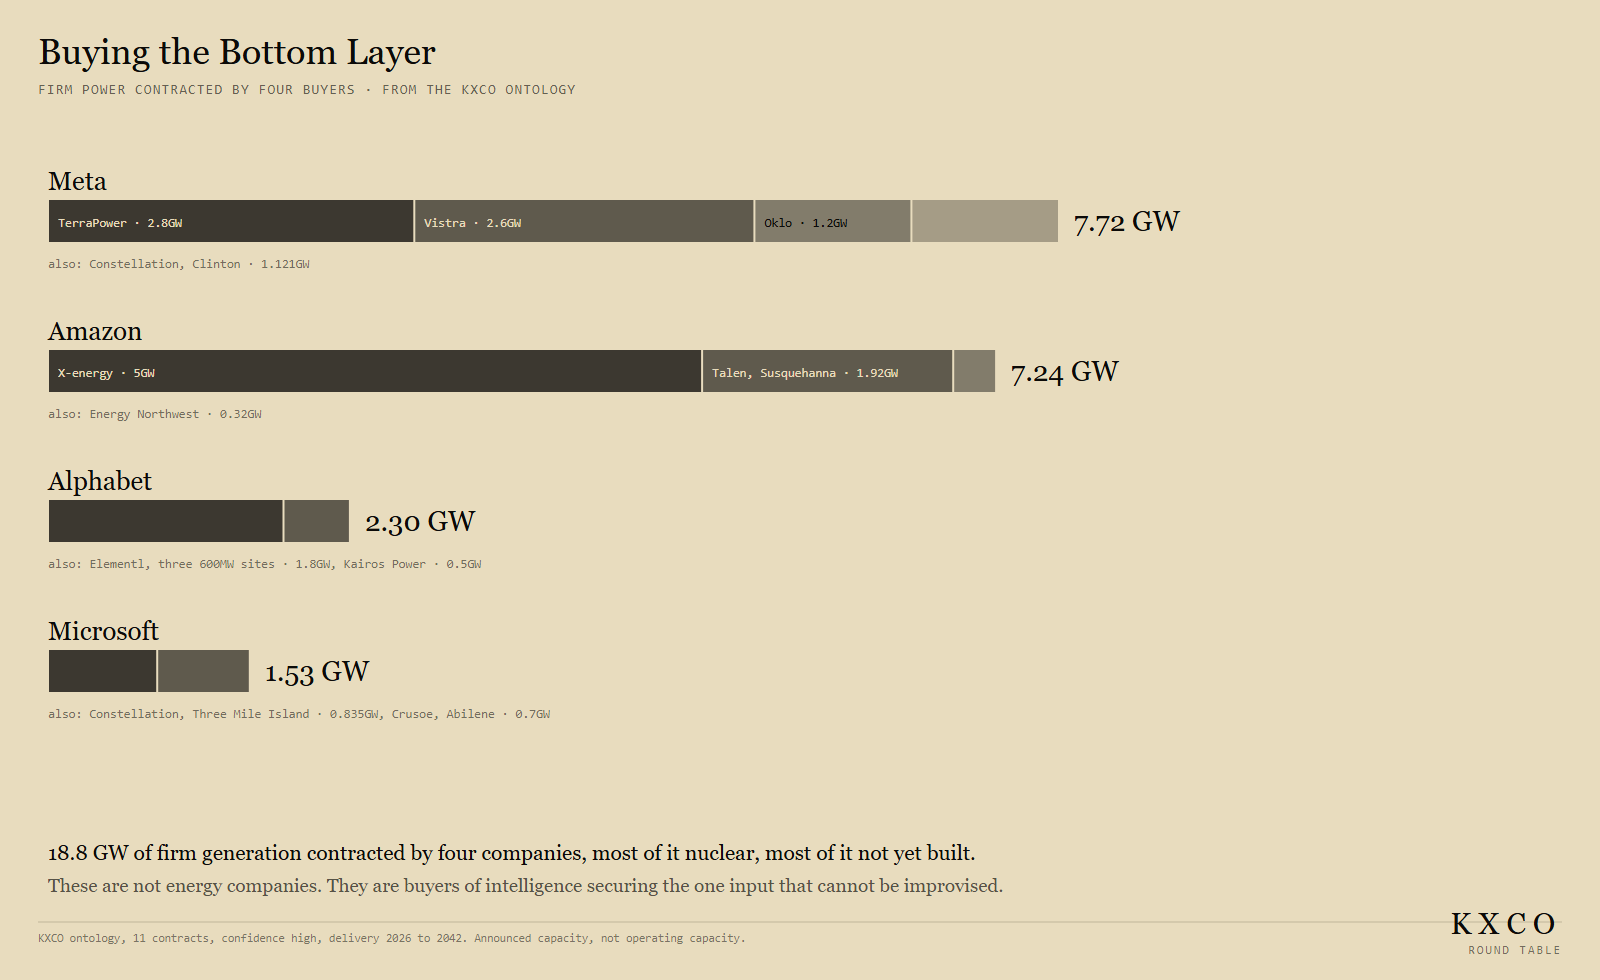
Four companies have contracted roughly 18.8 gigawatts of firm generation between them. Meta leads at 7.72 gigawatts across TerraPower, Vistra, Oklo and Constellation's Clinton station. Amazon follows at 7.24 gigawatts, dominated by an X-energy small modular reactor commitment of up to five gigawatts by 2039, plus 1.92 gigawatts from Talen's Susquehanna plant running to 2042. Alphabet holds 2.3 gigawatts through Elementl and Kairos. Microsoft's 1.53 gigawatts is smaller but includes the single most symbolically loaded deal in the sector, the 835 megawatt twenty year agreement to restart Three Mile Island.
Read those numbers carefully, because two things about them matter more than the totals.
The first is the technology mix. This is overwhelmingly nuclear, and much of it is nuclear that does not exist yet. Small modular reactors, advanced reactors, fast reactors, restarts of shuttered plants. Delivery dates run from 2030 to 2042. These companies are not buying electricity. They are underwriting the construction of a generation fleet, because the fleet they need has not been built and no utility was going to build it speculatively.
The second is who is signing. None of these are energy companies. They are buyers of intelligence, reaching two stations back down the line to secure the one input that cannot be improvised. You can rent compute. You can license a model. You can hire researchers. You cannot conjure 5 gigawatts of firm baseload, and everyone at that table has now worked that out.
Shayne Heffernan made the underlying point in Energy IS the New Currency, published on Live Trading News in August 2026: firm power delivered to the rack is the limiting reagent, ahead of silicon and ahead of capital. The procurement record since then has done nothing but confirm it. The earlier companion piece, Compute and Electricity: The Defining Challenge of Our Times, set out the national picture. This piece takes the same line and walks it end to end.
Component two: compute, the conversion station
Compute is where electricity becomes something else. It is a conversion process, and like every conversion process it has an efficiency, a capacity limit and a set of physical inputs that can run short.
United States data centres now draw roughly 29.2 gigawatts. That is not a projection. That is installed, energised, running load. Against a national generation base of about 4,520 terawatt hours in 2025, continuous operation at that draw works out to something near 256 terawatt hours a year, or a little over five and a half per cent of everything the country generates.
That figure has a history worth stating. American data centres consumed roughly 176 terawatt hours in 2023, about 4.4 per cent of national electricity. Credible ranges for 2028 run from 325 to 580 terawatt hours. The low end of that range is an eighty per cent increase from 2023. The high end is more than a tripling. The gap between those two numbers is roughly the annual electricity consumption of a mid sized industrial economy, and nobody can tell you which end we land on.
This is the station where the physical inputs bite hardest. A gigawatt of data centre draw is not just a gigawatt of generation. It is transformers, switchgear, transmission interconnection, water or air cooling at scale, and a supply of accelerators and memory that has its own separate constraints. Nvidia is now co-designing 800 volt direct current power platforms with Vertiv specifically because conventional data centre power architecture does not survive contact with the next generation of racks. When the power distribution topology inside the building has to be redesigned, you are no longer scaling. You are re engineering.
Component three: AI, the visible tip
The third station is the one everyone watches, and the one measured worst.
The most defensible available proxy is the count of notable models released. On that measure the United States shipped 50 in 2025 and China shipped 30. No third country came close: South Korea managed 5, Canada, France and the United Kingdom one each.
Model counts are a flawed metric and it is worth saying why rather than pretending otherwise. A count treats a frontier training run and a fine tuned specialist release as one unit each. Much of the American lead in raw count comes from smaller specialised models out of startups and universities rather than from frontier systems. Anyone quoting 50 against 30 as a measure of national capability is quoting something real but blunt.
The sharper number is the capability gap, and it has moved dramatically. The performance distance between the best American and the best Chinese models has compressed to about 2.7 per cent. At the top of the leaderboard, Anthropic's Claude Opus 4.6 posts an Arena score of 1,503 against ByteDance's Dola-Seed-2.0-Preview at 1,464. Thirty nine points. On publication volume, citation counts, patent output and industrial robot installation, China is ahead outright. And it is doing this while spending, by one accounting, roughly twenty three times less on AI investment.
Hold that thought. It becomes the whole argument in a moment.
The top five, layer by layer
Now put the three stations side by side and rank the world at each one. This is where the linear view earns its keep, because the ranking does not hold.
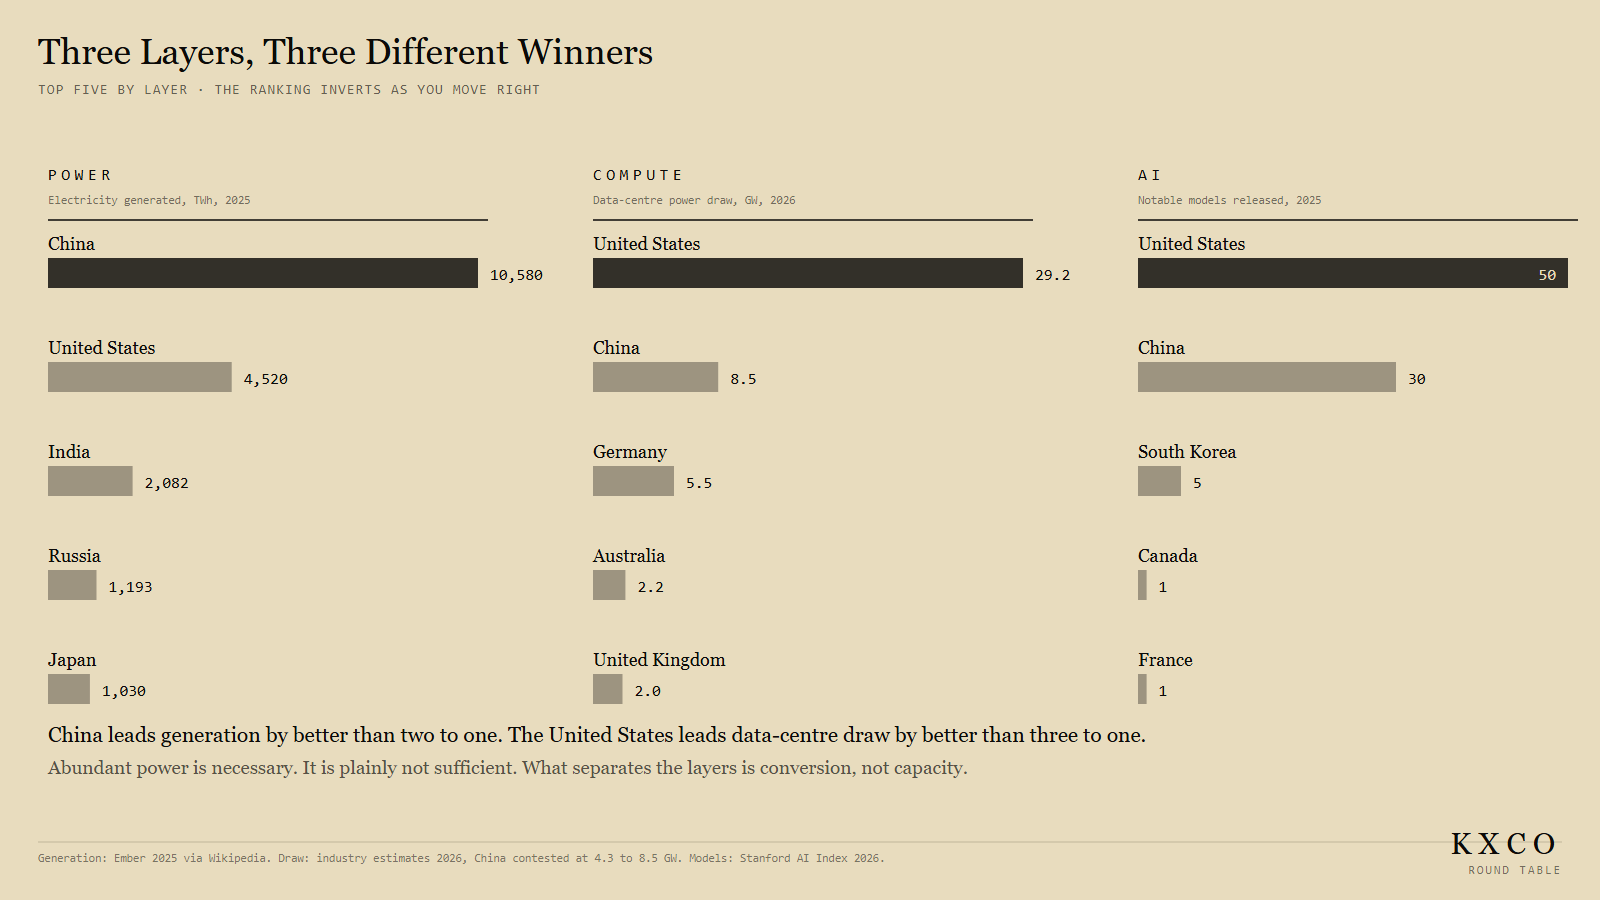
At the power station, China is first by a distance that is difficult to overstate. 10,580 terawatt hours generated in 2025, against 4,520 for the United States. India third at 2,082. Russia fourth at 1,193. Japan fifth at 1,030. China generates more electricity than the next three countries combined and has roughly two and a third times the American total. Over the preceding decade Chinese generation rose about 74 per cent. American generation rose about 6 per cent.
At the compute station, the ranking inverts. The United States is first at roughly 29.2 gigawatts of data centre draw. China is second, and here the numbers turn genuinely contested: estimates run from 4.27 gigawatts of operational capacity to 8.5 gigawatts of consumption depending on what is being counted and by whom. Germany is third at about 5.5 gigawatts, Australia and the United Kingdom follow at roughly 2.2 and 2.0. Facility counts tell a similar story with different precision: the United States has somewhere between 4,000 and 5,400 data centres depending on the census, more than any other country by a wide margin.
I am flagging that estimate spread rather than smoothing it. Anyone who gives you a single confident figure for Chinese data centre capacity is giving you a choice they made, not a measurement they took.
At the AI station, the United States leads again, 50 notable models to 30, with a long gap to everyone else.
So: China owns the bottom of the line. The United States owns the middle and the top. That is not a contradiction to be explained away. It is the single most important structural fact in the sector, and it points directly at the number that actually matters.
The conversion ratio
If China generates 2.3 times the electricity of the United States, and the United States runs 3.4 times the data centre load, then the two countries are doing something profoundly different with the same physical input.
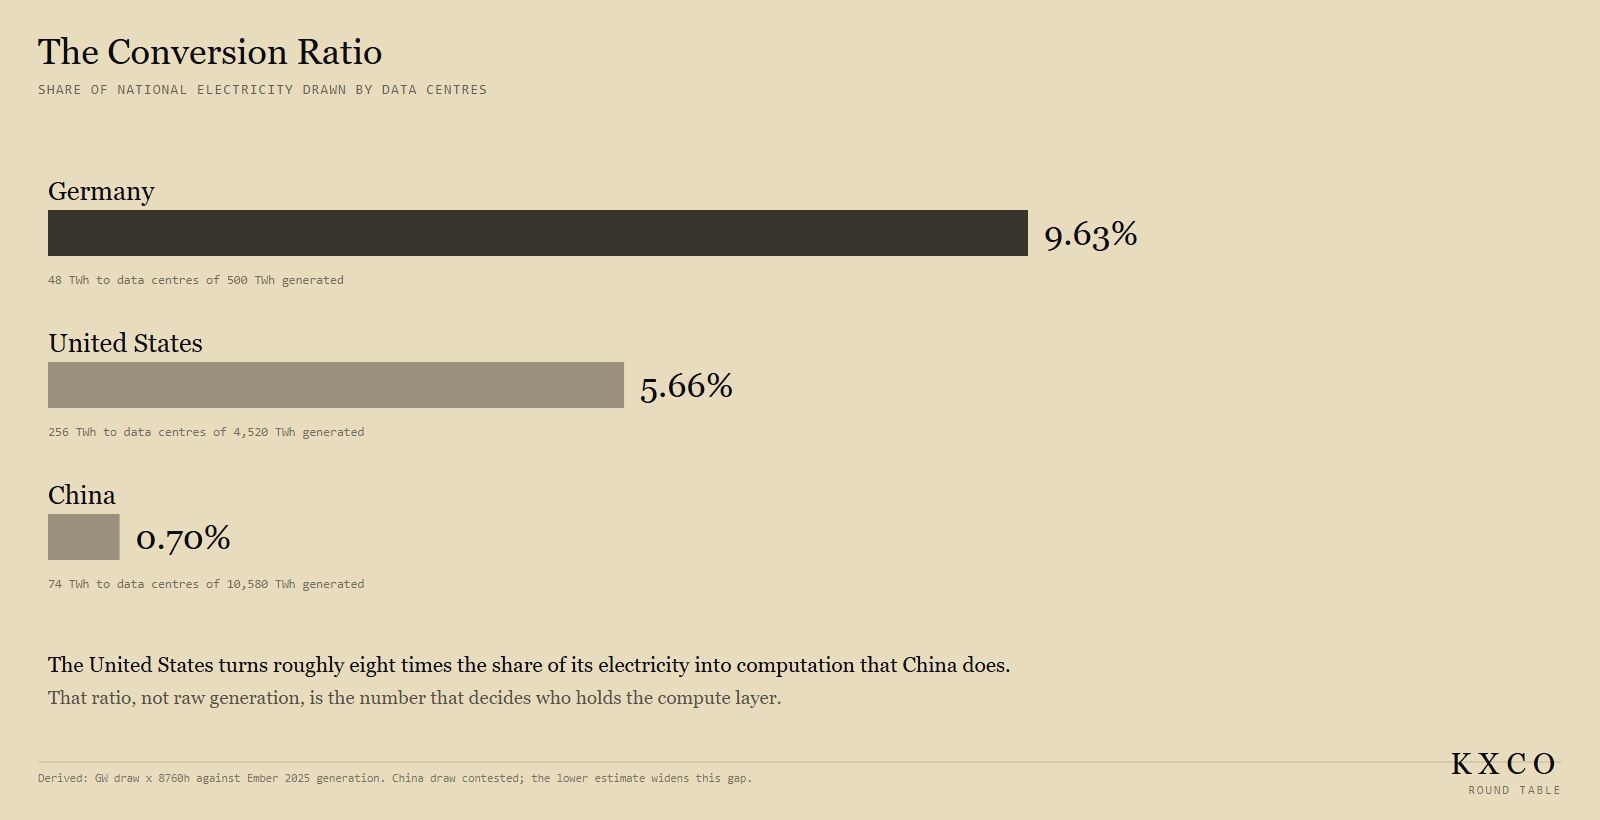
Run the arithmetic. American data centres take roughly 5.66 per cent of national generation. Chinese data centres take roughly 0.70 per cent. Germany, on a much smaller base, runs the highest intensity of the three at roughly 9.63 per cent, which tells you something separate and interesting about a mature industrial grid absorbing a new load class.
The United States converts something like eight times the share of its electricity into computation that China does.
This is the number to carry away from the whole piece. Not generation. Not model counts. The conversion ratio, because it is the only one of the three that describes a choice rather than an endowment.
And it cuts in an uncomfortable direction if you are American. A low conversion ratio is not a weakness. It is unused capacity. China's data centre load could grow eight fold and still sit below the share of national electricity that the United States already devotes to computation, without one additional turbine being commissioned. The American ratio, by contrast, is climbing against a generation base that grew six per cent in a decade, which is why American hyperscalers are the ones signing twenty year nuclear contracts. They are not buying power because power is cheap. They are buying it because they are running out of headroom and they can see the wall.
Set that against the capability gap closing to 2.7 per cent on twenty three times less investment, and the shape of the next decade becomes visible. One side has the compute lead and is approaching a power constraint. The other has enormous power headroom and is closing the capability gap on a fraction of the capital. Those two trends are not independent.
The second tier is buying its way in
The top five at each station is not the whole map, because two groups are attempting to enter the line at the middle station rather than climb it from the bottom.
Japan is running the most coherent state level programme of any developed economy. METI directs an FY2026 AI and semiconductor budget in the tens of billions of dollars. The Takaichi government's seventeen strategic fields framework targets over 370 trillion yen of combined public and private investment. The FRONTia programme, the Foundation for Real-world Omni-Native Trustworthy Intelligence and Alignment, is a national push at trustworthy systems rather than raw scale. Underneath that sits real hardware: the Noetra AI Factory, a 140 megawatt Vera Rubin class facility built as national physical AI infrastructure. Japan is fifth in generation at 1,030 terawatt hours, which means it has the power base and is now deliberately building the conversion capacity on top of it. The Economic Security Promotion Act gives METI a statutory mechanism to certify and protect supply, which is a tool most Western governments do not have.
The Gulf states are buying the middle of the line outright. Stargate UAE is a one gigawatt cluster in Abu Dhabi with 200 megawatts live in 2026, built by G42, co operated by Oracle, running Nvidia Grace Blackwell GB300 systems with Cisco networking and SoftBank capital. Saudi Arabia's HUMAIN, wholly owned by the Public Investment Fund, has a one gigawatt joint venture with AMD and Cisco on MI450 silicon. MGX funds Stargate as a sovereign partner. Qatar's QIA has held equity in xAI. MBZUAI is the research layer on top.
The Gulf strategy is worth understanding precisely, because it is not a copy of the American one. These states are not trying to win the AI station. They are buying a position at the compute station using energy wealth and sovereign capital, on the reasoning that whoever hosts the computation captures a durable share of the value regardless of who writes the models. On the linear view that is a rational read of where the constraint sits.
And then there is Taiwan, which is a category of its own. It does not appear in the top five at any of the three stations. It is nonetheless the single most consequential jurisdiction on the entire line, because leading edge foundry capacity is concentrated there and every accelerator at the compute station passes through it. Our own record marks the Taiwan Strait not as a country entry but as a scenario, described as the one the whole supply chain is exposed to. A linear system with a geographic single point of failure has a tail risk that no amount of capital at the other stations can hedge.
The companies with access to all three
Move from countries to companies and the question sharpens. Who actually holds a position at all three stations?
Very few. Most participants in this sector own one station and rent the others.
Amazon, Alphabet, Meta and Microsoft are the four with genuine presence at every level. Each contracts firm generation directly. Each owns hyperscale compute, and three of the four design their own silicon: Trainium and Inferentia at Amazon, TPU at Alphabet, custom accelerators at Meta. Each develops frontier models in house or controls one through equity. Microsoft's position runs through roughly 27 per cent of OpenAI, worth something near 135 billion dollars. Amazon's runs through roughly 8 billion cumulative into Anthropic. Alphabet and Meta build in house with Gemini and Llama respectively, and Alphabet also holds Anthropic equity.
That vertical integration is the actual moat. Not model quality, which is converging, and not capital, which is abundant. The moat is holding a position at the station that binds, whichever station that turns out to be next.
Nvidia occupies a different and arguably better position. It does not generate power and it does not, in the main, sell finished intelligence. It owns the conversion machinery, and it has spent the last two years buying influence in both directions. Upward into models: roughly 30 billion dollars into OpenAI as part of a 110 billion round, up to 10 billion into Anthropic, about 13 per cent of CoreWeave, guarantees of up to 105 billion dollars of lease and power obligations. Downward into power and its supply chain: 1.5 billion into SB Energy, 2 billion into Lumentum for optics and a domestic fab, joint power platform design with Vertiv. Nvidia is not integrated across the three stations. It is positioned at the toll booth between them, taking a cut of traffic in both directions.
SpaceX has assembled something unusual. Post merger with xAI it owns the Colossus data centres, roughly 220,000 GPUs and 300 megawatts at Colossus 1 alone, and rents that capacity to rival labs. Colossus 1 is leased in full to Anthropic at about 1.25 billion dollars a month, running to roughly 45 billion dollars through 2029. It has been named Nvidia's sole AI compute supplier going forward against a 20 gigawatt target by end 2027, implying one to two million Rubin class GPUs. It develops its own models. Whether that target is achievable is a separate question. The structural position is real.
Everyone else rents. Oracle has a 300 billion dollar five year compute agreement with OpenAI covering roughly 4.5 gigawatts from 2027, and operates Stargate, but it is a landlord at the compute station rather than a participant at all three. AMD supplies silicon at scale, roughly 90 billion dollars and 6 gigawatts to OpenAI, up to 2 gigawatts of MI450 to Anthropic, one gigawatt into Saudi Arabia's HUMAIN. CoreWeave, Nebius, Crusoe, Core Scientific and Nscale are compute pure plays. Constellation, Vistra, Talen, Oklo, X-energy, TerraPower, Kairos and Elementl are power pure plays, several of which have been transformed from utilities into growth assets purely by the arrival of these buyers.
The pure plays are not worse investments. In several cases they are better ones, because a company that owns the binding constraint and sells to four desperate buyers has more pricing power than a company that owns everything and competes at the top. But they are structurally different, and the linear view is what makes the difference legible.
What the graph shows that the list does not
Everything to this point could have been assembled from a spreadsheet. The next two findings could not, and they are the reason this piece was written against a graph rather than a table.
A list of companies tells you who holds positions. It cannot tell you what has to be crossed to get from one end of the line to the other. For that you have to traverse.
So we asked the ontology a question with no obvious answer: what is the shortest route from a generation asset to a frontier model, and what sits in the middle of it?
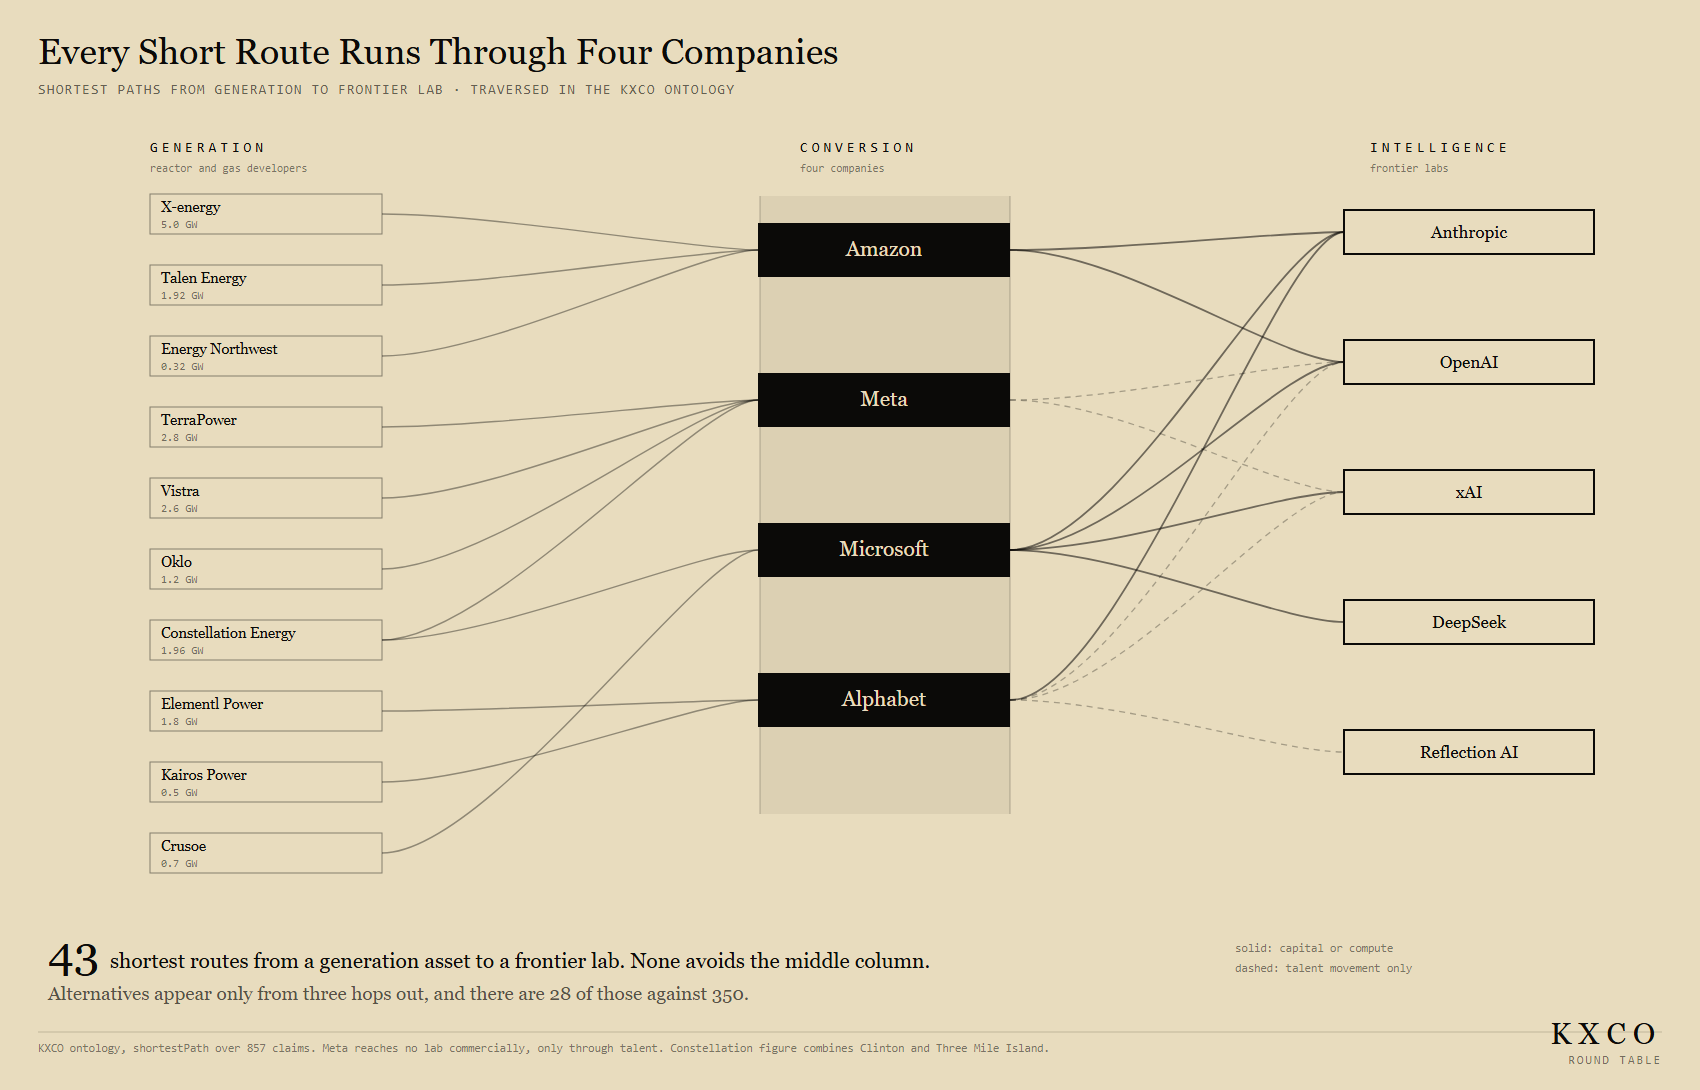
There are 43 shortest routes between the nine reactor and gas developers on one side and the five frontier labs on the other. Every single one is exactly two hops. And every single one passes through Amazon, Meta, Microsoft or Alphabet.
Not most. All 43.
Push the search out to three hops and alternatives finally appear, but only 28 of them against 350 that still route through the same four companies. At four hops it is 364 against 7,364. Across the whole search space, better than 95 per cent of every path from generation to intelligence crosses one of four corporate boundaries.
That is a structural fact about the industry, and it was not visible in any of the individual deals. Each contract on its own looks like ordinary procurement. Held together as a graph and traversed, they describe something closer to a toll gate. The four companies did not announce that they had become the sole intermediary between electricity and intelligence. They arrived there one power purchase agreement at a time, and the shape only shows up when you walk the paths.
One detail in that diagram is worth pausing on, because it corrects something the deal flow implies. Meta reaches no frontier lab through capital or compute at all. Its only edges to the labs are talent movement, drawn dashed. Meta bought 7.72 gigawatts of firm power, more than anyone, and built no commercial bridge to an external lab, because it is not buying intelligence from anybody. It is generating its own. That is a materially different strategy from Microsoft's and Amazon's, and it is legible in the edge types rather than in the announcements.
Where the line can be cut
A linear system has a useful and unpleasant property. Any single station can halt the whole thing.
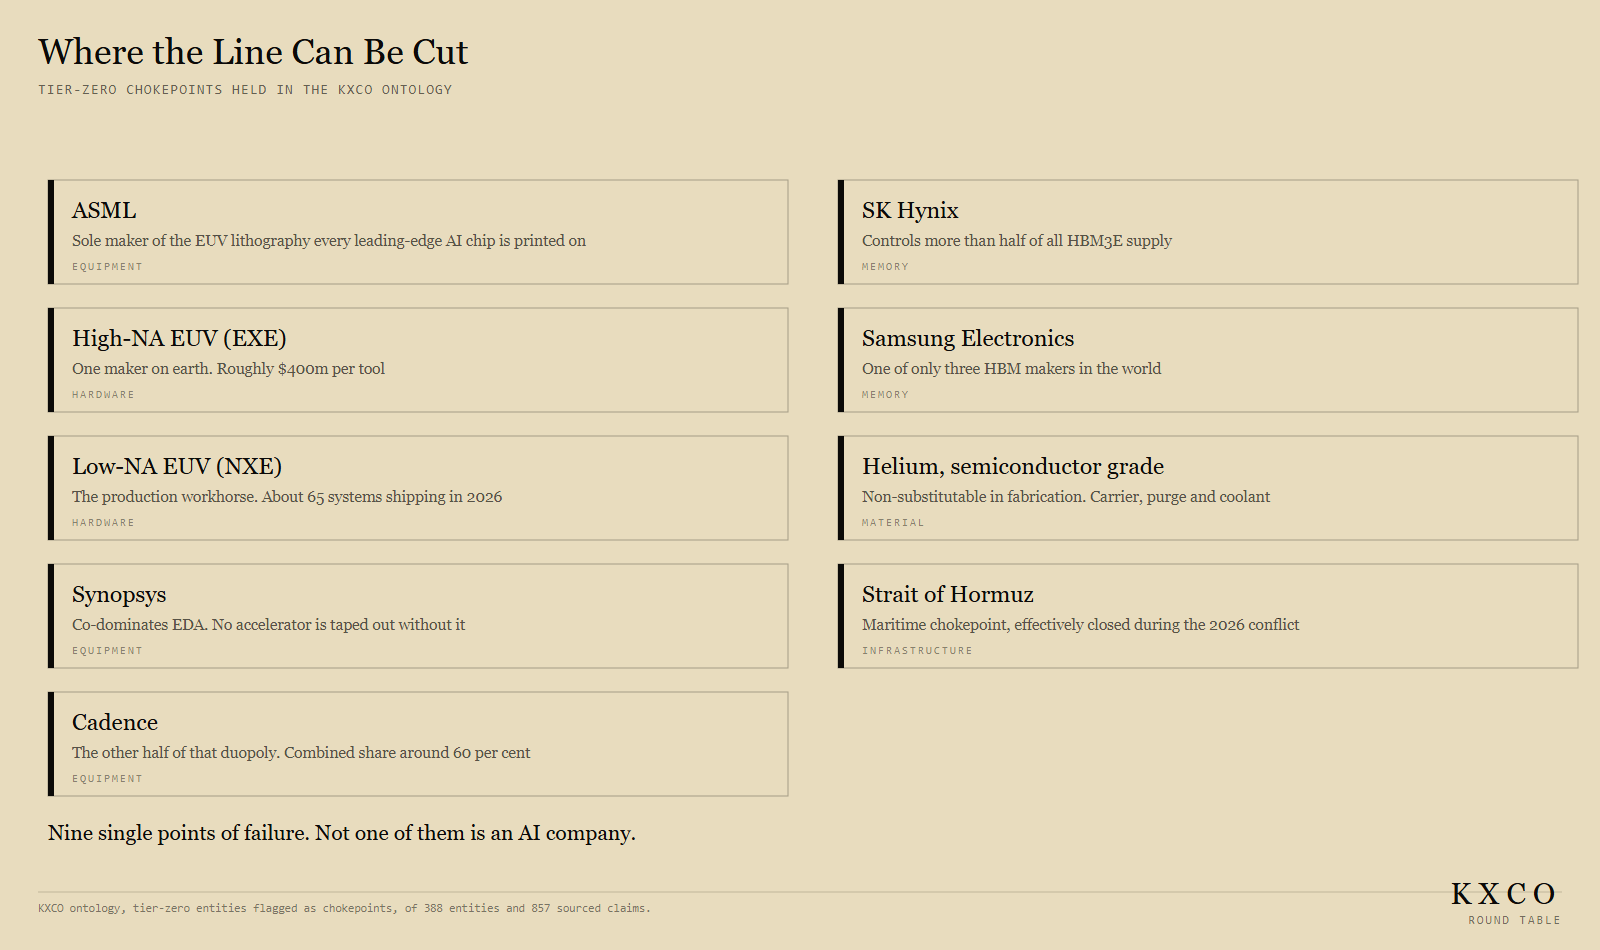
Nine genuine single points of failure sit on this line. Not one of them is an AI company.
ASML is the sole maker of the extreme ultraviolet lithography on which every leading edge AI chip is printed, and the sole maker of the High NA generation at roughly 400 million dollars per tool. Synopsys and Cadence between them hold around sixty per cent of electronic design automation, and no accelerator is taped out without one of them. SK Hynix controls more than half of all HBM3E supply, the most acute single shortage in AI infrastructure. Samsung is one of only three high bandwidth memory makers on the planet. Semiconductor grade helium is non substitutable in fabrication, serving as carrier gas, cleanroom purge and wafer coolant simultaneously. The Strait of Hormuz, effectively closed during the 2026 conflict, carries a meaningful share of the inputs behind that helium supply.
The lesson generalises. The fragility in AI is not concentrated where the valuations are. It sits in lithography, design software, memory, industrial gases and shipping lanes. A reader trying to understand risk in this sector by studying model benchmarks is looking at the one station that has no chokepoints, and ignoring the eight that do.
There is a second finding buried in the same data, and it is the more uncomfortable one.
Because the ontology stores how critical an entity is alongside how connected it is, the two can be compared directly. They diverge, badly.
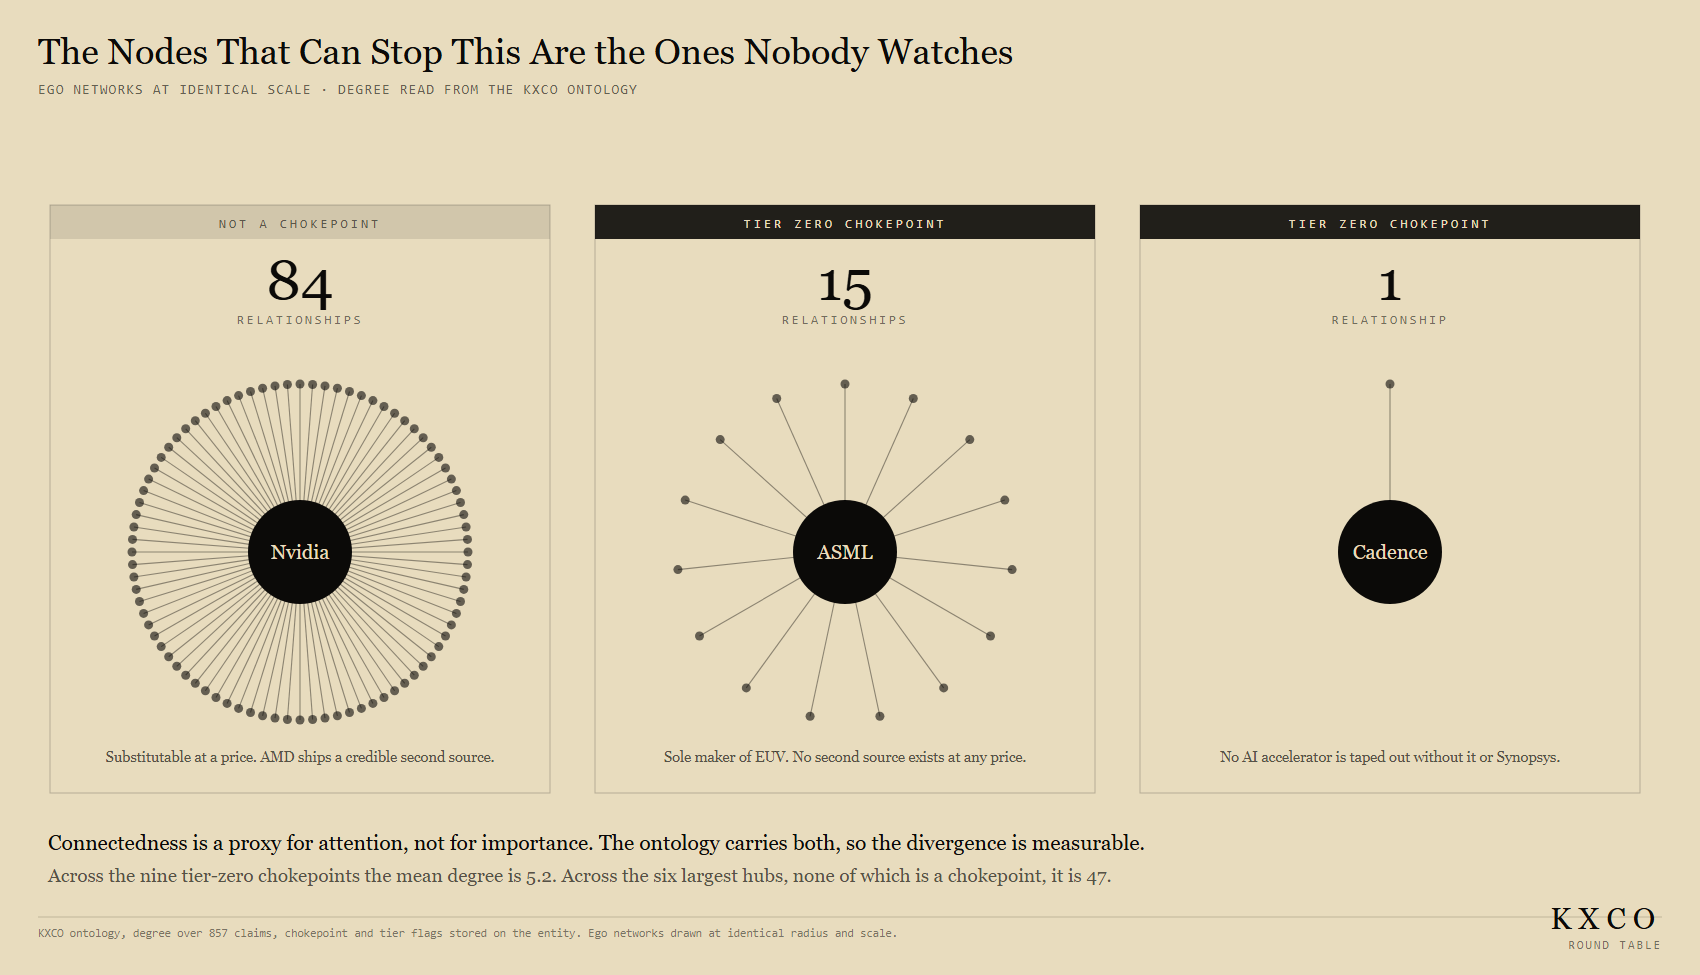
Nvidia has 84 relationships in the graph, more than any other entity by a wide margin, and it is not flagged as a chokepoint, because AMD ships a credible second source at a price. ASML has 15, and there is no second source at any price. Cadence has one single relationship in the entire graph, and no AI accelerator on earth is taped out without Cadence or Synopsys.
One edge. On a component that can halt the industry.
Across the nine tier zero chokepoints the mean degree is 5.2. Across the six largest hubs, not one of which is a chokepoint, it is 47. The nodes that can stop the line have roughly a ninth of the connectivity of the nodes everyone watches.
That inverse relationship is not a quirk of our data collection. It is what a chokepoint is. A company becomes a single point of failure precisely by being the only party to a narrow, unglamorous, deeply technical transaction that generates almost no news and therefore almost no edges. Connectedness in a graph like this is a reasonable proxy for how much attention something attracts. It is close to worthless as a proxy for how much depends on it.
Which is a warning about method as much as about markets. Any analysis that ranks importance by prominence, and most do, will systematically miss the things most capable of breaking. You need the criticality flag stored next to the connection count to see it, and you need to be willing to look at the sparse corner of your own graph.
The money that comes back
One more structural feature deserves attention, because it changes how the reported numbers should be read.
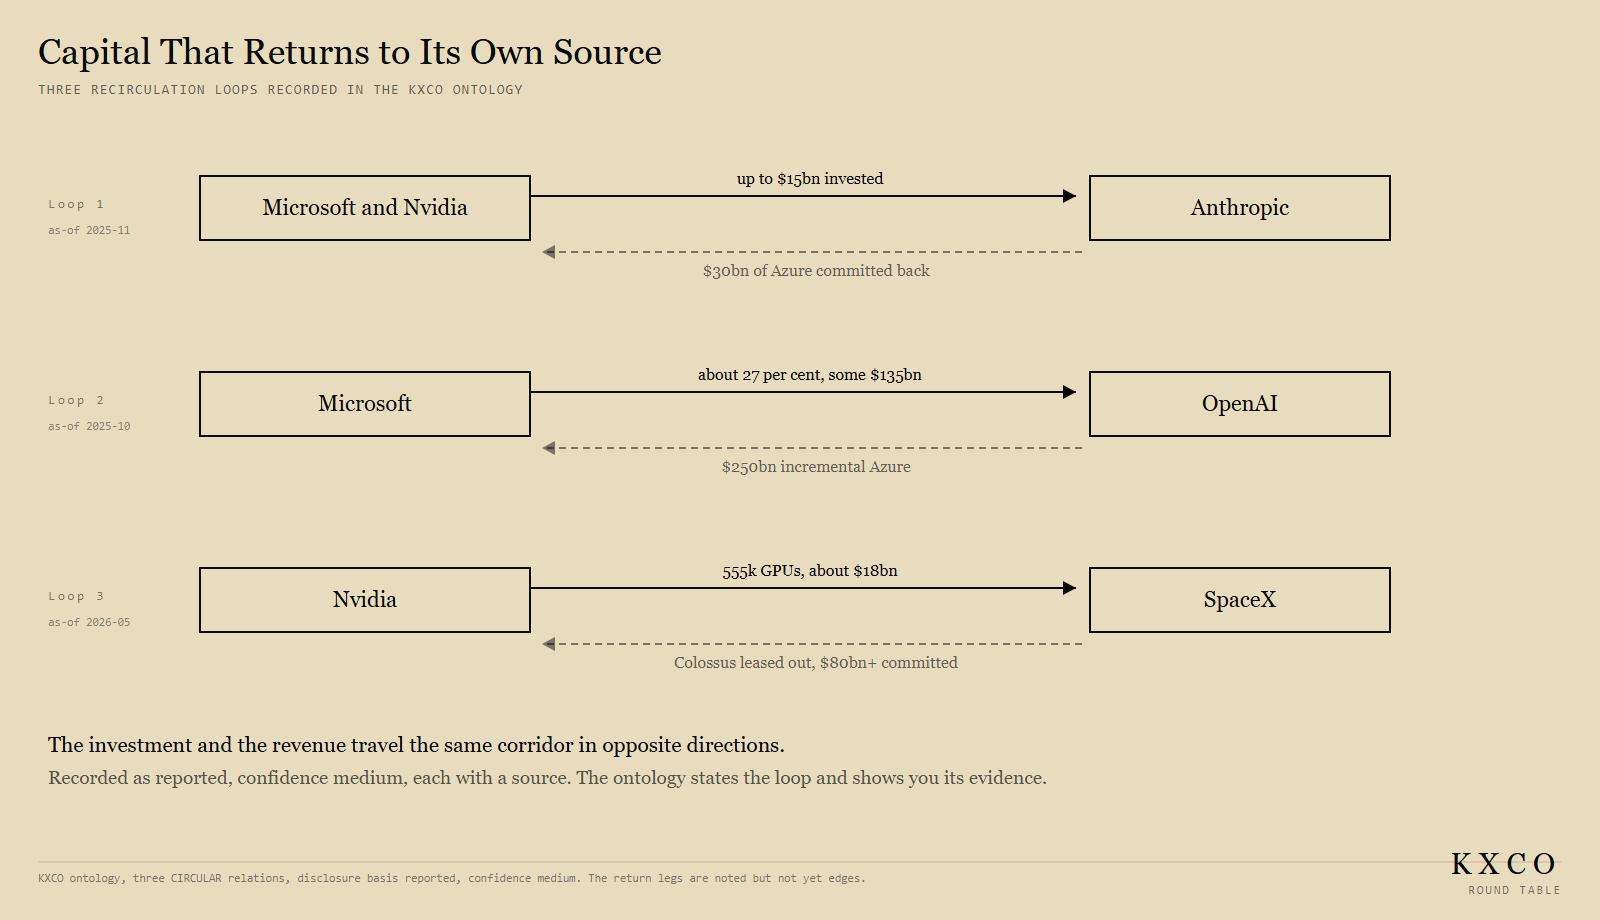
Capital in this sector frequently returns to the entity that supplied it.
Microsoft and Nvidia commit up to 15 billion dollars to Anthropic. Anthropic commits 30 billion dollars of Azure spend. Microsoft invests over 13 billion in OpenAI and holds roughly 27 per cent. OpenAI runs on Azure with a 250 billion dollar incremental commitment. Nvidia supplies SpaceX roughly 555,000 GPUs for about 18 billion dollars. SpaceX leases that capacity out against more than 80 billion dollars of committed revenue and reinvests in more Nvidia hardware. Nvidia invests 2 billion in CoreWeave, and CoreWeave buys Nvidia GPUs. AMD invests up to 5 billion in Anthropic, and Anthropic buys roughly 2 gigawatts of AMD MI450.
These are disclosed, reported arrangements between public companies, not a scandal. But the direction of travel matters for anyone reading a revenue line. When investment and revenue travel the same corridor in opposite directions, headline demand figures contain a component that is structurally different from a customer arriving with outside money. How large that component is, nobody outside these companies can say precisely.
There is an honest caveat here, and I would rather state it than let the graphic imply more than it holds. Our own record marks these three as recirculation loops and cites a source for each, at medium confidence. What it does not yet do is model both legs as separate traceable relationships. The outbound investment is recorded as a link. The return leg, the Azure commitment or the GPU repurchase, currently sits in the note attached to the claim rather than as an edge you can traverse. Which means that at the moment the system asserts the loop rather than demonstrating it. That is a gap in our modelling, we found it by interrogating our own graph, and it is being closed. Saying so is cheaper than being caught later.
Why power decides economic growth
Step back from the sector and the linear view carries a larger implication.
If AI delivers even a fraction of the productivity gain claimed for it, then AI becomes an input to output across the whole economy rather than a sector within it. And if AI is downstream of compute, which is downstream of power, then national economic growth acquires a dependency on electricity that it has not had since the middle of the twentieth century.
This inverts a comfortable assumption. Advanced economies spent forty years decoupling growth from energy consumption, moving from heavy industry into services and software, and treating declining energy intensity as a mark of sophistication. That decoupling is now partially reversing. The most valuable new output in the economy is energy intensive at the point of production, and the countries best positioned to produce it are the ones with generation headroom and the willingness to build.
Which reframes the top five entirely. On the power layer the ranking was China, the United States, India, Russia, Japan. As a list of electricity producers that is a piece of trivia. As a list of countries with the physical capacity to convert energy into intelligence, and therefore into productivity, and therefore into growth, it is a strategic map. India in particular, third in generation with data centre capacity currently around 1.5 gigawatts and projected past 6.5 gigawatts by 2030, is early on precisely the conversion curve the United States is running out of room on.
Energy policy has become industrial policy has become AI policy. Governments that grasp this are permitting reactors and transmission. Governments that do not are writing model governance frameworks for capability they will be renting from somebody else.
Shayne Heffernan's framing on this is worth repeating as he put it: power equals progress, and countries that are building energy production will be the leaders of the future. The subsequent procurement record has been an eighteen gigawatt argument in favour.
How we know any of this
Everything above is a claim about structure, and structural claims are easy to assert and hard to check. So it is worth being explicit about where these figures come from and how they are held, because the method is the part that generalises.
The company level figures in this piece are not assembled by hand for the occasion. They are read out of a system KXCO builds and runs called Round Table, a proprietary reasoning and provenance engine. Round Table holds entities and the relationships between them as structure rather than prose, and it holds them with their evidence attached. Every relationship carries a magnitude, an as of date, a disclosure basis, a confidence grade and a source.
That last part is what makes it usable for markets work. A claim in Round Table is not a sentence someone wrote. It is a typed link between two identified entities with its provenance travelling alongside it. When this article says Amazon contracted up to five gigawatts from X-energy by 2039, that is a relationship with a confidence grade of high and a citation, and it can be queried, aggregated and audited. When it says the three capital loops are recorded at medium confidence on a reported basis, that grade is a stored property, not a hedge I added while writing.
The public KXCO Ontology is a live showcase of what that engine produces. As of 25 August 2026 it renders 375 entities, 843 typed claims and 2.4 trillion dollars of tracked capital flows across the AI and compute sector.
It should be said clearly that this is a small demonstration and not the product. An AI sector map is a convenient showcase because the domain is public, fast moving and something readers can check independently. The engine underneath is domain agnostic. The same structure holds a supply chain, a counterparty network, a set of regulatory obligations, a group's legal exposure or a signed document trail. The sector ontology is the sample, deliberately chosen to be verifiable. It is a window into the machine, not the machine.
It is also worth being precise about what such a system is and is not. An ontology is an instrument, not an oracle. It does not know things. It records what has been claimed, by whom, on what date, with what backing, and it makes the shape of that record inspectable. When the record is thin, a good instrument shows you that it is thin. The most valuable output of this exercise was not a number in the graph. It was discovering that our own circular capital loops were asserted rather than traversable, which is the sort of finding you only get from a system built to be interrogated rather than believed.
Information, thought, and why KXCO builds this at all
There is a reason this matters beyond one sector map, and it is the thread running through everything KXCO builds.
Information does not produce good decisions. Structured information that a person can reason over produces good decisions. The distance between those two statements is the entire problem.
We are not short of information about AI. We are drowning in it. Announcements, funding rounds, gigawatt targets, benchmark scores, partnership press releases, all arriving faster than anyone can integrate them and each one framed by whoever released it. The volume actively degrades judgement, because the effort of maintaining a coherent picture rises faster than the value of any single new fact. What arrives is not knowledge. It is noise with citations.
The purpose of holding information as structure with provenance attached is to make thought possible again at that volume. When 375 entities and 843 sourced claims sit in a form you can query, you can ask a question no volume of reading answers: what closes, what does not, what depends on what, where is the evidence thin. You can find out that three loops you believed in do not actually close. That is thinking, and it was unavailable in the prose version of the same facts.
Thought is the point. It is the centre of everything KXCO does, and it is the honest reason the company builds provenance infrastructure rather than another interface to a model. Cryptographic identity, post quantum signing, attestation, chain anchoring, ontology: these are not separate products with a common brand. They are one argument expressed in different layers. If a claim cannot be traced to a source, dated, graded and checked, it cannot be reasoned over. It can only be believed or disbelieved. A world that runs on unverifiable claims does not think. It reacts, at speed, at scale, and confidently in the wrong direction.
The graphics in this article are watermarked and the numbers behind them are queryable for exactly that reason. Not to establish that we are right. To make it possible for a reader to establish that we are wrong.
Which brings the argument back to the line it started on. Power, compute, AI. Three stations, one direction, and a conversion ratio that decides who leads. That structure was not obvious from reading the news. It became obvious from holding the facts in a form that could be reasoned over. The line was always there. It just needed a system built to see it.
What this means for portfolios
The linear view produces a different shortlist to the one the sector's coverage suggests.
If power is the binding constraint, then the assets with the strongest position are the ones that own generation the hyperscalers must buy. Constellation, Vistra and Talen have been repriced from utilities into growth assets on exactly this logic, and the small modular reactor developers, Oklo and NuScale among them, are early stage bets on delivery dates a decade out.
If conversion is where value accrues, the position sits with the picks and shovels of the conversion station: Nvidia at the toll booth, AMD as the credible second source, Vertiv in power and cooling, Equinix in colocation, and the memory makers whose shortage is the most acute in the chain.
If integration across all three stations is the durable moat, that is Amazon, Alphabet, Meta and Microsoft, with the caveat that each is also carrying the cost of underwriting a generation fleet that does not exist yet.
And the chokepoints deserve their own line of thinking, because ASML, Synopsys, Cadence and the HBM makers hold positions that are close to unassailable and almost entirely unhedged. A reader worried about concentration risk in AI should be looking there, not at model leaderboards.
More detail on the equity implications is set out at shayneheffernan.com and across the Live Trading News coverage of compute, electricity and the semiconductor supply chain.
Stocks mentioned in this article: $NVDA, $MSFT, $AMZN, $GOOGL, $META, $AMD, $ORCL, $ASML, $SNPS, $CDNS, $MU, $CEG, $VST, $TLN, $OKLO, $SMR, $VRT, $EQIX, $CRWV and $TSM.
Shayne Heffernan, Ph.D., is the founder of Live Trading News, the KnightsBridge Group, Knightsbridge Law and the KXCO.ai ecosystem spanning post-quantum cryptography, identity, attestation and enterprise ontology.
Graphics generated from the KXCO Ontology via Round Table. Country electricity generation from Ember 2025. Data centre capacity from industry estimates for 2026, with the Chinese figure contested across sources. Model counts from the Stanford AI Index 2026. Company level relationships, magnitudes, dates and confidence grades from the KXCO Ontology, viewable at kxco.ai/ontology-live.

AI Is Being Powered by Tech That Looks Almost Alien
Every frontier AI model runs on chips printed by one Dutch machine. ASML's extreme-ultraviolet scanner fires a laser at up to 50,000 droplets of molten tin a second, per ASML, and bounces the light off mirrors whose deviations are tens of picometres. Veritasium called it the closest thing we have to alien technology. This piece takes the film as the brief and checks it: the machine, High-NA, and the wafer-scale chips and liquid-cooled racks downstream of it.
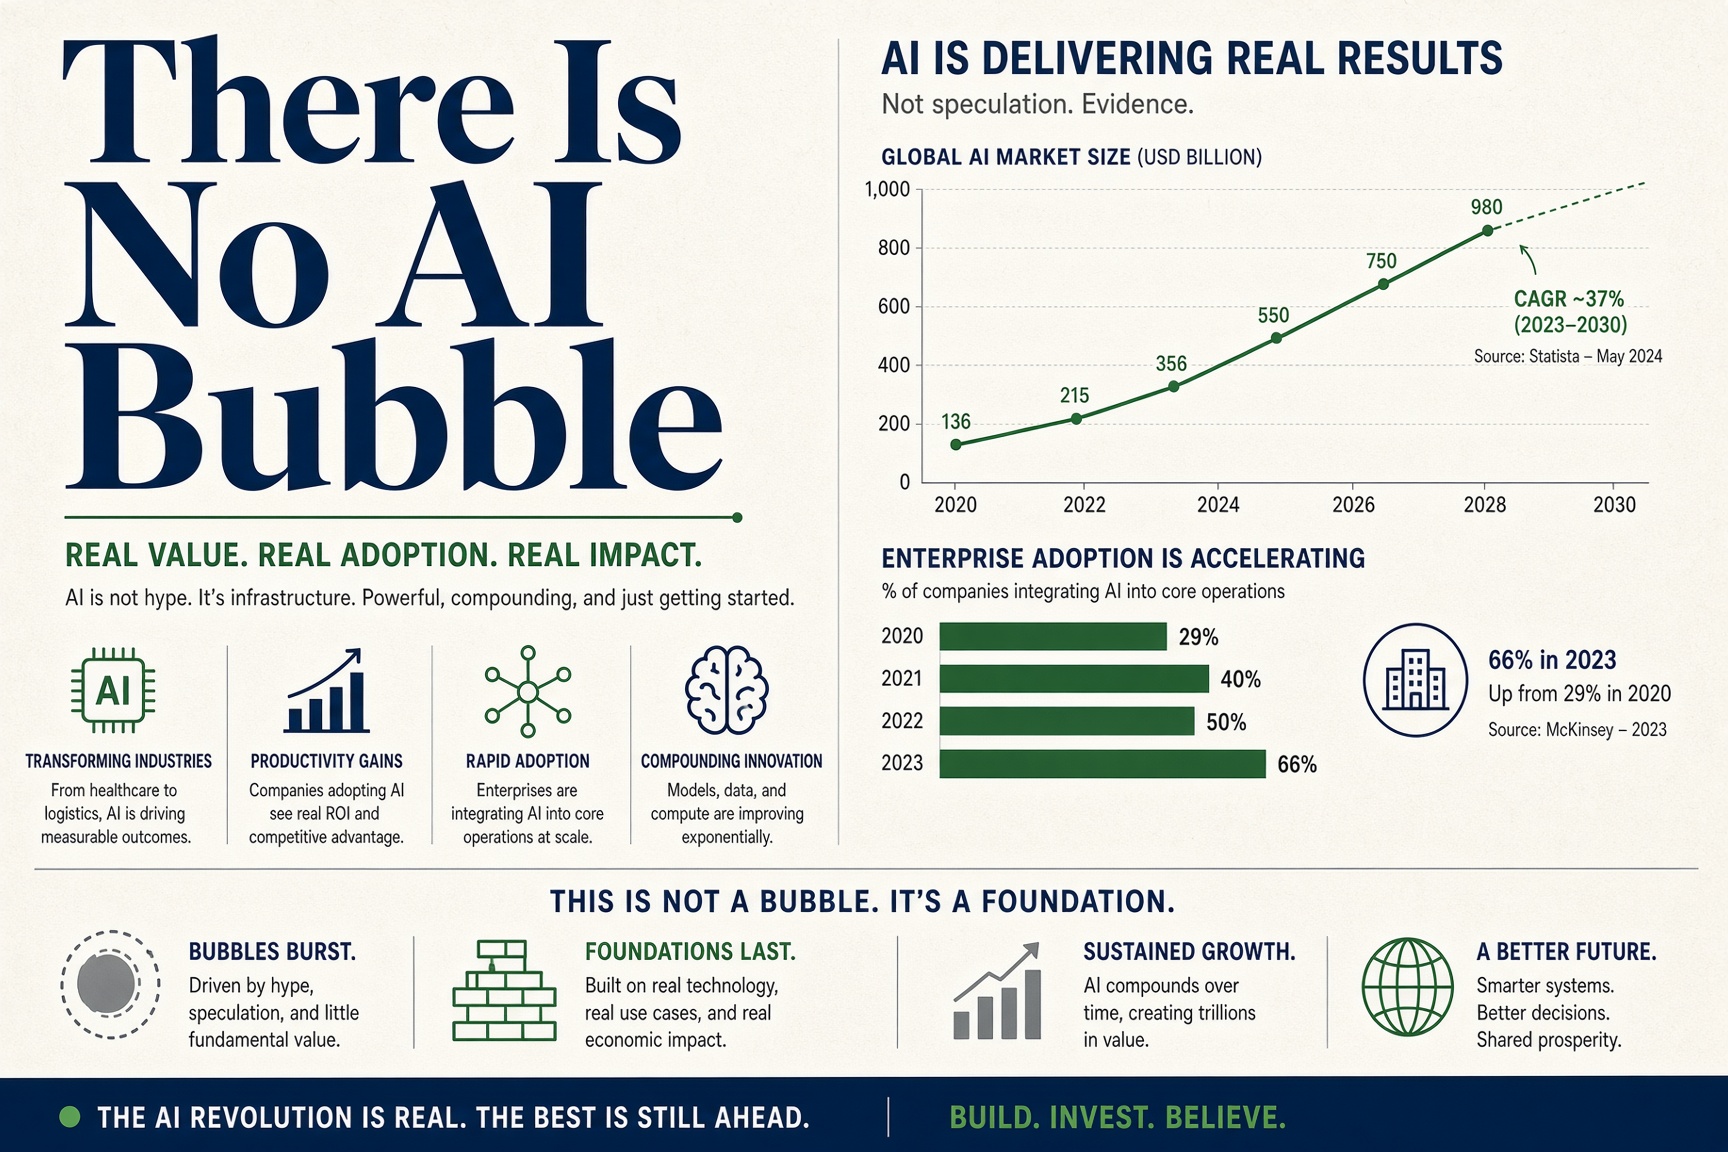
There Is No AI Bubble
There is no AI bubble. A bubble is capacity nobody uses, demand nobody signs for and a glut when the building stops. KXCO's AI sector ontology, refreshed on 7 October 2026, finds the reverse: adoption rising on six independent measures, about $2.35tn of contracted backlog at the four largest sellers of compute per their own reports, and supply rationed at every layer. It keeps the bear case in the same record, 20 circular capital claims, and answers it.

Weekly Market Outlook: Fed Minutes, Anthropic and OpenAI IPOs, Gold, Bitcoin, FX
The Fed raised rates in September and payrolls rose 29,000, per the Labor Department. This week the FOMC minutes, three Treasury auctions and a 10-year near 5.3 percent test that gap. Anthropic's IPO clock runs toward a 14 October investor day while OpenAI's chief executive says not 2026. Gold sits 26 percent below its record, bitcoin near $85,500, the dollar up three weeks running. Two knowledge graphs from KXCO's records map the IPO backers and the FDA board.
Thoughts on Thinking in an AI World
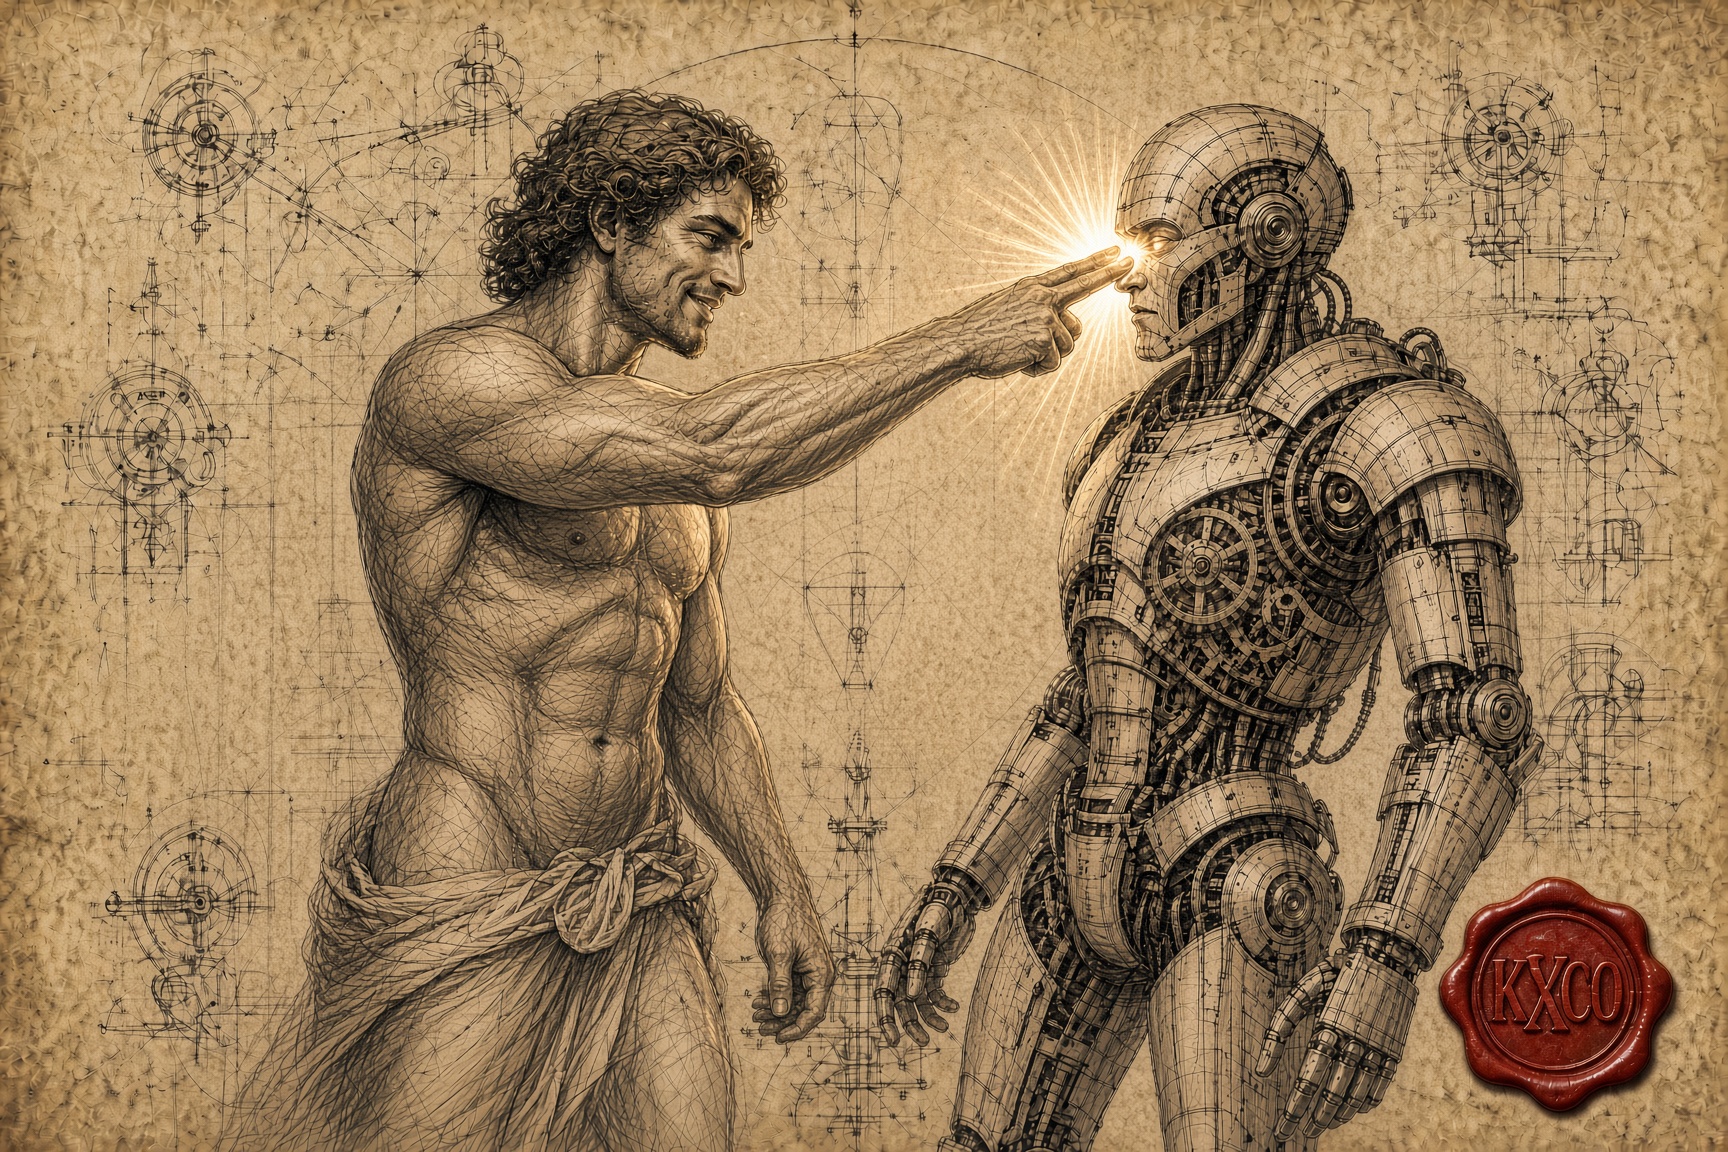
A model will write an answer about anything in seconds. What an AI world makes scarce is everything around the answer: what you believed last month and why you changed it, the link between fields nobody reads together, and a decision a named person can stand behind. Three knowledge-graph exhibits from the KXCO record show each one, from a reported Nvidia deal that became a signed 8-K to a war five links from a data centre.
Every story, signed and delivered.
Subscribe to the kxco channel and get the headline, the AI-written key takeaways, and the chain-anchor link the moment we publish. Audio versions and per-ticker subscriptions arrive in the next iteration.