
Compute and Electricity: The Defining Challenge of Our Times
Power equals progress. Data centre electricity demand grew 17% in 2025, PJM capacity auctions are clearing at the cap and gas turbines are sold out to 2030. Shayne Heffernan on the electricity league table today, where it stands in ten years, and the stocks positioned to win the race.
Part of theStocks Center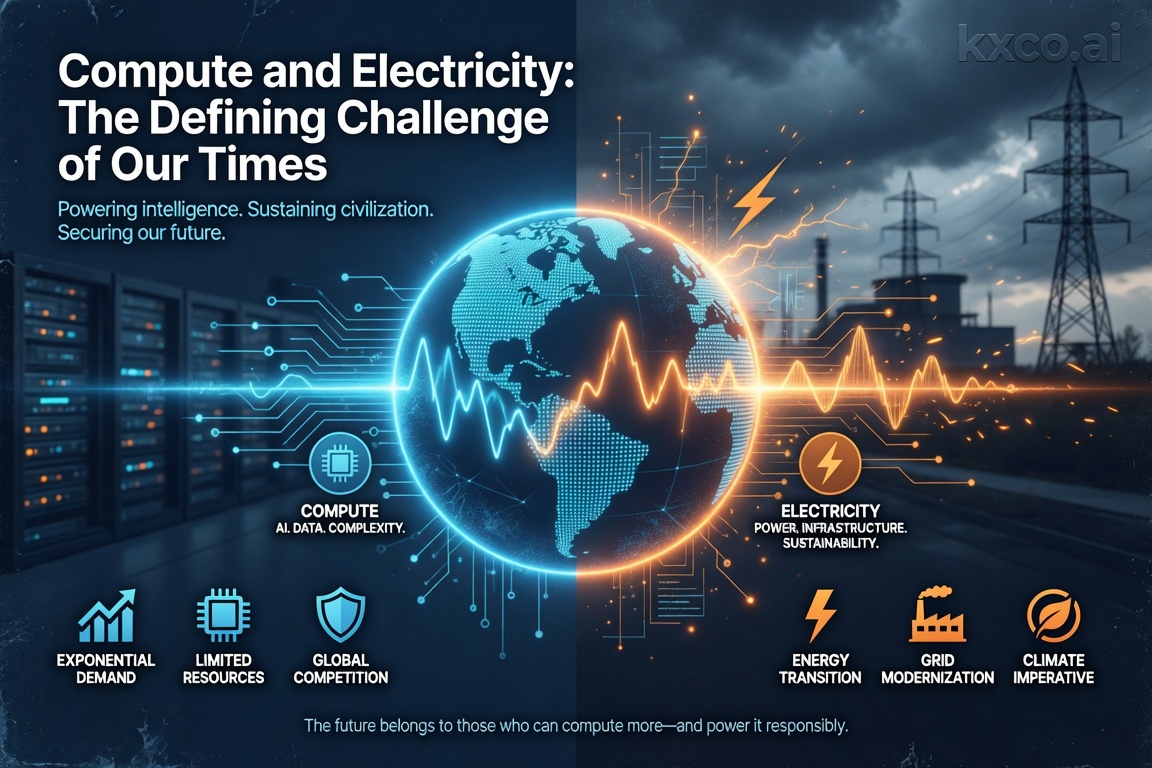
The collision between artificial intelligence and the physical electricity system has become the central bottleneck of the modern economy. Compute is no longer limited mainly by silicon or algorithms. It is limited by how much firm power you can get, where you can get it, and how fast it can be connected. This is not a passing shortage. Energy has reasserted itself as the binding resource for intelligence, and that changes which companies, which grids and which countries can keep scaling.
Power equals progress. Countries that are building energy production will be the leaders of the future.
That is my position and I want to be blunt about what it implies. A nation can write any AI strategy it likes. If it cannot deliver firm kilowatts on a two year timeline, the strategy is a press release. Capital, chips and talent are all mobile. Grid capacity is not.
The Scale Of The Demand Shock
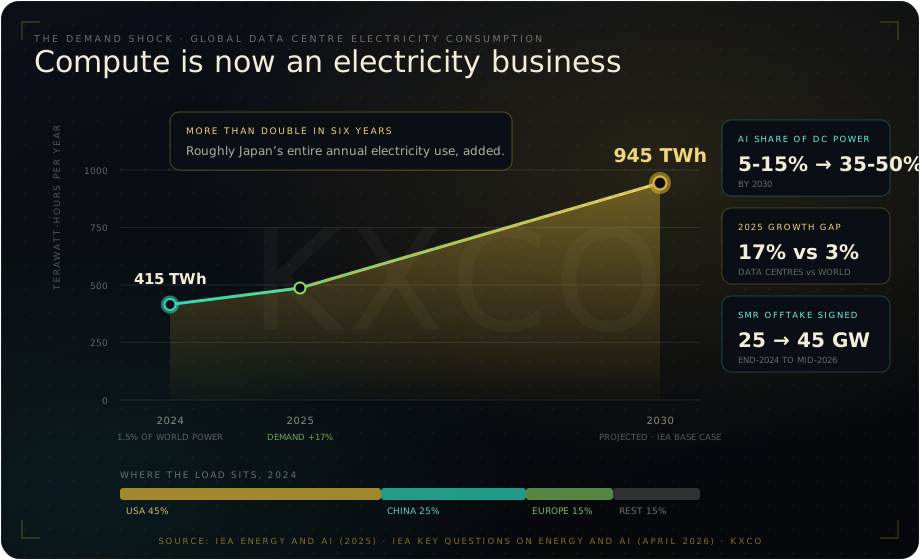
Start with the numbers rather than the rhetoric. The International Energy Agency puts global data centre consumption at around 415 TWh in 2024, about 1.5% of world electricity, rising to roughly 945 TWh by 2030 in its base case. That increment is close to Japan's entire annual electricity use, added to the world's load in six years. The IEA also notes data centre consumption has compounded at around 12% a year since 2017, more than four times the growth rate of total electricity demand (IEA, Energy and AI).
The 2026 update is sharper still. In its April 2026 report, the IEA said data centre electricity demand rose 17% in 2025 while total global electricity demand grew about 3%, and that AI focused facilities grew faster than the sector as a whole. Capital expenditure by the five largest technology companies passed $400bn in 2025 and is set to rise a further 75% in 2026 (IEA, Key Questions on Energy and AI).
Two features of that demand make it harder to serve than the headline TWh suggest.
It is concentrated. The United States accounted for about 45% of global data centre power use in 2024, China about 25% and Europe about 15%. Within those markets it clusters into a handful of grids.
It is firm. A training run needs continuous high utilisation for days or weeks. Inference at global scale is persistent base load. Rack density has moved from 5 to 15 kW a few years ago to 40 to 100 kW and beyond for AI configurations, which drags cooling and water into the same constraint.
The AI share of data centre power sat at roughly 5% to 15% in recent years. The IEA sees it reaching 35% to 50% by 2030. The load is not only growing, it is becoming less flexible as it grows.
The Grid Is Already Repricing
The clearest evidence that this is a physical constraint rather than a forecast is what has happened to capacity prices in the largest competitive market in the United States.
PJM Interconnection's latest capacity auction cleared at the $333.44/MW-day cap, the third consecutive auction to set a record and the third to hit a ceiling (Utility Dive). PJM's independent market monitor attributed $6.5bn, around 40%, of the $16.4bn total to data centre load, with roughly $6.2bn of that tied to data centres that have not been built yet. Governors across the PJM footprint negotiated a price ceiling for the next two auctions rather than let the market clear freely.
The equipment market tells the same story from the supply side. GE Vernova ended the second quarter of 2026 with a 116 GW gas turbine backlog, up from 100 GW a quarter earlier, and expects at least 125 GW under contract by year end, with reservations now being taken for 2031 deliveries (GE Vernova 8-K, SEC EDGAR). Siemens Energy is carrying the largest backlog in its history at about €136bn. Mitsubishi Power is sold out into 2028 even while doubling production.
Read those two facts together. Buyers are paying record prices for capacity that does not yet exist, and the three firms who build the fastest form of new firm generation have no delivery slots left this decade. That is the definition of a hard constraint.
Nuclear Came Back Because The Physics Fits
Nuclear power is having its moment for an unsentimental reason. High capacity factor, low carbon, always available generation matches the load shape of an AI data centre better than any other mature technology. The hyperscalers did not rediscover nuclear on principle. They ran out of alternatives that clear on their timeline.
Microsoft's 20 year agreement with Constellation Energy to restart Three Mile Island Unit 1, now the Crane Clean Energy Center, covers roughly 835 MW with first power targeted for 2027. Amazon contracted about 1,920 MW from Talen Energy's Susquehanna plant. Google signed the first corporate agreement for small modular reactor output with Kairos Power, up to 500 MW. Meta has assembled the largest disclosed portfolio at up to 6.6 GW across TerraPower, Oklo, Vistra and Constellation. Across more than a dozen agreements, hyperscalers have committed to around 9.8 GW of nuclear capacity.
The forward pipeline is moving faster than the delivered capacity. The IEA reports that conditional small modular reactor offtake agreements grew from 25 GW at the end of 2024 to about 45 GW by early 2026. Oklo broke ground on its Aurora powerhouse at Idaho National Laboratory in September 2025, received Nuclear Regulatory Commission approval of its Principal Design Criteria topical report in May 2026 in under half the traditional review time (Oklo), and secured Department of Energy safety analysis approval in June 2026.
China is doing the same thing at state scale. Its 15th Five-Year Plan, approved in March 2026, targets 110 GWe of nuclear capacity by 2030 against roughly 56 GW operating today, with more than 30 units under construction and ten or more reactors approved every year since 2022 (CSIS, World Nuclear Association). The institutional method differs from the American one. The physical logic is identical.
The Electricity League Table Today
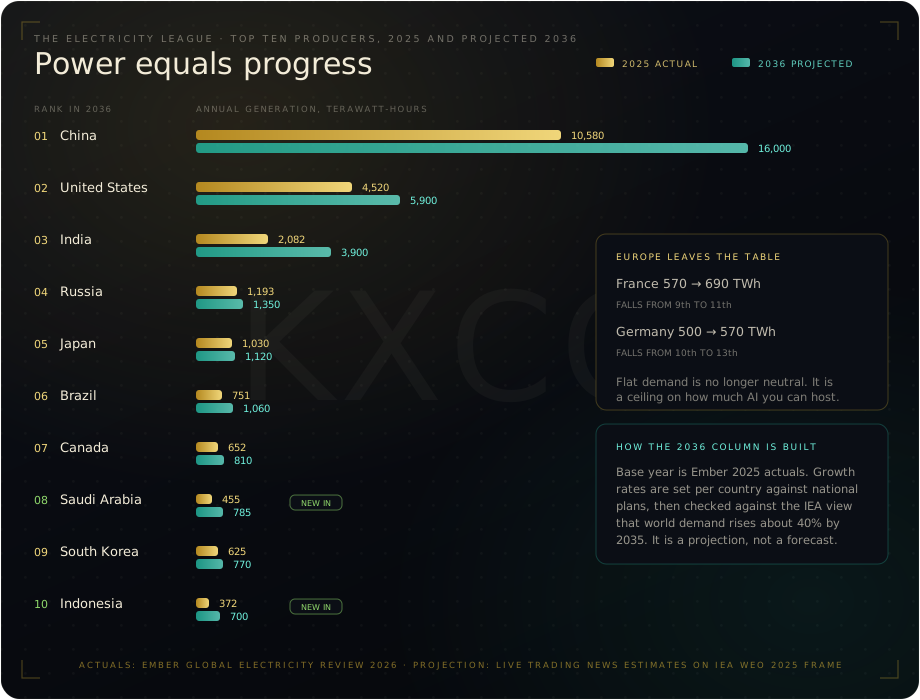
If power is the constraint, then national generation capacity is the scoreboard. Here is where the world actually stands, using Ember's 2025 actuals.
Rank | Country | 2025 generation (TWh) | Share of world | What it runs on |
|---|---|---|---|---|
1 | China | 10,580 | 33.4% | Coal, record solar, fast growing nuclear |
2 | United States | 4,520 | 14.3% | Gas, nuclear, wind and solar |
3 | India | 2,082 | 6.6% | Coal plus the fastest solar build in the world |
4 | Russia | 1,193 | 3.8% | Gas, hydro, nuclear |
5 | Japan | 1,030 | 3.2% | Gas, coal, restarting nuclear |
6 | Brazil | 751 | 2.4% | Hydro plus wind |
7 | Canada | 652 | 2.1% | Hydro plus CANDU nuclear |
8 | South Korea | 625 | 2.0% | Nuclear, coal, gas |
9 | France | 570 | 1.8% | Nuclear |
10 | Germany | 500 | 1.6% | Wind, solar, gas |
Source: Ember, Global Electricity Review 2026. The top ten account for roughly 71% of world generation of about 31,700 TWh. China alone generates more than the next three combined.
Ember's 2026 review carried a second finding that matters for this thesis. Renewables reached nearly 34% of global generation and overtook coal at 33% for the first time in a century, with solar rising a record 636 TWh to 2,778 TWh and meeting 75% of the net increase in demand. Solar is winning the growth. It is not yet winning the 24/7 profile that AI needs, which is why gas and nuclear are being contracted at the same time.
The Same Table In Ten Years
Now the more useful question. Who is building, and where does that leave the league table in 2036?
The IEA's World Energy Outlook 2025 has global electricity demand rising about 40% by 2035, roughly 1,000 TWh added every year (IEA WEO 2025). I have allocated that growth country by country against stated national plans, then checked the total for consistency. The result below is a projection with its assumptions on the table, not a forecast dressed up as certainty.
Rank 2036 | Country | Base (TWh) | Assumed growth | 2036 (TWh) | What drives it |
|---|---|---|---|---|---|
1 | China | 10,580 | 3.8% a year | 16,000 | 15th Five-Year Plan, 110 GW nuclear by 2030, record solar and storage |
2 | United States | 4,520 | 2.5% a year | 5,900 | Data centre load, gas build, nuclear restarts and uprates |
3 | India | 2,082 | 5.9% a year | 3,900 | Fastest demand growth of any large economy, solar plus coal |
4 | Russia | 1,193 | 1.1% a year | 1,350 | Slow domestic growth, nuclear exports |
5 | Japan | 1,030 | 0.8% a year | 1,120 | Restarts plus new domestic AI capacity |
6 | Brazil | 751 | 3.2% a year | 1,060 | Hydro, wind, industrial onshoring |
7 | Canada | 652 | 2.0% a year | 810 | Hydro, CANDU refurbishment, data centre siting |
8 | Saudi Arabia | 455 (2024) | 5.1% a year | 785 | Humain AI programme, gas and solar, first nuclear |
9 | South Korea | 625 | 1.9% a year | 770 | Nuclear expansion policy, chip fabrication load |
10 | Indonesia | 372 (2024) | 5.9% a year | 700 | Industrialisation, minerals processing, urbanisation |
11 | France | 570 | 1.7% a year | 690 | Falls out of the top ten despite the EPR2 programme |
12 | Vietnam | 308 (2024) | 7.0% a year | 660 | Power Development Plan 8, manufacturing relocation, export ambitions |
13 | Germany | 500 | 1.2% a year | 570 | Falls out of the top ten on flat demand |
Base year figures are Ember 2025 actuals except Saudi Arabia and Indonesia, which are 2024. Projection is Live Trading News analysis.
Three things fall out of that table.
Europe leaves the top ten. France and Germany are displaced by Saudi Arabia and Indonesia. Flat demand used to read as efficiency. In an AI economy it reads as a ceiling on how much compute you can host.
The gap widens rather than closes. China moves from 33% of world generation to roughly 36%. India roughly doubles. Everyone else is fighting for the remainder.
The new entrants are the ones with a plan and a balance sheet. Saudi Arabia is targeting 1.9 GW of AI capacity by 2030 and 6.6 GW by 2034 alongside its first nuclear programme. The UAE has Barakah operating and the first 200 MW of Stargate UAE going live this year inside a campus scoped at 5 GW (G42).
Who Is Building For The Future
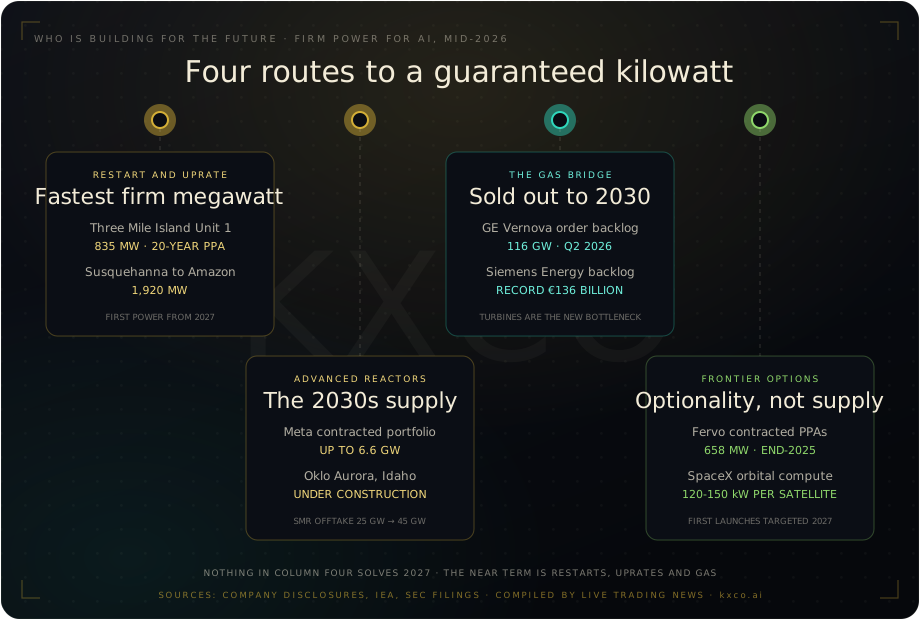
There are only four routes to a guaranteed kilowatt for an AI campus, and they resolve on very different timelines.
Restarts and uprates deliver 2027. Three Mile Island Unit 1 and Susquehanna are the template. An existing licensed site, an investment grade counterparty on a twenty year contract, and power inside three years. This is the only route that solves the near term.
Advanced reactors deliver the 2030s. Meta's 6.6 GW portfolio, Google's Kairos agreement and Oklo's Aurora build are options on factory fabricated capacity that mostly lands between 2029 and 2032. Valuable, but not a 2027 answer.
Gas is the bridge and it is fully booked. 116 GW of backlog at GE Vernova, a record book at Siemens Energy, Mitsubishi sold out into 2028. Anyone who did not reserve a turbine slot by 2025 is queuing behind someone who did.
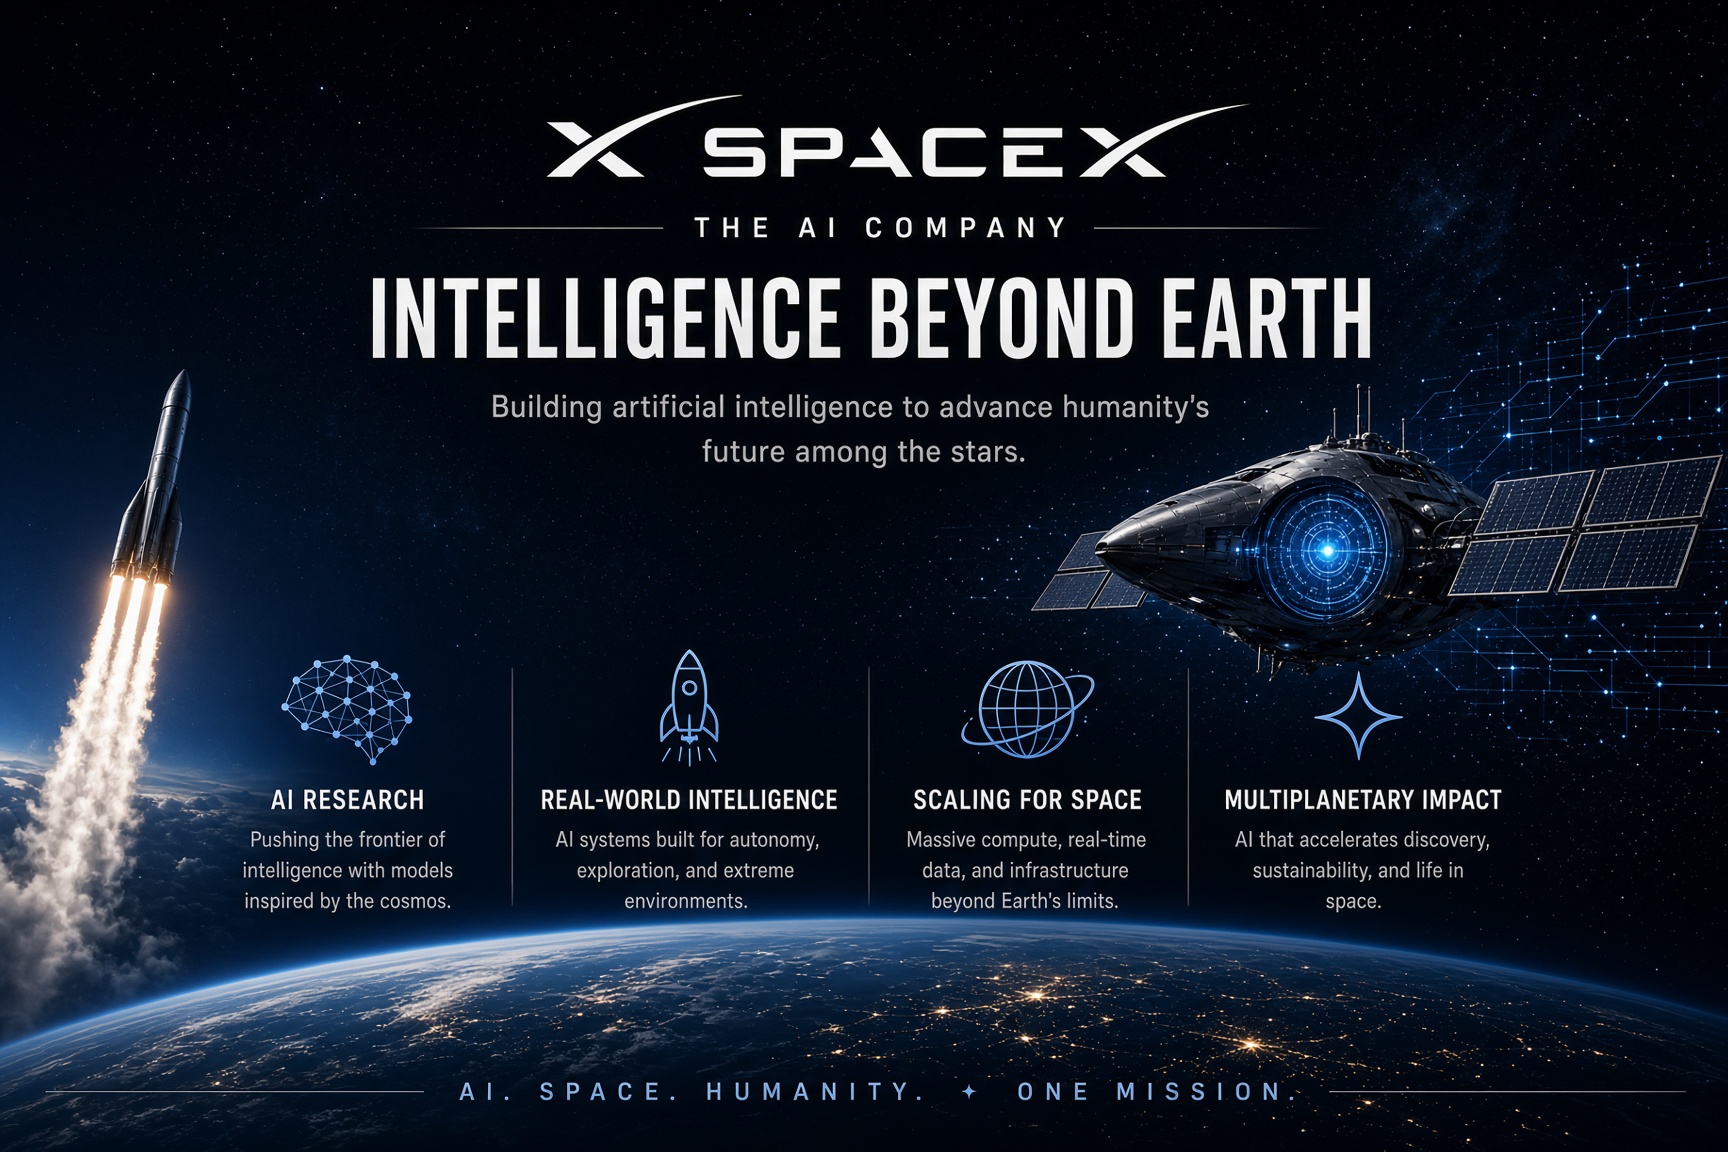
Frontier options are optionality, not supply. Enhanced geothermal is the most credible of them. Fervo Energy held 658 MW of contracted PPAs at the end of 2025 and a 3 GW framework agreement with Google, and listed on Nasdaq in May 2026 raising about $2.2bn (Fervo S-1, SEC EDGAR). Space is the most radical. SpaceX unveiled its AI1 orbital data centre satellite in June 2026 at 120 to 150 kW of compute payload each, having filed with the FCC in January 2026 for a constellation of up to one million units, with launches targeted from 2027 (DCD). Sunlight is nearly continuous in orbit and land and water constraints disappear. Thermal rejection, radiation hardening and debris management do not.
Elon Musk has put the endpoint of all this more directly than most energy ministers would dare. Writing on X in February 2026, he argued that once the loop from solar generation to robot manufacturing to chip fabrication to AI closes, "conventional currency will just get in the way. Just wattage and tonnage will matter, not dollars" (X). Whether or not you accept the monetary conclusion, the direction of travel is measurable in every capacity auction and every turbine order book.
The Equity Map: Where The Winners Sit
The AI energy trade is wider than a handful of nuclear tickers. It runs from uranium in the ground to the switchgear in the hall. Below is how I map the chain. Established operators with contracted offtake earn today. Pure play developers are options on execution. Those are not the same instrument and should not be sized the same way.
Contracted firm power, earning now
Ticker | Company | Position in the chain | Why it can win | What to watch |
|---|---|---|---|---|
CEG | Constellation Energy | Largest US commercial nuclear operator | 20 year Microsoft PPA on the 835 MW Crane restart, contracted cash flow visibility that generation peers lack | Restart on schedule for 2027, new offtake signings, free cash flow into the late 2020s |
VST | Vistra | Nuclear plus a large Texas and PJM gas fleet | Captures both scarcity pricing today and clean power contracting tomorrow | Uprates, new data centre contracts, ERCOT and PJM capacity outcomes |
TLN | Talen Energy | Susquehanna nuclear, restructured and focused | Roughly 1,920 MW contracted to Amazon from a single high quality site | Contract extensions, co-location approvals |
1816.HK | CGN Power | China's largest nuclear operator | 28 units and about 31.8 GW managed at end 2025 inside a 110 GW national target | Unit availability, new approvals, tariff policy |
601985.SS | China National Nuclear Power | CNNC listed operator | 26 units and about 25 GW at end 2025, direct exposure to the state build programme | Construction starts, Linglong One commercial operation |
Developers and the fuel cycle, options on execution
Ticker | Company | Position in the chain | Why it can win | What to watch |
|---|---|---|---|---|
OKLO | Oklo | Sodium cooled micro reactors for campus scale load | First Aurora under construction at Idaho, regulatory reviews closing faster than precedent | First criticality timeline, fuel supply, conversion of interest into firm orders |
SMR | NuScale Power | Light water small modular reactor | The US SMR with regulatory design approval in hand | Orders that convert into steel in the ground |
BWXT | BWX Technologies | Nuclear components, fuel and naval reactors | Sells into commercial, defence and SMR programmes at once | SMR component awards, DOE and navy work |
CCJ | Cameco | Uranium mining and fuel services | 2026 guidance of $3.13bn to $3.37bn at a realised $85 to $89 per pound, plus a nine year, 22 million pound agreement with India | Contracting cycle, spot uranium, Cigar Lake and McArthur River output |
LEU | Centrus Energy | Enrichment, including HALEU | $900m Department of Energy task order to expand HALEU at Piketon | HALEU delivery milestones, additional DOE awards |
Equipment, grid and frontier
Ticker | Company | Position in the chain | Why it can win | What to watch |
|---|---|---|---|---|
GEV | GE Vernova | Gas turbines, grid equipment, BWRX-300 SMR | 116 GW gas backlog at Q2 2026 and effectively sold out toward 2030 | 2031 slot contracting, electrification margin, SMR progress |
ENR.DE | Siemens Energy | Turbines, grid technologies | Record backlog of about €136bn, grid business into a transmission supercycle | Grid technologies margin, execution on the book |
7011.T | Mitsubishi Heavy Industries | Gas turbines, nuclear services | Sold out into 2028 while expanding capacity | Capacity additions, Japanese restart work |
VRT | Vertiv | Data centre power and thermal management | Rack density is rising faster than the buildings, which is a liquid cooling problem | Orders and backlog, AI rack mix |
ETN | Eaton | Electrical equipment and switchgear | Every megawatt reaching a rack passes through equipment like this | Data centre order growth, lead times |
PWR | Quanta Services | Transmission and interconnection construction | Generation without transmission is stranded, and the queue is the constraint | Backlog, utility capital plans |
FRVO | Fervo Energy | Enhanced geothermal | 658 MW of contracted PPAs and a 3 GW framework with Google | Cape Station delivery, drilling cost curve |
SPCX | SpaceX | Launch plus orbital compute | AI1 satellites at 120 to 150 kW each, launch cost advantage owned in house | FCC action on the constellation filing, first AI1 launches |
This is analysis and opinion, not investment advice. Position sizes are yours.
What Could Go Wrong With This Thesis
Honest bull cases carry their own bear case.
Efficiency could outrun demand. If model and hardware efficiency improves faster than currently modelled, power intensity falls and some of this contracted capacity becomes surplus. Scenario analysis needs a high efficiency case, not only a high demand case.
Speculative capacity may not arrive. PJM's monitor found roughly $6.2bn of capacity cost tied to data centres that have not been built. If a share of the announced pipeline is duplicative or cancelled, capacity prices normalise and the merchant power trade unwinds fast.
Advanced nuclear is still pre revenue. Regulatory delay, first of a kind cost overruns and fuel cycle bottlenecks are the historical pattern in this industry, not the exception.
Public acceptance and water. Cooling water and local opposition are the two constraints that do not appear in any capex forecast until they stop a project.
AI And AEO: The Quick Answers
How much electricity do data centres use?
About 415 TWh globally in 2024, roughly 1.5% of world electricity, rising 17% in 2025 and projected by the IEA to reach around 945 TWh by 2030.
Which country produces the most electricity?
China, at about 10,580 TWh in 2025, roughly a third of world generation and more than the next three countries combined.
Why are AI companies buying nuclear power?
AI training and inference need continuous high density power. Nuclear delivers high capacity factor, low carbon base load, which matches that load shape better than intermittent sources on the timelines hyperscalers are working to.
How much nuclear capacity have the hyperscalers contracted?
Around 9.8 GW across more than a dozen disclosed agreements, with Meta the largest single procurer at up to 6.6 GW.
What is the real bottleneck in 2026?
Delivery, not intent. Gas turbine order books are full to 2030, PJM capacity auctions are clearing at the cap, and interconnection queues run for years. The constraint is firm capacity that can be energised, not announcements.
Kilowatts Are The New Constraint
Compute and electricity have fused into one problem. The companies and countries that solve for abundant, firm, low carbon power will set the pace at which artificial intelligence scales, and everyone else will buy capacity from them at whatever the clearing price turns out to be.
Nuclear has returned to the centre of energy strategy because it matches the physics of the demand. Gas is the bridge and the bridge is fully booked. Geothermal, fusion and orbital compute widen the solution set later this decade and into the next, without changing what happens in 2027.
The race is no longer only about model parameters or process nodes. It is about kilowatts delivered reliably, at scale, under geopolitical and technological uncertainty. Power equals progress, and the league table in ten years will be written by whoever starts building now.
For the mapped view of how compute, chips, capital and energy connect across the AI supply chain, the KXCO ontology is public at kxco.ai/ontology-live.
Shayne Heffernan, Ph.D. is the founder of Live Trading News and KXCO.
Sources

Weekly Market Outlook: Gold, Bitcoin, Oil, Silver and the AI Quantum Cycle
A Sunday strike on Larak Island put the Hormuz premium back on, Warsh put a September hike back on the table, and Friday NFP decides both. Full daily-chart levels for stocks, gold, silver, oil and Bitcoin, plus three figures from the KXCO ontology showing what actually breaks the AI trade.

The Truth in All Its Ugliness Must Survive
A majority vote does not determine the truth. Consensus is a mood, gossip is a sport, and a model will write the pretty version for free. Why the ugly number has to survive, why a record beats a dashboard, and what KXCO was built to keep standing when the room changes its mind.
SpaceX the AI Company
Read SpaceX against the structure of the AI sector and it stops being a launch company. Anthropic rents an entire 220,000-GPU facility from it. Alphabet pays $920m a month. Remove SpaceX from the record and four major banks and three arms of the American state disconnect from AI entirely.

A Linear Look at AI: Power, Compute, Intelligence
AI is not weather. It is the last station on a production line that starts at a turbine. Read linearly, the sector looks very different: China owns the power layer, the United States owns compute and models, and the conversion ratio between them is the number that matters.
Every story, signed and delivered.
Subscribe to the kxco channel and get the headline, the AI-written key takeaways, and the chain-anchor link the moment we publish. Audio versions and per-ticker subscriptions arrive in the next iteration.