
Weekly Market Outlook: Gold, Bitcoin, Oil, Silver and the AI Quantum Cycle
Week of Monday 31 August to Friday 4 September 2026. AI stocks still early in the cycle, quantum still earlier, and the space economy on the rise.
Prepared for Live Trading News readers. Cross-check the live economic calendar at [livetradingnews.com/trading](https://www.livetradingnews.com/trading) and the public AI-sector map at [kxco.ai/ontology-live](https://kxco.ai/ontology-live), the KXCO ontology. This briefing is analysis, not personalized investment advice.
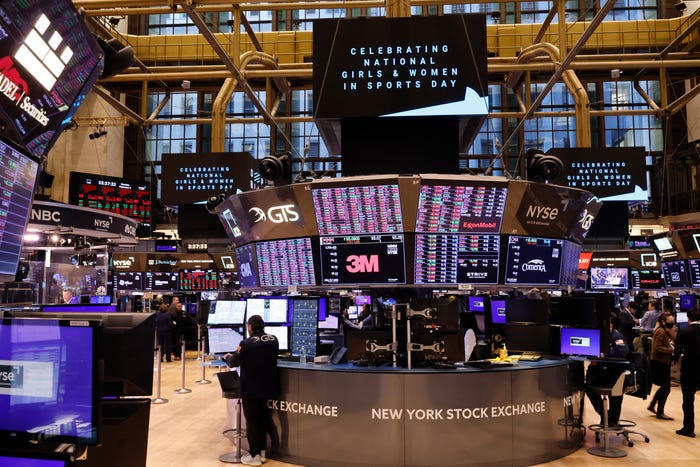
New York Stock Exchange floor. Equities closed Friday 28 August with the S&P 500 near 7,712 after a hawkish Jackson Hole and a late-week commodity selloff.
1. Executive snapshot, the tape into Labor Day week
Markets open this week with three overlapping regimes. The first is monetary. Federal Reserve Chair Kevin Warsh used Jackson Hole on Friday 28 August to tell markets that headline PCE inflation at 3.7 percent and core PCE at 3.3 percent are still too high, and that the policy rate may have to move up in the coming months. The federal funds target remains 3.50 to 3.75 percent, the effective funds rate last printed near 3.63 percent, and interest on reserve balances sits at 3.65 percent. Money markets into the weekend assigned roughly a 57 percent chance of a 25-basis-point hike at the 15 to 16 September FOMC, a meeting that also publishes a Summary of Economic Projections. The 10-year Treasury yield is holding near 4.67 percent and the 30-year near 5.20 percent. That is a long-rate configuration that taxes duration-sensitive growth equities even when short-rate expectations only drift.
The second regime is geopolitical. On Sunday 30 August, yesterday as this week opens, U.S. forces struck Iranian rocket launchers near Larak Island on the Strait of Hormuz, the first confirmed American military action against Iran in about a month. CENTCOM said Revolutionary Guard units were preparing to launch rockets carrying sea mines into the strait after U.S. forces had spent the prior week clearing mines from international shipping lanes. Iran reported casualties among its fighters, called the strike a "fatal mistake," and vowed military and economic retaliation. State television later showed what Tehran described as ballistic missiles aimed at U.S. bases in Jordan. Jordanian forces said they intercepted eight missiles that entered national airspace early Monday. Unconfirmed reports of explosions near U.S. facilities in Qatar circulated overnight. The war that began on 28 February 2026 with the killing of Supreme Leader Ali Khamenei and the initial closure of Hormuz is now in its seventh month. Every flare-up reprices oil first, then inflation expectations, then the Fed path, then AI-capex multiples.
The third regime is structural. Artificial intelligence remains the dominant corporate capital cycle of the decade, but it is still early. Hyperscaler capex for Microsoft, Alphabet, Amazon and Meta alone is guided above $600 billion in fiscal 2026, with broader industry estimates of several trillion dollars of data-center spend through 2030. Quantum computing is earlier still. Commercial revenue at the pure-plays is measured in tens of millions per quarter, not tens of billions, even after IonQ's $80 million second-quarter print. The space economy is the third growth vector that is no longer a science-project trade. SpaceX listed on Nasdaq as SPCX on 12 June 2026 at a roughly $1.77 trillion valuation, Starlink has disclosed about 12 million subscribers, and management is now talking about orbital AI compute as a business that can eclipse launch and connectivity. These three themes, AI, quantum and space, share a physical substrate of chips, power, cooling, launch and cryptography. That is why this briefing keeps returning to the KXCO ontology at kxco.ai/ontology-live. It is a public, sourced map of who depends on whom in the AI stack, and it is the cleanest free tool available for seeing concentration risk before a headline does.
Market | Reference level (late Aug) | Daily-chart support | Daily-chart resistance / magnet |
|---|---|---|---|
S&P 500 | 7,712 | 7,799 ATH / 7,600 to 7,490 | 7,800 then 8,000 |
Nasdaq Composite | 26,402 | 26,000 / 25,400 | 26,700 then 27,500 |
Dow Jones | 53,560 | 52,750 | 54,000 |
Spot gold | ~$4,450 to $4,530 | $4,350 / $4,222 | $4,585 to $4,765 then $5,000 |
Spot silver | ~$66 to $70 | $66.15 / $63.40 | $70.70 / $72.30 / $75 |
WTI crude | ~$83.40 to $83.90 | $80 to $81 / $78 | $85 to $86 then $90 |
Brent | ~$88 to $89.30 | $86 to $87 | $92 to $94 |
Bitcoin | ~$77,400 to $80,000 | $72,700 / $65,500 20-dma | $82,000 / $90,000 |
U.S. 10-year | ~4.67% | 4.50% (risk-on) | 4.85 to 5.00% (hawkish NFP) |
Fed funds target | 3.50 to 3.75% | hold through 16 Sep | 3.75 to 4.00% if hike |
Reference snapshot compiled from Friday 28 August cash closes and weekend wholesale prints. Futures will gap around Hormuz headlines. Treat the table as a map, not a fill.
2. Yesterday's Iran strike, and why the daily oil chart is the week's first risk

Commercial traffic in and around the Strait of Hormuz. A six-month war has already shown that even partial disruption reprices crude, gasoline cracks and inflation breakevens within hours.
The Sunday strike on Larak Island is not a new war. It is the reopening of an old one after a weeks-long lull. The conflict that started on 28 February with U.S. and Israeli opening strikes, Washington's operation named Epic Fury and Israel's named Lions Roar, killed Iran's supreme leader on day one and immediately turned the world's most important oil chokepoint into a contested waterway. Since then the pattern has been grimly consistent: a burst of strikes, a diplomatic opening, a disputed pause, then another kinetic episode. Last week the U.S. Navy finished clearing sea mines from international lanes and oil prices eased on hopes that Hormuz traffic was normalizing. Sunday's action cancelled that hope in a single CENTCOM statement.
The market mechanics are straightforward. Hormuz handles a large share of seaborne crude and a still-larger share of LNG that Asia cannot easily replace. When IRGC units stage rocket-and-mine packages, underwriters widen war-risk premia, shipowners slow or reroute, and the nearby-month crude curve steepens. WTI finished Friday near $83.40 to $83.90 after a 2.8 percent drop on the day and a first weekly decline in three weeks. Brent settled near $89. That weekly decline was a peace-premium fade. Sunday's strike puts the premium back on. Daily-chart traders should treat $80 to $81 in WTI as first structural support and $85 to $86 as the level that confirms the premium has returned. A close back through $90 in Brent would tell inflation desks that the Jackson Hole hawkish tilt just received a commodity tailwind.
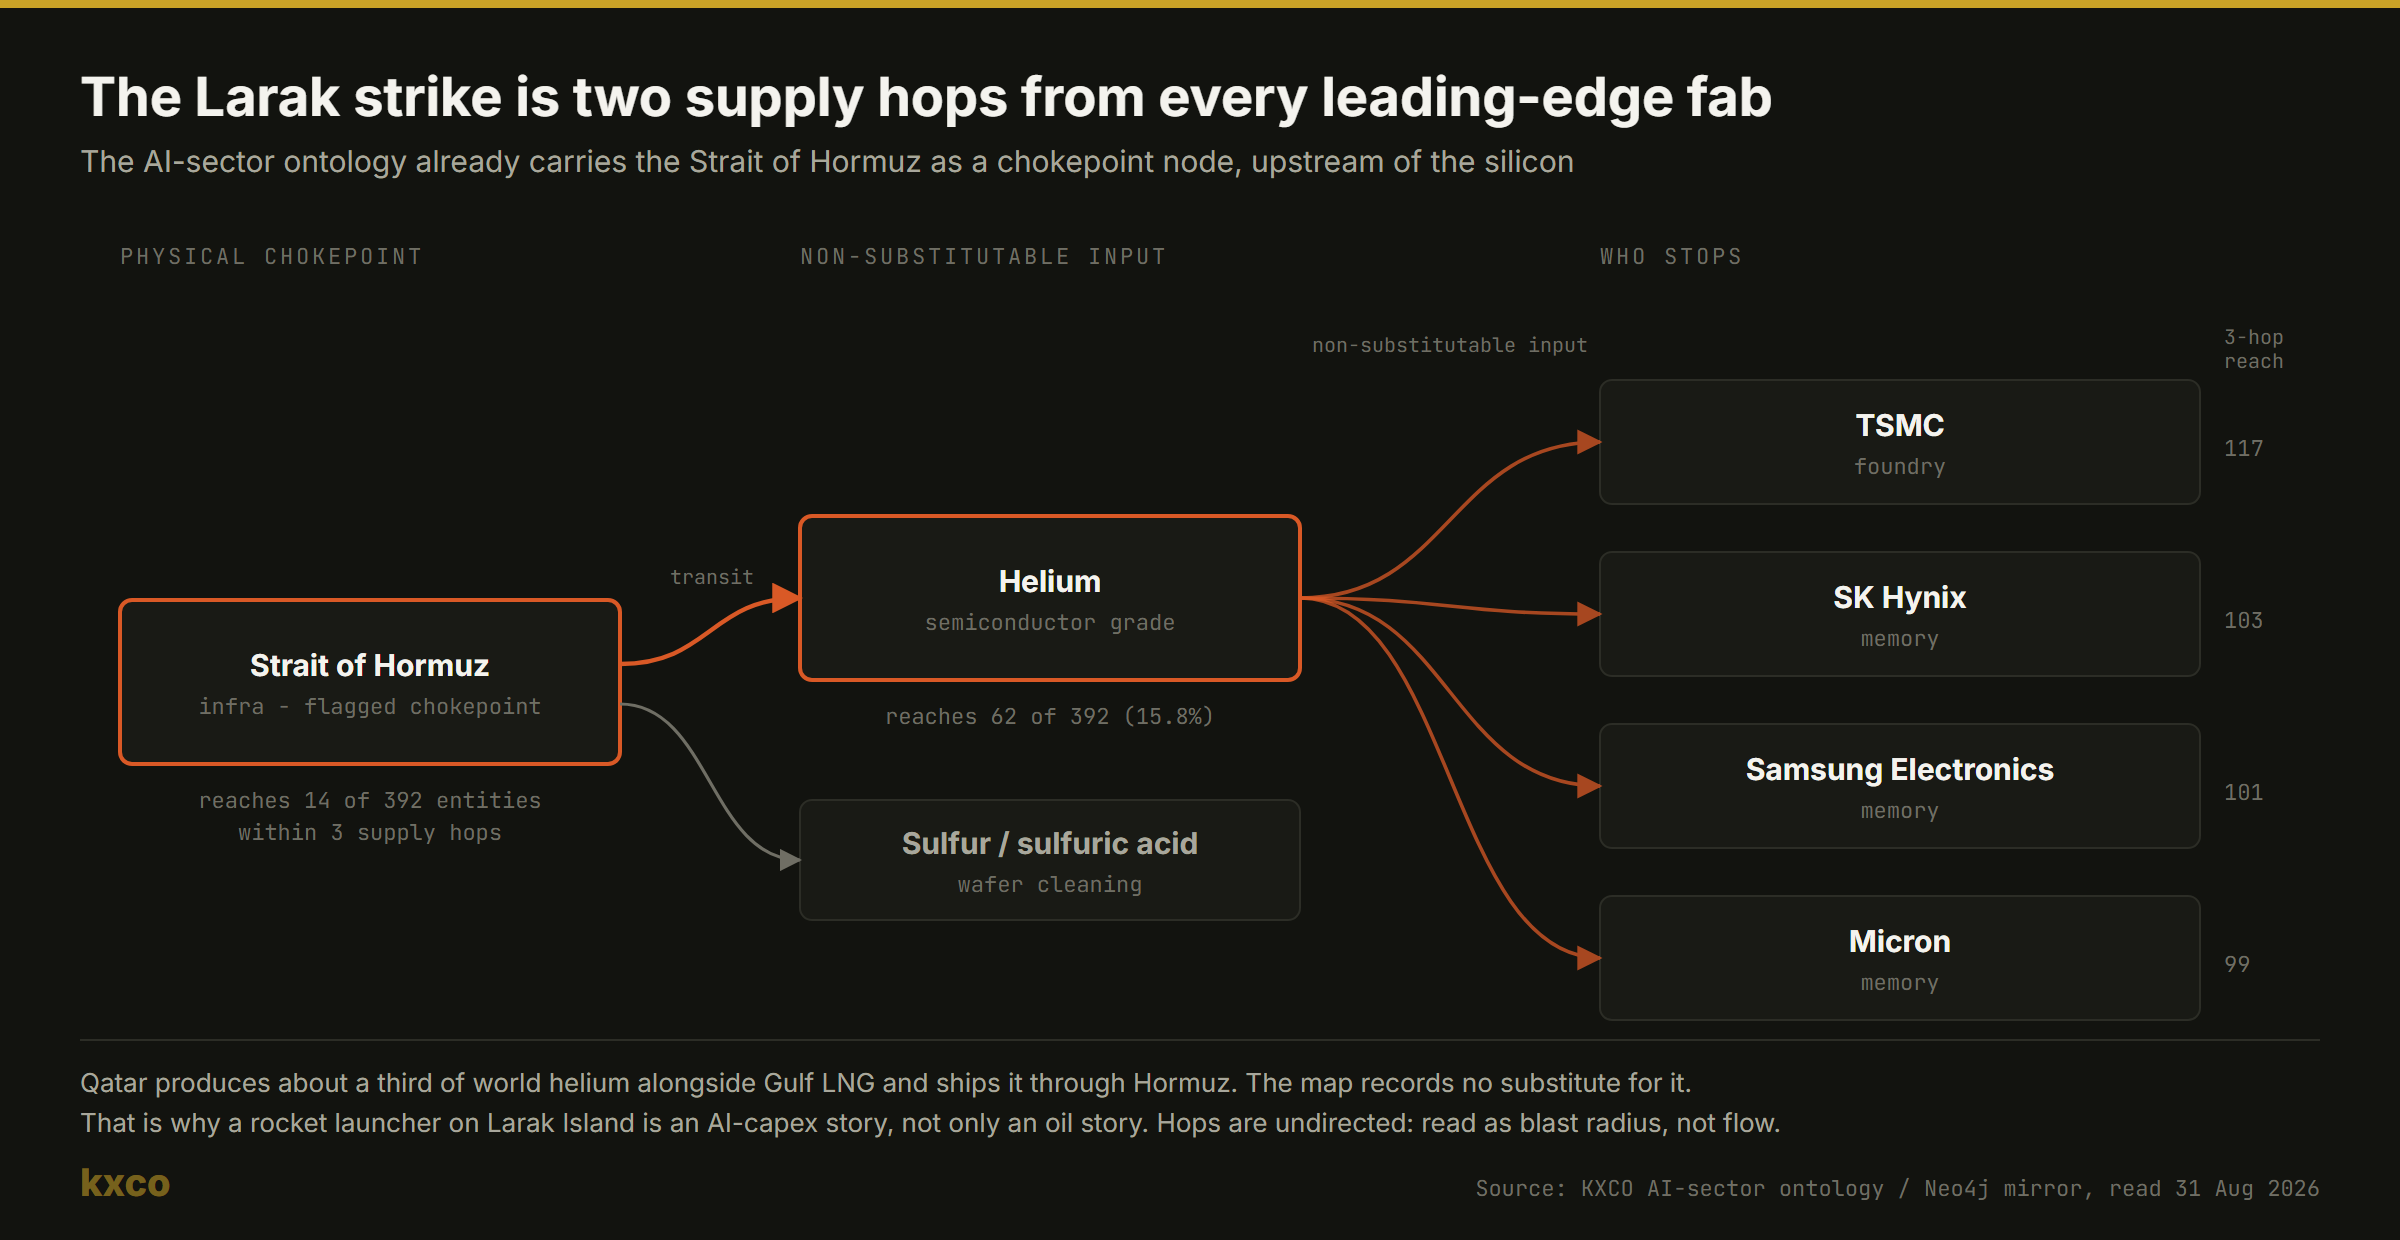
Figure 1. The AI-sector ontology already carries the Strait of Hormuz as a flagged chokepoint, one hop from semiconductor-grade helium and two from TSMC, SK Hynix, Samsung and Micron. Source: KXCO AI-sector ontology, Neo4j mirror, read 31 August 2026.
That figure is the part of the Larak story a commodity desk will price and an equity desk will miss. Qatar produces roughly a third of the world's helium as a by-product of LNG at Ras Laffan, and it ships through the same strait. The ontology records helium as a non-substitutable input for TSMC, SK Hynix, Samsung and Micron, with no alternate supplier edge anywhere in the map. Helium is a carrier gas, a cleanroom purge gas and a wafer coolant. On undirected three-hop supply adjacency the helium node reaches 62 of the map's 392 entities, 15.8 percent of the sector. Hormuz itself reaches 14. So a rocket launcher on a small island in the Gulf is not only an oil story. It is a semiconductor input story that runs into the memory triopoly and out into every accelerator built on top of it, and it will show up in a lead time long before it shows up in a price.
Secondary effects matter more than the first tick in crude. Gasoline futures printed a 52-week high near $3.36 earlier in August. A renewed Hormuz scare lifts RBOB, which lifts CPI gasoline, which lifts the odds that Warsh's September SEP dots move up rather than sideways. AI stocks are duration assets. They discount cash flows that arrive after 2028. A 20-basis-point backup in the 10-year on an oil shock is a larger event for Nvidia, Broadcom and the quantum complex than a 2 percent move in the S&P 500 energy sleeve. That is the cross-asset chain this week: Larak, then Hormuz freight, then WTI, then breakevens, then the 10-year, then Nasdaq duration, then AI and quantum multiples.
Trading implication, daily chart, energy complex. Do not fade the first spike if Sunday night futures gap more than 3 percent. That is forced covering, not a thesis. Fade only if price reclaims Friday's close and fails to hold above $85 WTI on the first New York session. Energy equities such as $XOM, $CVX and $COP are the cleanest listed expression of a multi-day premium. Downstream refiners benefit from cracks if crude outruns product, and they suffer if product catches up. The honest daily-chart stance is this: long crude strength above $85 with a stop under Friday's low, flat below $81 pending the weekly close.
3. Interest rates, Warsh, Jackson Hole and the September 16 decision
The Federal Reserve is no longer in an easing conversation. After five consecutive 2026 meetings that held the target at 3.50 to 3.75 percent, in January, March, April, June and on 29 July, the Committee is walking into a SEP meeting with three dissenters already on the record from July. Hammack, Kashkari and Logan preferred a 25-basis-point hike then. Chair Warsh's Jackson Hole message on 28 August was that price stability has not been delivered. Headline PCE at 3.7 percent is more than a full point above the 2 percent objective. Core PCE at 3.3 percent is not a rounding error. The labor market, which had been the Committee's justification for patience, cracked in July when nonfarm payrolls fell 23,000 against an +80,000 consensus. That print sent gold and silver ripping and briefly convinced parts of the Street that a cut was back on the table. Warsh closed that door.
The rate path now hinges on Friday's August Employment Situation. Consensus clustered this weekend around +45,000 to +58,000 payrolls and an unemployment rate of 4.2 percent versus 4.1 percent. Average hourly earnings are expected near +0.2 percent month-on-month and +3.3 percent year-on-year. A reprint of July's contraction would collide with Warsh's hike rhetoric and produce a violent two-way tape: weaker growth against still-too-high inflation. A 150,000-plus beat with firm wages would lock in the September hike and push the 10-year toward 4.85 to 5.00 percent. The in-between print, the one the market is actually positioned for, leaves September live and puts the burden on the 11 September CPI.
Daily-chart rates strategy. The 10-year note has been oscillating around 4.65 to 4.70 percent. A daily close above 4.75 percent after a hot NFP is a trend signal, not noise. It argues for shorter duration, a stronger dollar, and a lower multiple on unprofitable quantum names. A daily close back through 4.55 percent on a soft NFP plus a calm Gulf would reopen the debasement trade that lifted gold toward $4,696 earlier in August. Two-year yields near 4.20 percent already embed a modest hike. The curve is not inverted in the classic 2023 style. It is a high, slightly steep long end. That shape is unfriendly to speculative duration and friendly to cash-flow compounders that can fund capex internally.
Bank of Canada is expected to hold at 2.25 percent on Wednesday. The RBNZ is more than 90 percent priced to hike to 2.75 percent. Euro-area flash CPI on Tuesday is expected to re-accelerate on energy. This is not a synchronized global easing week. It is a week in which every G10 central bank is looking at the same oil headline and the same sticky services inflation and deciding how much insurance to buy.
4. This week's economic calendar, trade the clock and not the narrative
The operational calendar for desks this week lives at livetradingnews.com/trading. Use that page as the live board. The table below is the high-impact skeleton that should sit on every daily chart from Monday's New York open through Friday's NFP.
Session | High-impact items (ET unless noted) | How the daily chart should treat it |
|---|---|---|
Mon 31 Aug | Dallas Fed Manufacturing, 3- and 6-month bill auctions, MSCI index rebalance at the close | Low to medium. Range day unless Hormuz headlines dominate |
Tue 1 Sep | S&P Global Manufacturing PMI 09:45 ET, ISM Manufacturing 10:00, JOLTS openings 10:00, euro-area flash CPI, Fed Governor Barr speaks | ISM and JOLTS set the labor-and-activity tone ahead of ADP |
Wed 2 Sep | ADP private payrolls 08:15, Factory Orders 10:00, EIA crude inventories 10:30, Fed Beige Book 14:00, BoC rate decision, RBNZ decision, Broadcom earnings after the close | The AI-capex follow-through day after Nvidia's beat-and-selloff |
Thu 3 Sep | Initial claims 08:30, Productivity and Costs 08:30, ISM Services 10:00, Fed speakers Hammack and Goolsbee, Waller interview slot | Claims and ISM Services are the last labor tells before NFP |
Fri 4 Sep | Employment Situation 08:30 ET: payrolls, unemployment, average hourly earnings | The week's fulcrum and the last hard labor print before the 16 September FOMC |
Earnings that can move the AI complex this week. Broadcom, $AVGO, after Wednesday's close is the featured print, because custom XPUs and networking are the second engine of the AI buildout after Nvidia's GPUs. Palo Alto Networks, Dell, Hewlett Packard Enterprise, Ciena and Snowflake also report. Salesforce's recent jump on a marked-up Anthropic stake is a reminder that listed software names now carry private-AI beta. Position size into Broadcom should assume a 6 to 10 percent post-print range. That has been the AI-infrastructure pattern all summer.
Downstream calendar that already belongs on September daily charts: PPI on 10 September, CPI on 11 September, and the FOMC decision plus SEP on 16 September. Friday's NFP does not settle the year. It settles the two weeks between now and the SEP.
5. Gold, a daily-chart map after the Jackson Hole flush
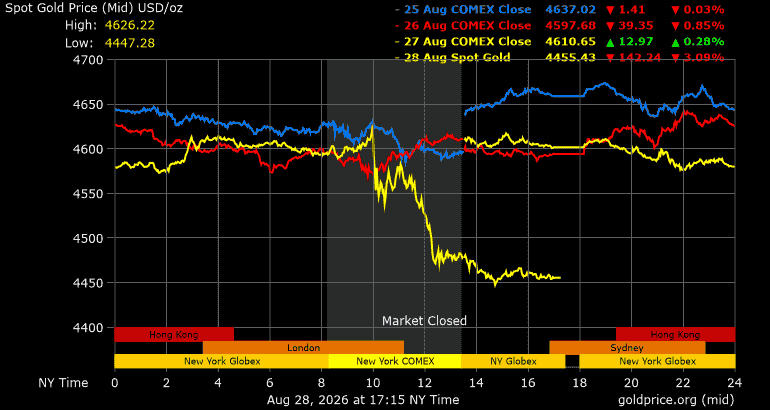
Spot gold through the 28 August session. The late-week drop from the mid-$4,600s toward the mid-$4,400s is the first real test of the August breakout.
Gold is no longer a $2,000 conversation. Spot traded as high as $4,696.18 earlier in the week of 24 August after the Treasury signalled support for the long end, then gave back the move when Warsh spoke and real yields firmed. Friday's cash prints clustered between a $4,455 spot quote and a $4,530 wholesale quote depending on the timestamp. December Comex had been near $4,643 before the flush. That is a $200 range inside five sessions. Daily-chart traders who treat gold as a sleepy macro hedge will get run over. Traders who treat it as a high-beta real-rate instrument with a geopolitical kicker will find the levels usable.
The bull case has not been cancelled. Central banks remain price-insensitive buyers. The U.S. fiscal picture, a rising term premium, ongoing Treasury issuance and periodic buyback experiments, keeps the debasement bid alive. Citi's Dirk Willer has sketched $5,000 to $6,000 over the next year on Treasury intervention, term-premium risk, a softer dollar and resumed de-dollarization. Deutsche Bank's year-end base case has sat in the $4,700 to $5,100 zone. Those targets only work if the 10-year does not march to 5.25 percent and stay there. Gold's enemy is not the Fed funds rate. It is the real 10-year.
Daily-chart strategy for gold. First support is $4,350 to $4,400, then the $4,222 short-covering trigger that desks flagged on the July payroll miss. A daily close back above $4,585 to $4,600 restores the August uptrend and opens $4,765 to $4,857, which is the last shelf before a round-number run at $5,000. Invalidation for a fresh long is a daily close under $4,222 with the 10-year above 4.80 percent. Position with the Hormuz calendar in mind. A weekend kinetic event is a long-gold impulse. A confirmed ceasefire headline is a fade. Do not carry oversized weekend risk in Comex without a defined stop, because Sunday's Larak strike is exactly the sort of gap that ruins an unhedged short.
Miners remain a leveraged expression, not a substitute. When gold drops 3 percent in a session, the large producers drop more, and the developers drop still more. Use $GDX and the higher-quality balance-sheet names, the cash-flow compounders rather than the story drills, if the goal is beta to a $5,000 thesis. Use bullion or $GLD if the goal is insurance against a Hormuz-plus-hike combination that hits both equities and credit.
6. Silver, a monetary metal, an industrial metal, and a tighter daily range

Physical silver remains the higher-beta twin of gold, with an industrial bid from electrification, solar and data-center buildout.
Silver spent August behaving like gold with a turbocharger. It had traded near $70.50 to $70.65 into late August, printed a confirmation gate around $70.69 on some desks, and then followed gold down through $67.80 toward $66.30 on the Warsh session. Earlier in the month a soft labor print had sent September silver futures up nearly 10 percent in a week to the low $60s from a lower base, a reminder that this metal still produces 1980s-style squeezes when backwardation appears. One August note flagged silver backwardation as wide as $2.88 an ounce, the largest since the 1980s. That is not a market that will sit still for a tidy $1 range.
The structural bid is real. Electrification, photovoltaics and the power-and-cooling stack around AI data centers are silver-intensive. That industrial floor is why silver can rally with gold on a real-rate shock and then keep going when gold consolidates. It is also why silver can fall harder when growth fears hit and industrial users destock. The gold-silver ratio is the daily tell. A ratio expanding while gold holds is a warning that the industrial bid is fading. A ratio compressing while gold rises is the classic catch-up trade.
Daily-chart strategy for silver. Support sits at $66.15 then $63.40, the post-payroll high from the prior impulse. Resistance is $70.70, then $72.26 and $74.98. A daily close back above $70.70 with gold above $4,585 is a long. A daily close under $66 with a rising dollar is a reduce. Because silver's realized volatility is higher than gold's, cut position size by a third relative to a gold sleeve of the same dollar risk. Miners in the silver complex, $PAAS, $HL and the silver-heavy royalty names, should be treated as options on the metal, not as income vehicles.
7. Oil, the Hormuz premium against demand, on a daily clock
Oil is the market that will decide whether Warsh can hike without breaking something. WTI near $83 to $84 and Brent near $88 to $89 are not crisis prices, but they are also not the $70s that equity bulls would prefer into a September SEP. Year-to-date crude is still heavily higher, with some compilations putting WTI up more than 40 percent on the year, because the war that started in February removed Iranian barrels and intermittently closed or slowed Hormuz. The late-August dip was a function of mine-clearing, talk of shipping arrangements, and a market that had grown numb to the conflict. Sunday's Larak strike ends the numbness.
Demand is not the bull's friend. U.S. activity data have been mixed, China remains a swing consumer rather than a consistent bid, and a hawkish Fed is a bid-killer for refined product demand with a lag. That is why the daily chart, not the yearly chart, is the right horizon this week. Inventories on Wednesday from the EIA will be read through a Hormuz lens. A build will be ignored if tankers are turning around in the Gulf. A draw will be amplified.
Daily-chart strategy for crude. Pivot zone: $82.40 WTI and $88.60 Brent. Strength that holds above $85 WTI and $90 Brent is a long with a trailing stop under the Tuesday low. Weakness that closes under $81 WTI after a quiet 24 hours in the Gulf is a fade of the premium. Crack spreads are the second book. If crude rips and RBOB does not, refiners win. If both rip, inflation desks win and Nasdaq duration loses. Overnight gaps are the occupational hazard. Size energy risk as if a second strike-and-retaliation sequence can print a $6 handle in a session, because that is what this war has already done more than once since February.
8. Bitcoin, the anti-fiat twin that will not always rhyme with gold
Bitcoin spent August proving it can rally when gold rallies and then refuse to fall as far when gold falls. Weekend wholesale quotes put BTC near $79,300 after a Friday cash print closer to $77,400. Earlier in the week the market had tagged $80,000. August futures at one point jumped more than 20 percent in a week toward the high $77,000s, clearing the 20-day, 50-day and 100-day moving averages in a single impulse. That is trend behavior. It is not yet new all-time-high behavior. The October 2025 high near $125,000 remains the north star that every multi-year holder still watches.
Two catalysts sit under the crypto tape. The first is legislative. Senate Majority Leader Thune has filed cloture on the motion to proceed to the CLARITY Act, with a procedural vote marked for 15 September. That is not passage. It is the next gate. The second is the same debasement trade that lifted gold: Treasury buybacks, a questioned dollar, and a market that wants a bearer asset that is not a central-bank liability. When those two rhymed, BTC and gold rose together. When they diverged, in the episode some desks labelled the "Great Decoupling," gold ripped on a weak payrolls print while Bitcoin stalled under nearby resistance. That divergence is information. Bitcoin is still a liquidity-and-policy animal more than a pure safe haven.
Daily-chart strategy for Bitcoin. Support: $72,700, the recent impulse low, then the 20-day area that had been near $65,500 during the mid-August launch. Resistance: $82,000, then $90,000. A daily close back under $72,700 with the dollar rising and the 10-year above 4.80 percent is a reduce. A daily close above $82,000 with gold reconquering $4,600 is a trend-continuation long. Do not treat weekend thin liquidity as a signal. Treat Sunday night's Hormuz gap as a test of whether BTC still bids when oil spikes. Historically it sometimes does, on liquidity and risk-on, and sometimes does not, on risk-off and margin. Watch basis and funding, not Twitter.
9. AI stocks, still early in the cycle even after the first valuation reset
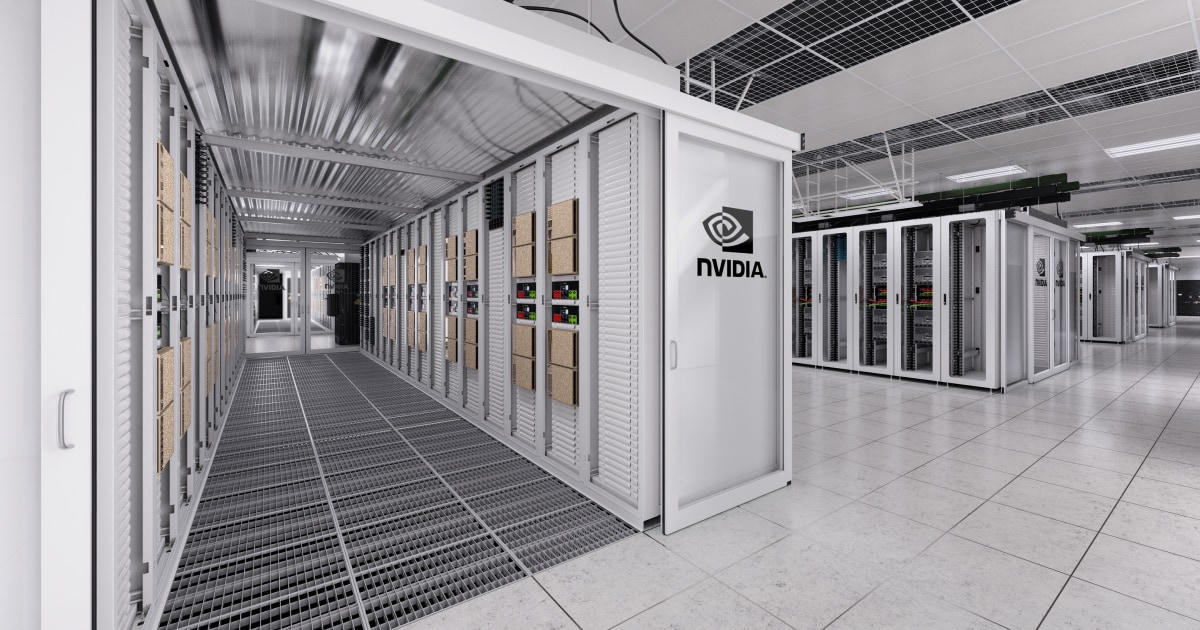
Nvidia-class AI factory infrastructure. The capex cycle is measured in hundreds of billions per year and is still building, not harvesting.
The most important sentence in this briefing is also the least fashionable. Artificial intelligence is still early in its investment cycle. That claim sounds reckless after a multi-year rerating, after Nvidia became the world's most valuable listed company, after hyperscaler capex crossed $600 billion for the four largest spenders, and after a summer in which AI-linked credit spreads widened on fears of an "AI credit bubble." It is still the correct cycle call. Capital-spending bubbles almost always burst later than the first wave of sceptics expect. History's rule of thumb is that the danger zone arrives when the buildout approaches a quarter of GDP. U.S. GDP is near $30 trillion, so a quarter is $7.5 trillion. Hyperscaler plans through 2029 are enormous. One widely cited compilation puts global hyperscaler spend near $3.7 trillion through 2029, with another estimate of more than $5 trillion of data-center spend from 2026 to 2030 across cash flow, new equity, credit and alternative structures. They are not yet $7.5 trillion of domestic spend. The cycle can be mid-innings on Nvidia's revenue and still early on the installed base of inference, agentic software and physical-world AI.
What has changed is the multiple, not the orders. A broad AI basket that commanded 28.5 times forward earnings in October 2025 was nearer 20 times by late August, roughly in line with its post-2015 average and no longer carrying a 30 percent premium to the S&P 500. Nvidia itself has traded at forward multiples that look ordinary next to 1999 network-equipment leaders. The company reported a beat-and-raise quarter last week and still sold off, including a 4.6 percent drop on Friday, which is exactly how late-cycle psychology looks even when the fundamental cycle is early. Guidance pointing to roughly 70 percent revenue growth into fiscal 2028 is not a company that has finished its work. It is a company whose stock now requires the work to keep showing up every ninety days.
The KXCO ontology is the right way to hold this thought without slipping into slogans. The public live map at kxco.ai/ontology-live carried, at the 31 August snapshot, 379 entities and 851 sourced claims about the AI sector, covering chipmakers, foundries, labs, clouds, investors, data centres, governments and people, plus 30 ranked findings and consensus valuation fields on 17 listed majors. The figures in this section come from the Neo4j mirror the map is generated from, which currently holds 392 entities and 866 claims, so the published page trails the working graph by a few days. The map was not built by listing famous tickers. It was grown by following dependencies outward, which is why the interesting answers are not the ones a ticker screen returns.
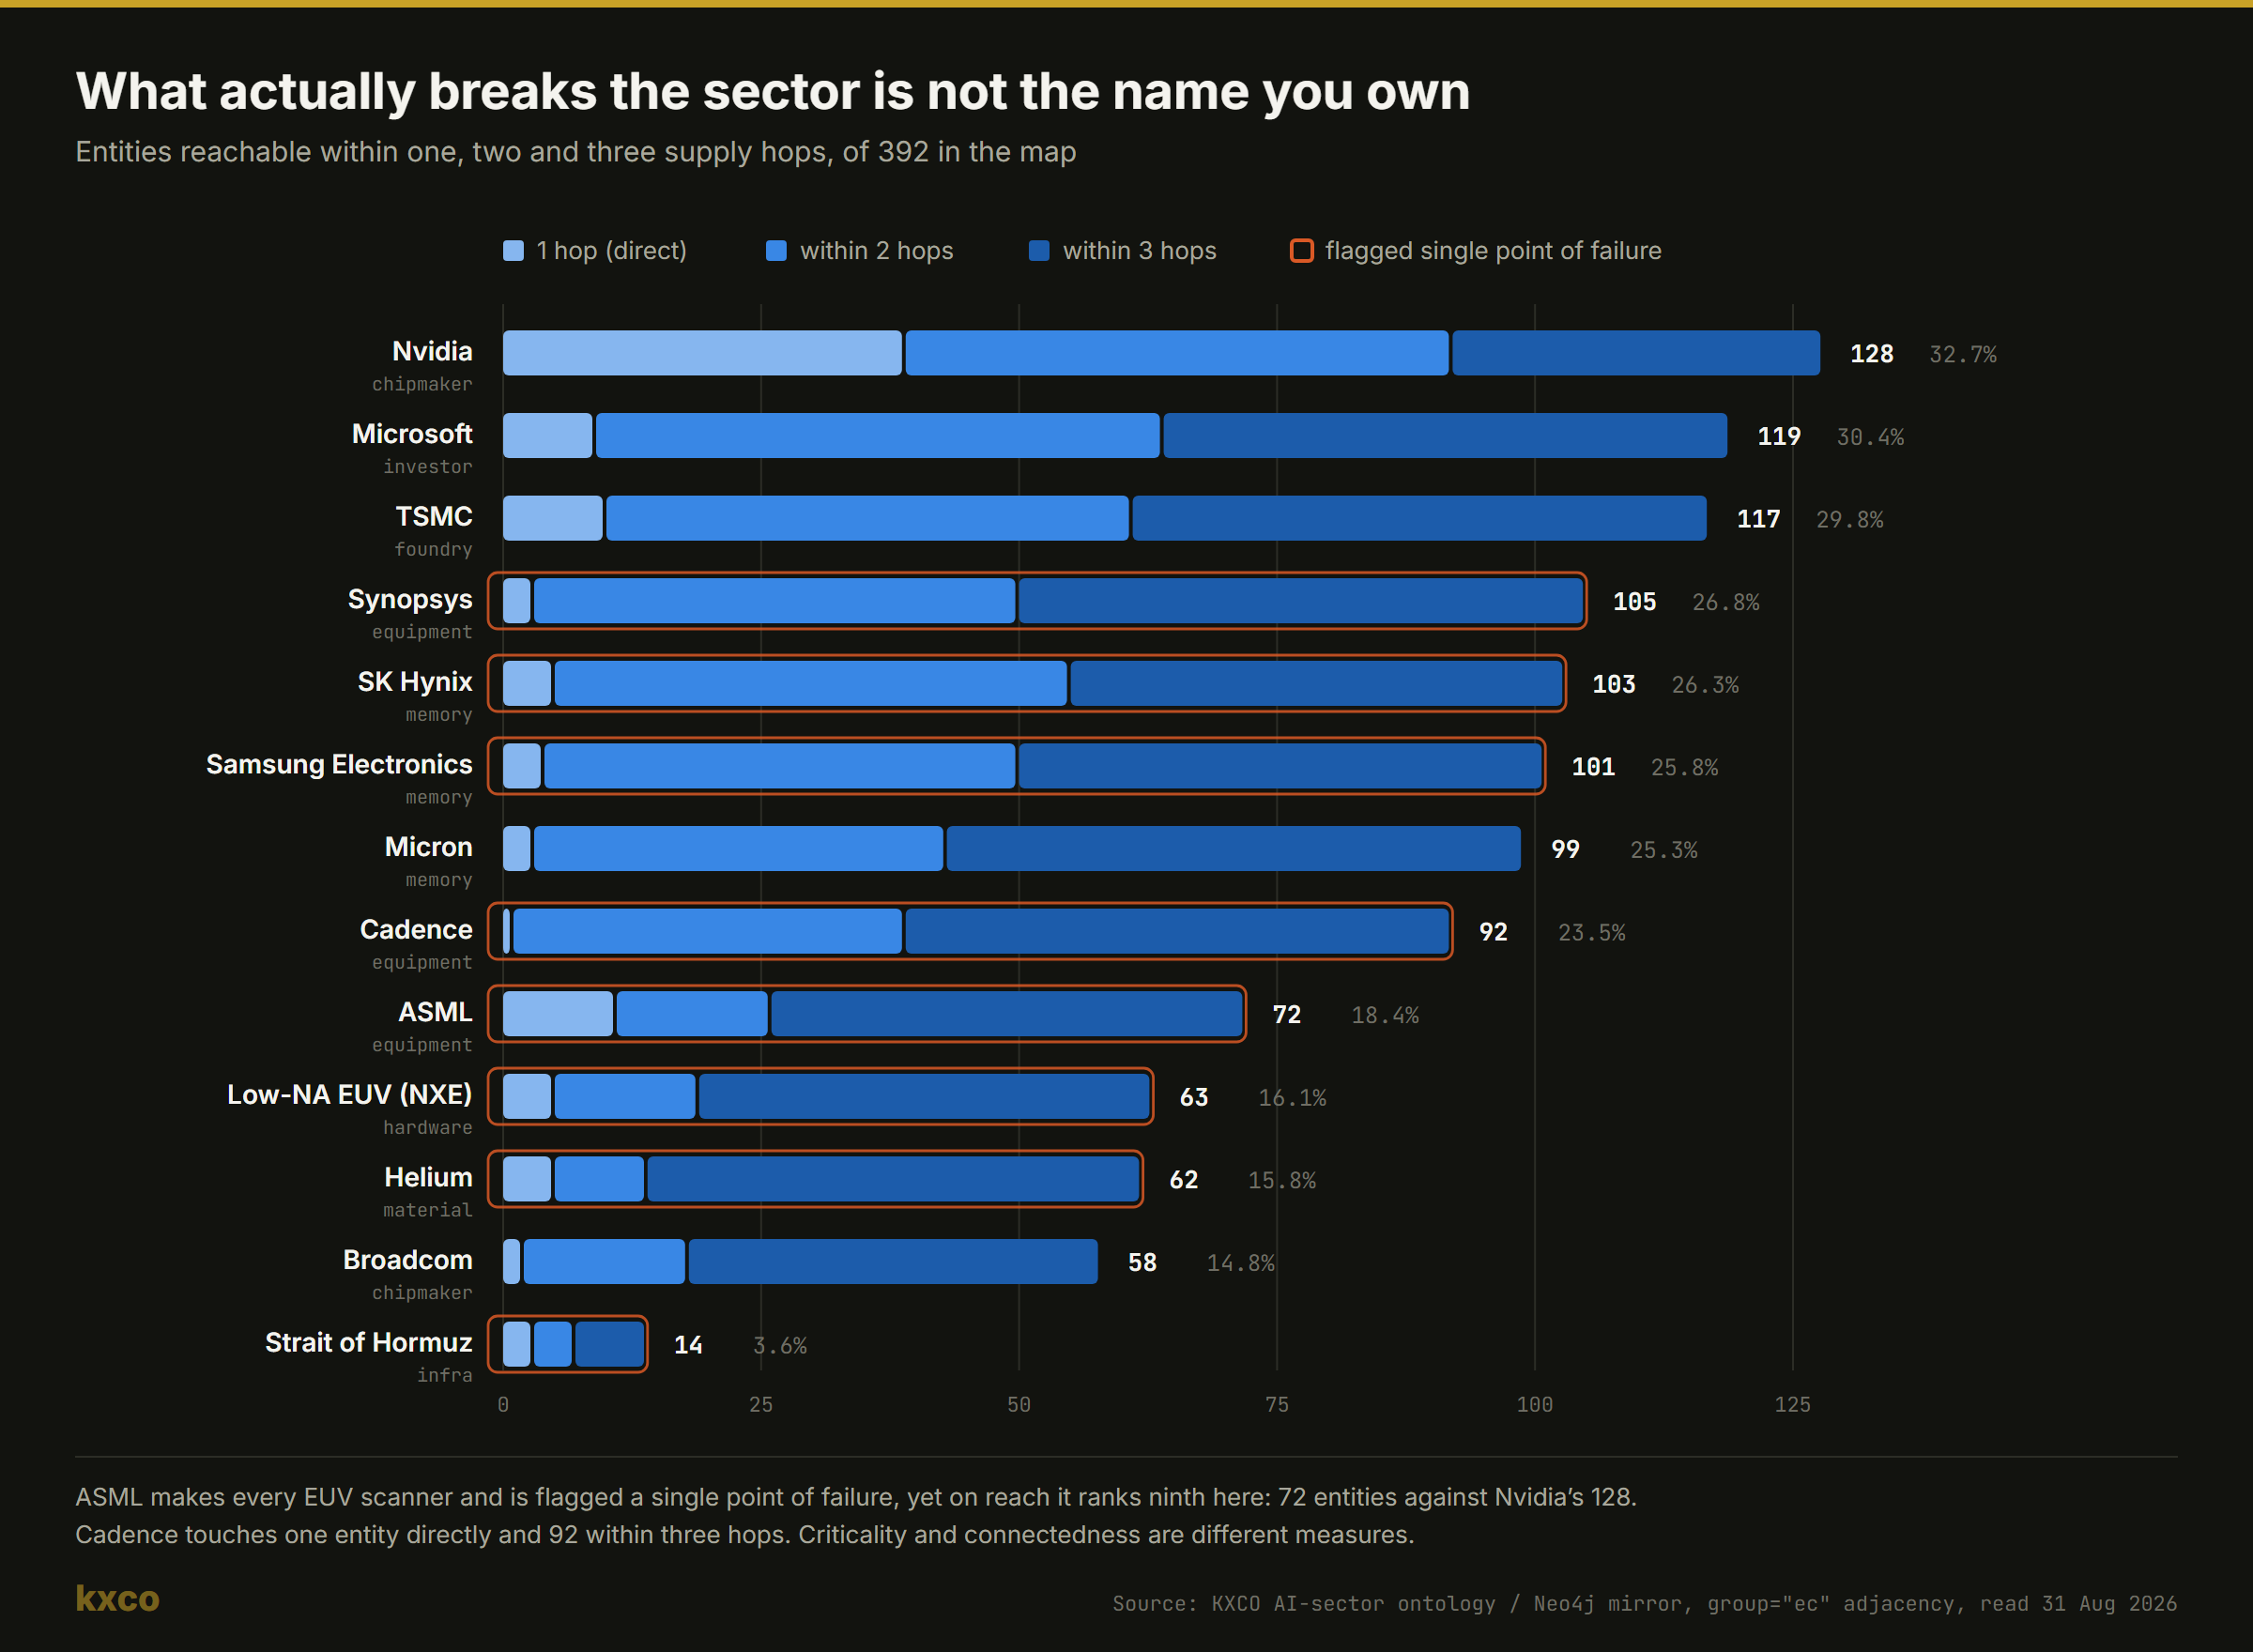
Figure 2. Blast radius on undirected supply adjacency. Direction in this map is carried in the claim text rather than the edge, so hops are counted undirected and read as exposure, not as flow. Source: KXCO AI-sector ontology, Neo4j mirror, read 31 August 2026.
That figure is worth sitting with, because it corrects a comfortable story. The received wisdom, one this publication has repeated, is that ASML is the quiet centre of the AI trade because it is the only maker of EUV lithography. The map does flag ASML as a single point of failure. But on reach it ranks ninth of the thirteen nodes tested: 72 entities within three supply hops against Nvidia's 128, Microsoft's 119 and TSMC's 117. Cadence is the sharper version of the same lesson. It touches exactly one entity directly and 92 within three hops, and no accelerator on earth is taped out without it or Synopsys. Criticality and connectedness are different measures, and a risk desk that conflates them will hedge the wrong name. The memory triopoly is the other tell: SK Hynix at 103, Samsung at 101 and Micron at 99 sit in a tight band that no single-name hedge covers.
Read the map the way a risk desk should. Open kxco.ai/ontology-live, pick $NVDA, $AVGO, $TSM, $ASML, $MU and $MSFT, and display shared dependencies. If the finding set says the sector narrows to a handful of firms, believe the finding and size the book as a concentrated factor, not as twelve uncorrelated ideas. The working guide at kxco.ai/developers/blog/ontology-live-guide explains the claim schema. Every edge carries a predicate, a group covering supply, capital, control, rivalry, talent and data, a magnitude where known, a disclosure type, a confidence, a source URL and a validity window. That is the opposite of a theme ETF factsheet. It is a decision object. The broader KXCO argument, rent the intelligence and own the knowledge, is that models are a commodity reasoning engine and the ontology is the layer an institution actually owns. For a trading desk the practical translation is simpler: do not let a chatbot's fluency replace a sourced graph of who supplies whom.
Daily-chart strategy for the AI complex. Nvidia remains the benchmark. After a beat-and-selloff, the daily question is whether last week's low holds on the first down-open that follows a hawkish NFP. A hold and reclaim of the post-earnings high is a long. A clean break of the weekly low with the 10-year above 4.80 percent is a reduce into Broadcom's print, not a hero bottom-tick. Broadcom on Wednesday is the confirmation or the contradiction of the custom-silicon plus networking leg. Microsoft, Amazon and Alphabet are the capex-and-cloud expression, and they live and die by the next capex guide and by whether Azure, AWS and GCP growth re-accelerates. Meta is the high-beta spender. TSMC and ASML are the ontology's physical chokepoints and should be owned as infrastructure, not traded as memes. Micron and the HBM complex are the memory bottleneck, and they carry cyclical risk that GPU names do not.
Positioning rule for an early-cycle theme carrying late-cycle multiples in places. Own the picks-and-shovels with cash flow, $NVDA, $AVGO, $TSM, $ASML and the power-and-cooling names such as $VRT and $GEV, at full research weight. Own the model-layer and software-layer names at half weight until net-new incremental revenue is visible in the income statement rather than in the keynote. That is how an early cycle is traded after the first valuation reset. The reset is not the end of the cycle. It is the cycle growing up.
10. Quantum stocks, earlier than AI and louder than the revenue
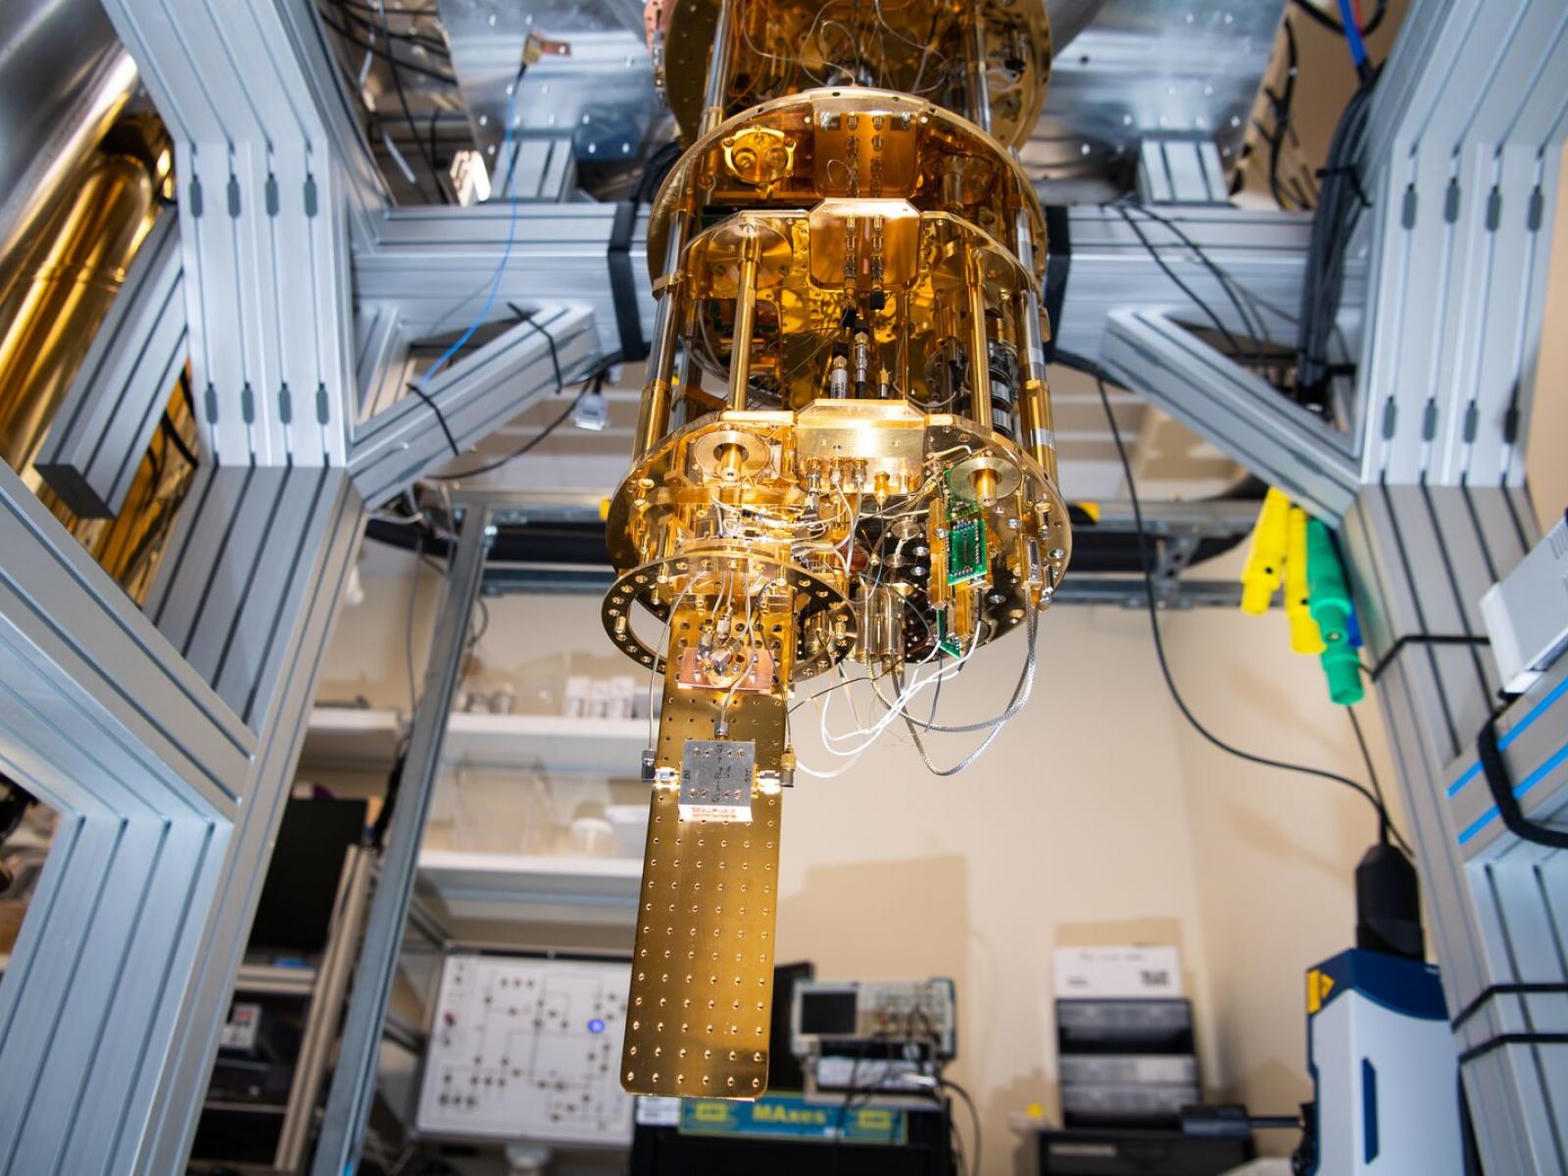
A dilution-refrigerator stack in a working laboratory. Most listed quantum companies are still selling systems, time and hope rather than mature cash-flow streams.
If AI is early, quantum is earlier. That is not a slight. It is a portfolio-construction fact. IonQ just printed $80.1 million of second-quarter revenue, up 287 percent year on year, with organic growth of 132 percent, and raised standalone 2026 revenue guidance to $280 to $290 million with remaining performance obligations of $485 million. Those are real numbers. They are also a rounding error next to Nvidia's data-center quarter. Rigetti, D-Wave and Quantum Computing Inc. are smaller still. D-Wave's annealing systems have the cleanest near-term commercial story, and AT&T work that cut network-issue resolution from an hour to under 15 seconds is the sort of anecdote that turns a lab into a vendor, but the income statement has not yet caught the story. Rosenblatt has published targets that imply 144 to 211 percent upside across the group, including $100 on IonQ, $43 on D-Wave and $40 on Rigetti, against late-August prices that had $IONQ near $39, $QBTS near $17 and $RGTI near $15.50. Targets of that shape are a statement about option value, not about next-twelve-months earnings.
The cycle position is what matters. Commercially useful, error-corrected, general-purpose quantum computing is still, in the words of more than one serious desk, on the investable time horizon rather than in the run-rate. Amazon's quantum lead has talked in a five-to-seven-year window for commercially useful machines. That is an early-cycle clock, and early-cycle clocks produce violent listed vehicles. These stocks can rally 10 percent on an IBM fidelity print or an AT&T contract and give it back the next week on a secondary offering. The Trump administration's disclosed $2 billion of quantum investment with equity stakes is a policy bid, not a revenue bid. Treat policy as a floor under attention, not as a floor under price.
Quantum also sits inside the KXCO stack in a different way than AI does. KXCO's own architecture is post-quantum by design: NIST FIPS 203, 204 and 205, which are ML-KEM, ML-DSA and SLH-DSA, with identities and settlement on ML-DSA-65, Sentinel as a quantum-resistant cloud and Armature L1 as a post-quantum settlement network. The company's public writing argues that harvest-now-decrypt-later is already a live threat to any ledger or archive that must still verify decades from now. That is the institutional reason quantum is not a sideshow. Even if gate-based advantage arrives late, the cryptographic migration arrives early. Listed quantum computing names are a speculative expression of the first fact. Post-quantum cryptography vendors, identity layers and settlement networks are a defensive expression of the second. A grown-up book owns a little of both and does not confuse them.
Daily-chart strategy for quantum. These names are high-beta Nasdaq duration. They will trade the 10-year first and their own press releases second. Hard rule: no full-size long into Friday's NFP. Soft rule: buy strength only after a daily close back above the 20-day with the 10-year below 4.70 percent. Cut any position that loses 12 percent from the entry on a rising-yield day, because the sector's average true range can consume a month of thesis in two sessions. Preferred hierarchy if forced to pick: IonQ for revenue leadership and the SkyWater foundry push, D-Wave for near-term commercial annealing, Rigetti for superconducting chip optionality, and QUBT only as a satellite. Cap the entire pure-play sleeve at a mid-single-digit percent of a speculative book. The early cycle is real. So is dilution.
11. The space economy is on the rise, and it is merging with AI
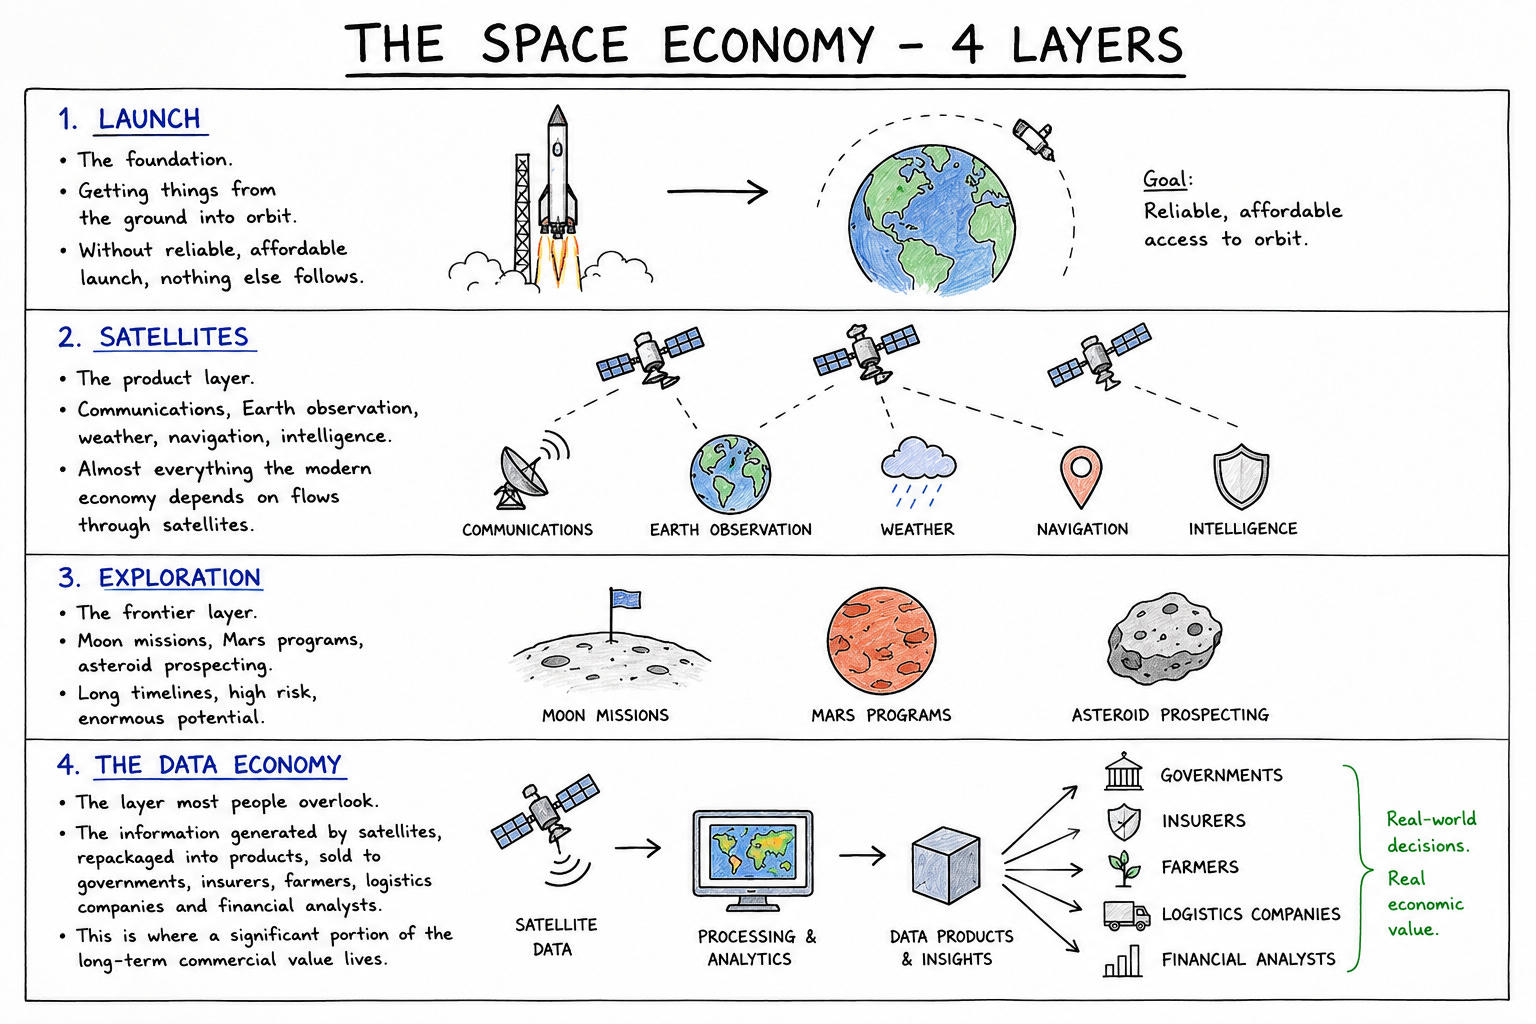
Four layers of the space economy: launch, satellites, exploration and the data economy. The investable money is increasingly in layers two and four, with launch as the cost curve that makes them possible.
Space is no longer a narrative looking for a ticker. SpaceX's June 2026 IPO, $SPCX priced at $135 for a valuation near $1.77 trillion and roughly $75 billion of proceeds, was the largest listing in history and the moment the sector stopped pretending it was private forever. The stock had a messy adolescence, sliding toward $107 in late July before reclaiming the IPO price in August. Q2 results as a public company showed $7.8 billion of revenue, up 92 percent year on year, a narrower net loss of $541 million, Starlink subscribers at about 12 million, connectivity revenue near $4.3 billion, and more than $6 billion of multi-year U.S. government awards tied largely to Starshield. Management has gone further. Elon Musk has told employees that SpaceX's AI compute business would exceed all other revenue and, in a five-year framing, account for most of the company's value, with a target of 10 gigawatts of AI compute capacity by the end of 2027 against 1.4 GW at the end of Q2. Disclosed multi-year AI cloud contracts with Anthropic, Google and others already run at tens of billions of dollars. Starmind, the planned constellation of orbital AI data centres, is the logical extreme of that thesis, and a reminder that the space economy and the AI economy are becoming the same economy at the power-and-latency frontier.
The rest of the listed complex is finally producing numbers rather than renderings. Rocket Lab, $RKLB, has been trading as a mid-sixties dollar stock with a market cap in the low $40 billions on some August prints, with Neutron targeted for a first launch window in Q4 2026 and a launch manifest that has thickened all year. Firefly has printed a first $100 million-plus quarter and guided 2026 revenue to $420 to $450 million with a $1.5 billion backlog. AST SpaceMobile, $ASTS, Intuitive Machines, Redwire and the prime contractors, $NOC, Lockheed, RTX and L3Harris, give a ladder from speculative to cash-flow. The U.S. Space Force budget conversation for 2027 has included a proposed step-up toward $71 billion in some administration outlines, against a $40 billion run-rate. A nearly $1 billion NITE-STAR test-and-training award in late July was split across more than a dozen names. Morgan Stanley's space team has been telling clients to think in seven value-chain buckets rather than one ticker: raw materials, components, launch, satellites, data, defense, and emerging infrastructure.
WisdomTree and others now put the global space economy in the $600 billion neighbourhood with a path toward $1 trillion early next decade. Those figures will be revised. What will not be revised is the cost-curve fact: reusable launch has turned orbit from a mission into a logistics problem. Once launch is logistics, satellites become a product line, and satellite data becomes a cash-flow business sold to governments, insurers, farmers and desks. That is why the space economy belongs in a weekly outlook that is supposedly about gold and Nvidia. Power-hungry AI wants cheaper energy and cooler climates, and orbit is a speculative answer to both. Defense establishments want resilient comms after a six-month war that featured missiles against Gulf bases. Those two bids do not need a new bull market in risk appetite. They need execution.
Daily-chart strategy for space. SPCX is a mega-cap growth stock with event risk around every Musk comment and every Starship window. Trade it as Nasdaq duration plus execution, not as a meme. RKLB is the liquid pure-play on the launch-cost curve, so respect the pre-Neutron gap risk. ASTS is a binary-ish commercial satellite story and should be sized like one. The primes are how a conservative book buys the Space Force bid without taking single-mission risk. A simple weekly rule: add on daily closes above the 20-day only when the 10-year is not making new local highs. Space is long duration. It will not levitate through a 5 percent 10-year.
12. Integrated daily-chart trading strategy for the week
The strategy is a calendar overlaid on a regime, not a list of hero trades. The regime is a hawkish Fed chair, sticky PCE, a live Hormuz war, AI capex still expanding, quantum still pre-profit, and space now public and merging with compute. The calendar is Tuesday ISM and JOLTS, Wednesday ADP and Broadcom, Thursday claims and ISM Services, Friday NFP. Everything else is noise unless Larak has a sequel.
12.1 Core book, 60 to 70 percent of risk
Hold a core of cash-flow AI infrastructure: Nvidia on weakness toward last week's low, Broadcom only after the print or in a defined options structure, TSMC and ASML as ontology chokepoints, and a power-and-cooling name. Hold a measured gold sleeve as insurance against a Hormuz-plus-fiscal combination, financed in part by underweighting long-duration Treasuries. Hold a small crude sleeve only above $85 WTI. This core is not a momentum book. It is the set of exposures that still make sense if Friday's NFP is +80,000 and Warsh hikes on 16 September.
12.2 Tactical book, 20 to 30 percent of risk
Use daily closes, not intraday spikes. Long silver only on a close back above $70.70 with gold above $4,585. Long Bitcoin only on a close above $82,000 with funding not stretched. Long energy equities on a confirmed Hormuz premium, meaning WTI holding $85. Short or reduce unprofitable quantum on a 10-year close above 4.75 percent. The tactical book sleeps through Monday unless futures gap more than 2 percent on Larak follow-through.
12.3 Satellite book, 5 to 10 percent of risk
This is the early-cycle sleeve: a basket of $IONQ, $QBTS and $RGTI at half the size instinct requests, $RKLB or a space ETF, and one listed AI-software name tied to agentic deployment rather than to a training-capex press release. Hard stop: if the satellite book is down 15 percent peak-to-trough on a rates shock, it goes to cash until the 16 September FOMC, no debate. Early cycles punish people who confuse destiny with a daily chart.
12.4 Event protocol
Into NFP: cut gross exposure by a third on Thursday close. No new quantum. No new high-beta space. Gold and crude may be held as hedges if Hormuz is hot. After NFP: if payrolls are soft and wages are soft, buy the gold and duration dip only after the first 30-minute range breaks up. If payrolls are hot and wages are hot, do not buy the first Nasdaq flush, and wait for the afternoon reopen of the daily range. Into Broadcom: defined-risk only. Into Sunday and Monday Hormuz headlines: never short gold or crude into an unverified kinetic report.
Book | Base plan | Daily-chart add | Daily-chart abort |
|---|---|---|---|
Gold | Long zone $4,350 to $4,400 | Add above $4,585 | Stop on daily close under $4,222 |
Silver | Reduce under $66.15 | Long trigger above $70.70 | Stop under $63.40 |
WTI | Flat $81 to $85 | Long above $85 hold | Exit under $81 after a quiet Gulf session |
Bitcoin | Hold core above $72,700 | Add above $82,000 | Reduce under $72,700 with DXY up |
NVDA / AI infra | Buy weakness if the weekly low holds | Confirm on AVGO reaction | Cut if 10Y above 4.80% and the weekly low breaks |
Quantum basket | No full size pre-NFP | Buy strength above the 20-day only | 12% hard stop from entry |
Space (RKLB / primes) | Primes as core defense | RKLB above the 20-day if yields ease | No add if 10Y is making local highs |
10-year yield | Range 4.55 to 4.75 | Break above 4.75 is risk-off duration | Break under 4.55 is the debasement bid |
13. How to use the KXCO ontology this week, a desk checklist
KXCO describes itself as reality infrastructure for the human-AI economy: an ontology plus a kinetic layer plus post-quantum cryptography, with settlement on Armature L1. The public demonstration of the ontology applied to the AI sector is free, and it is the piece a market briefing can actually use. The company is not a listed AI stock and this section is not a recommendation of KXCO securities. It is a recommendation of a method.
Checklist for Monday morning. One: open kxco.ai/ontology-live and keep it next to the Live Trading News calendar at livetradingnews.com/trading. Two: load NVDA, AVGO, TSM, ASML, MU, MSFT, AMZN, GOOGL, META and SPCX if the map carries it, and inspect shared upstream nodes. When you do that with the first six, the map returns only three nodes shared by three or more of them: Low-NA EUV, SK Hynix and OpenAI. Six positions, three real dependencies. Three: read the Findings view before the Network view, because findings are ranked conclusions, not decorations. Four: click through any claim that will size a position until the source URL and the validity window are visible. A claim without a date is a rumor. Five: note circular capital flows. If the same dollar is being counted as capex at a cloud, revenue at a chip vendor and a round at a model lab, the factor is tighter than the ticker list implies.
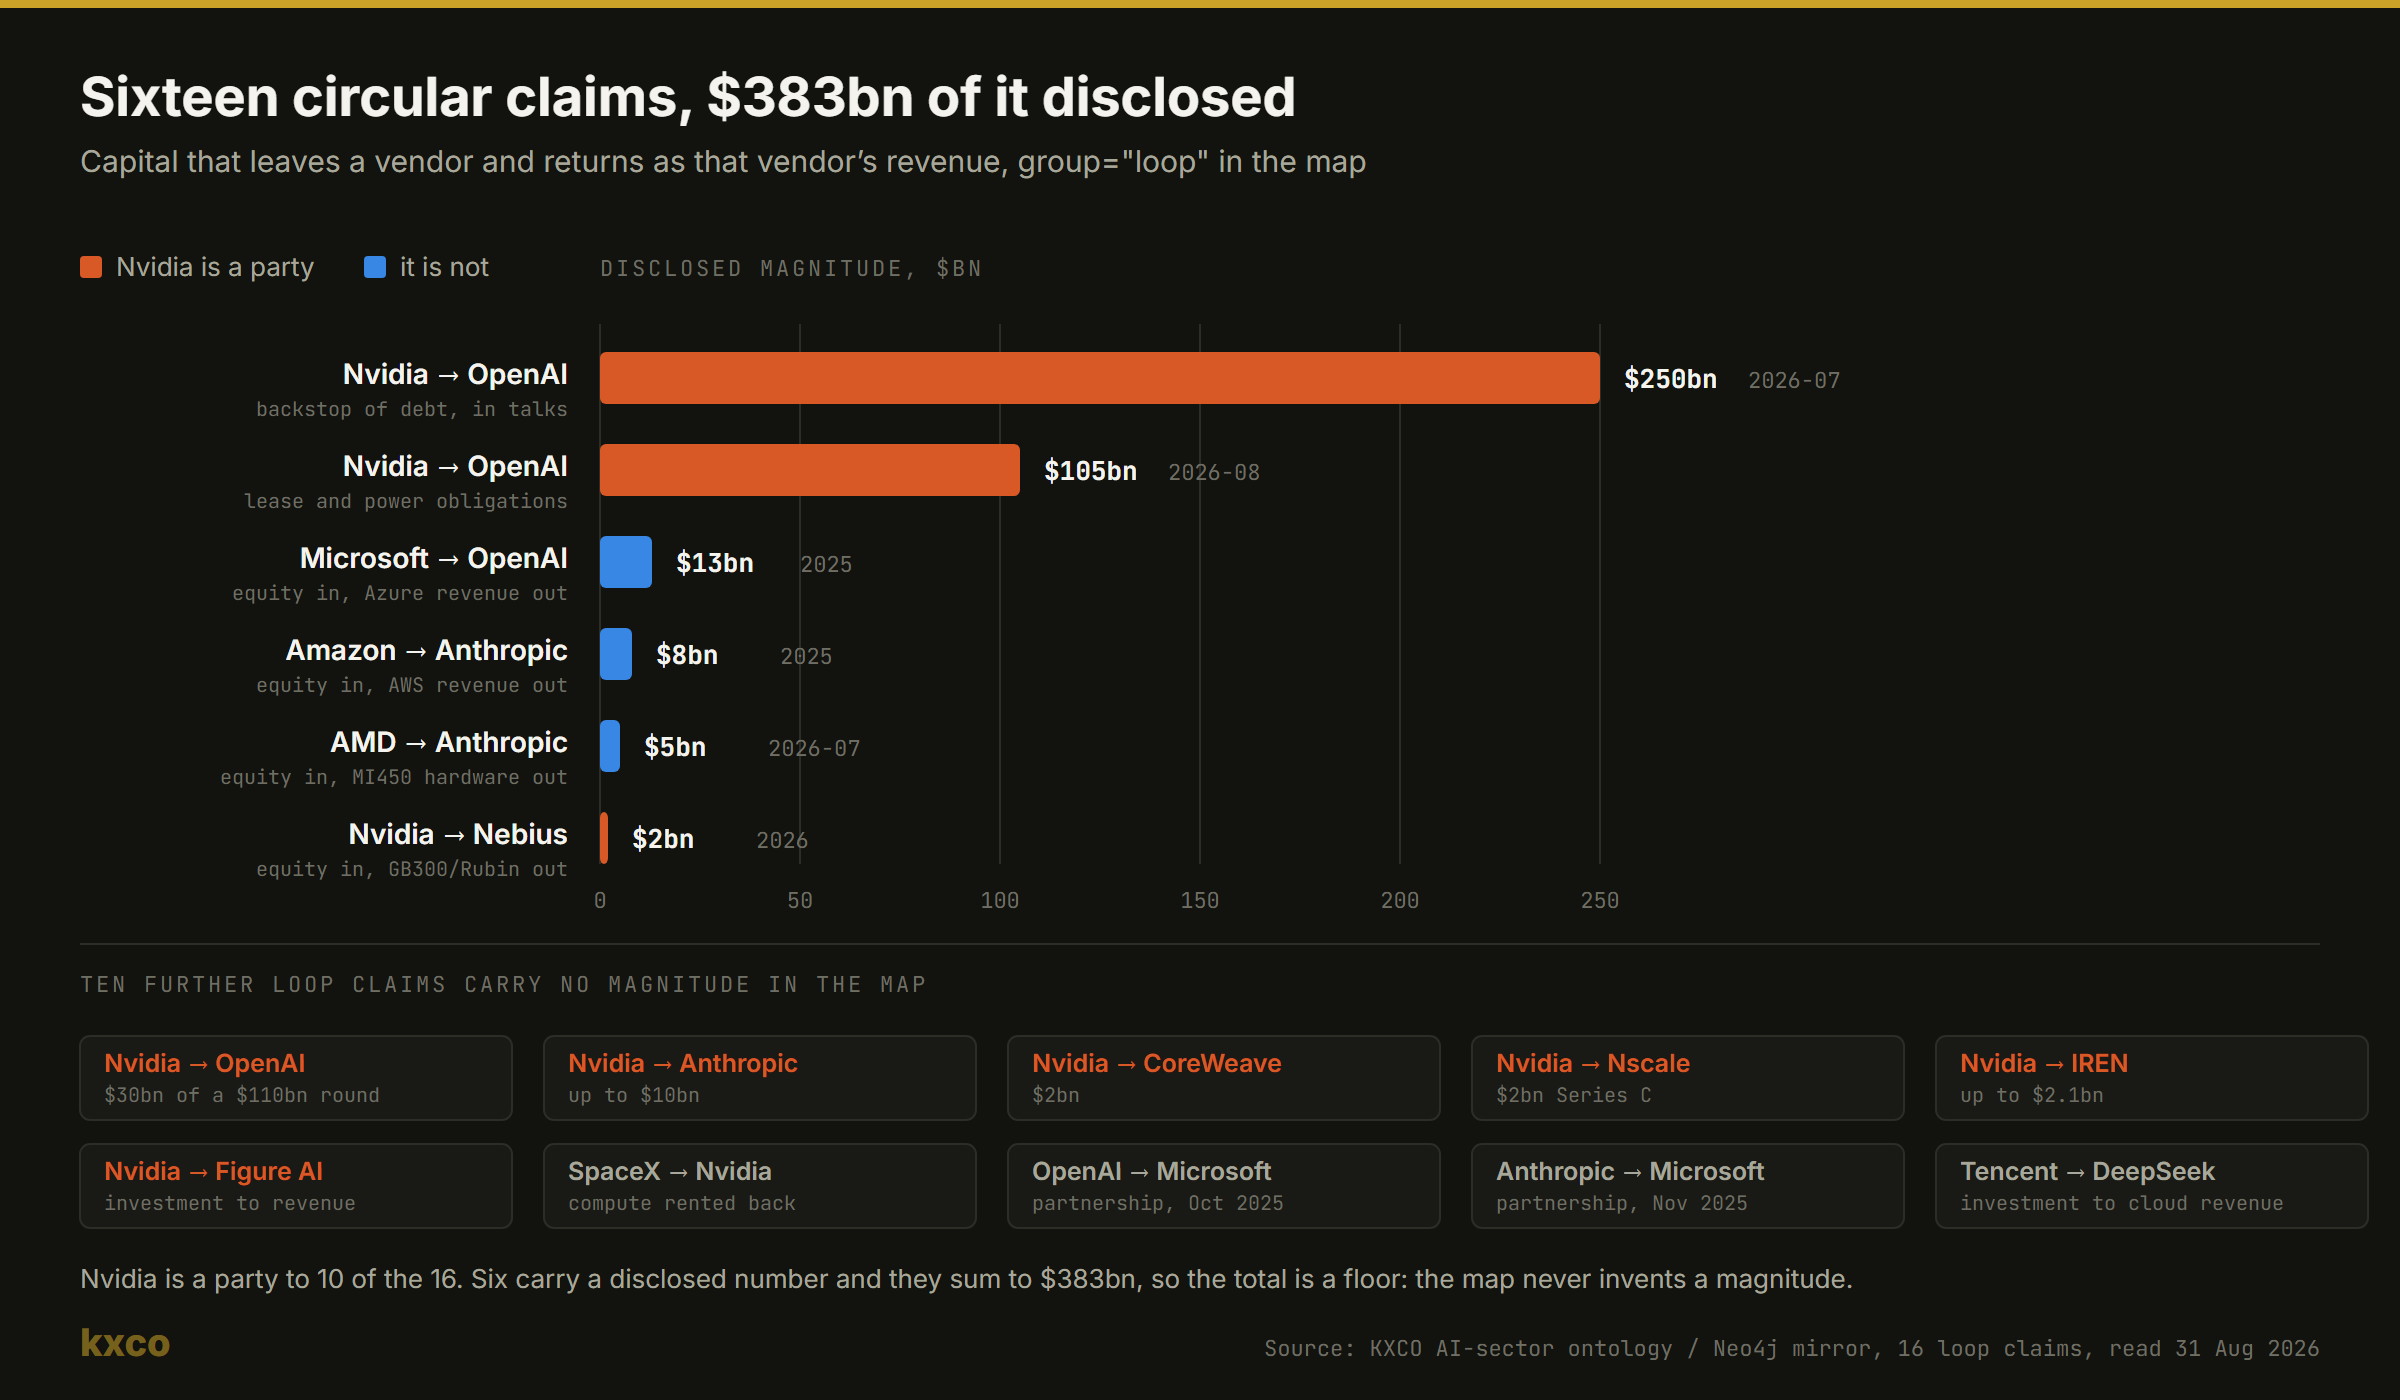
Figure 3. The map's circular-financing layer. Sixteen claims, six with a disclosed magnitude, summing to $383 billion. Nvidia is a party to ten of the sixteen. Source: KXCO AI-sector ontology, Neo4j mirror, read 31 August 2026.
Note what the third figure does not do. It does not extrapolate. Ten of the sixteen circular claims carry no magnitude at all in the map, because no source stated one, so the $383 billion is a floor and not an estimate of the circular economy's size. That is the discipline the method is for. The largest single entry, up to $250 billion of Nvidia backstopping OpenAI debt, is recorded as "in talks" with a July 2026 date attached, which is exactly how a desk should carry it. The reason this matters for the week ahead is the credit conversation. When spreads widen on AI names, the question is not whether the sector is crowded. It is whether the same dollar is being counted more than once, and in ten of these sixteen cases the counterparty on both ends is the same vendor.
Further reading inside the same project: the ontology explainer at kxco.ai/ontology, the live-map working guide at kxco.ai/developers/blog/ontology-live-guide, the argument that ontology is the missing layer in agentic AI at kxco.ai/developers/blog/ontology-missing-layer-agentic-ai, and the company root at kxco.ai. Product pillars for readers who want the institutional stack rather than the public demo: Meridian for deals, Sentinel as a quantum-resistant cloud, Treasury as an economic operating system, and Armature L1 as a post-quantum public record. The slogan worth keeping on a monitor is the true one: rent the intelligence, own the knowledge.
14. Three scenarios for the next ten sessions
Base case, about 45 percent. Friday payrolls land near +50,000 with unemployment at 4.2 percent and wages contained. Hormuz stays noisy but open. Broadcom beats and does not guide down. The 10-year holds 4.55 to 4.75 percent. Gold stabilizes above $4,400. WTI lives in the low-to-mid $80s. Nasdaq chops. AI infrastructure outperforms model-layer software. Quantum is dead money for a fortnight. This is a stock-picker's week, not an index week.
Hawkish-kinetic case, about 30 percent. Payrolls beat, wages firm, and Iran answers Larak with a broader missile wave that lifts Brent through $94. The 10-year tags 4.90 percent. Gold rips then fades as real yields win. Nasdaq duration, meaning quantum, high-multiple software and pre-profit space, sells first and sells hardest. Energy and defense outperform. The 16 September hike becomes the default. In this case the daily-chart playbook is to own crude and gold on the first gap, fade Nasdaq strength, and not hero-trade IONQ.
Soft-landing-plus-ceasefire case, about 25 percent. Payrolls are weak, wages cool, and a credible Hormuz arrangement reappears. The 10-year slumps toward 4.45 percent. Gold and Bitcoin catch a bid. AI duration re-rates. Quantum rips because it is the most rate-sensitive sleeve in the technology complex. This is the only scenario in which a full-size speculative satellite book is justified before the FOMC, and even then it is a rental, not a marriage.
15. Closing brief
The week of 31 August 2026 opens on a Sunday strike in the Strait of Hormuz, a Friday speech that put a rate hike back on the table, and a technology complex that is being asked to prove an early-cycle thesis at a grown-up multiple. Gold near $4,500 is not expensive if the long end is a fiscal problem and the Gulf is a military one. It is expensive if Warsh delivers 4 percent funds and 5 percent tens. Bitcoin near $80,000 is a policy-and-liquidity asset that will not automatically copy gold. Oil in the low $80s is a coiled geopolitical instrument. Silver is gold's impatient sibling. AI is still early: the factories are still going up, the ontology still shows a handful of physical chokepoints, and the software layer has not yet harvested the capex. Quantum is earlier than that, which is why it must be sized like an option. The space economy is no longer a slide deck. It is a listed mega-cap, a rising launch cadence, a defense budget line and an orbital compute story that has begun to swallow the AI power problem.
Trade the daily chart. Honor the calendar at livetradingnews.com/trading. Read the stack at kxco.ai/ontology-live before adding another AI ticker that turns out to be the same helium exposure you already own. Yesterday's bombing on Larak Island is the reminder that this market still has a war in it. Interest rates are the reminder that the war is not the only constraint. The early cycle in AI, quantum and space is the reminder that constraints are not the same thing as an ending.
Stocks mentioned in this article: $NVDA, $AVGO, $TSM, $ASML, $MU, $MSFT, $AMZN, $GOOGL, $META, $AMD, $SPCX, $RKLB, $ASTS, $IONQ, $QBTS, $RGTI, $XOM, $CVX, $NOC and $VRT.
Shayne Heffernan, Ph.D., is the founder of Live Trading News, the KnightsBridge Group, Knightsbridge Law and the KXCO.ai ecosystem spanning post-quantum cryptography, identity, attestation and enterprise ontology.
Disclaimer. This outlook is independent market analysis prepared for Live Trading News readers on 31 August 2026. It is not personalized investment advice, a solicitation, or a research report under any regulatory definition. Prices move. Wars escalate. Payrolls revise. Levels quoted from late-August cash and wholesale prints will be stale by the New York open. Size positions as if you can be wrong on both the war and the Fed on the same morning, because this week, you can.
Primary references for readers. Economic calendar: [livetradingnews.com/trading](https://www.livetradingnews.com/trading). KXCO ontology live map: [kxco.ai/ontology-live](https://kxco.ai/ontology-live). KXCO ontology overview: [kxco.ai/ontology](https://kxco.ai/ontology). KXCO live-map guide: [kxco.ai/developers/blog/ontology-live-guide](https://kxco.ai/developers/blog/ontology-live-guide). Federal Reserve Board policy rate page and the 29 July 2026 FOMC statement. Associated Press and CENTCOM coverage of the 30 August 2026 Larak Island strike. Ontology figures derived from the KXCO AI-sector graph in Neo4j, read 31 August 2026.
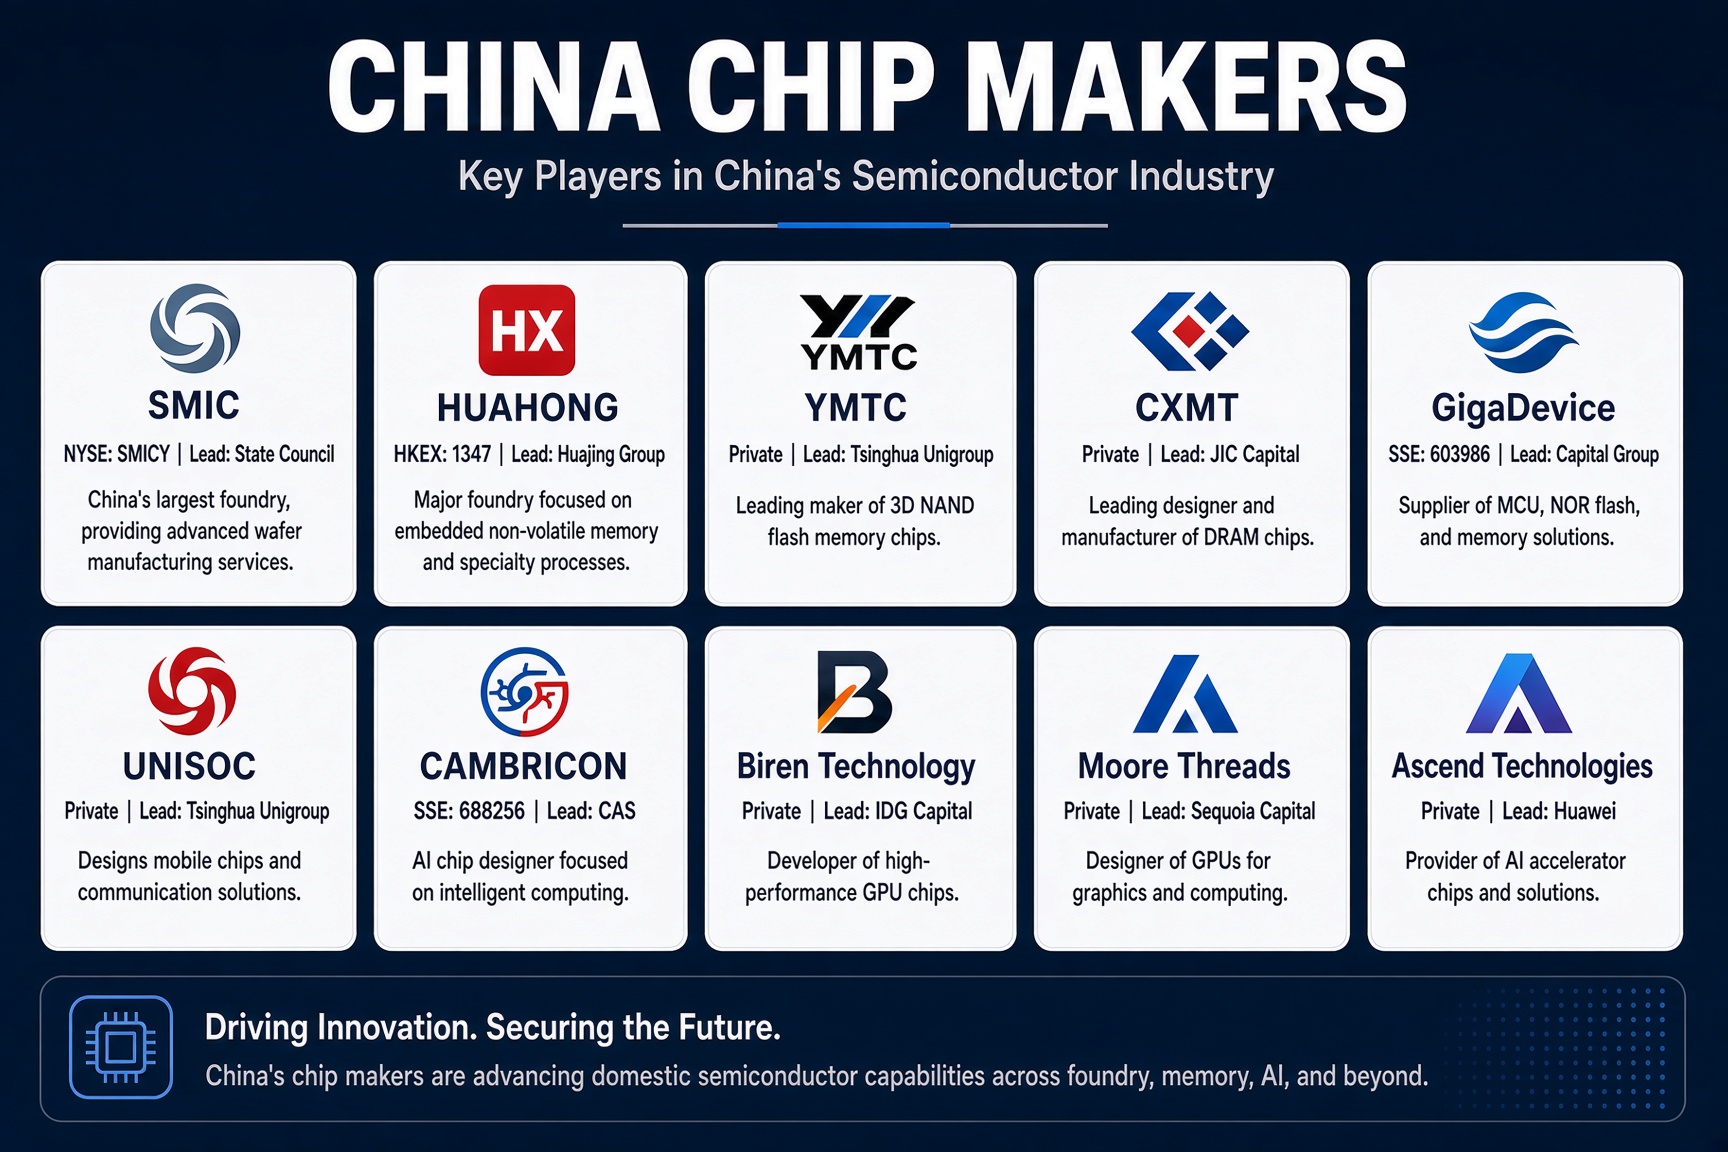
The China Chip Shock
On 10 October CXMT said it will ship DDR5 server modules on a 4F2 cell by year-end. Micron, SK Hynix, Samsung and Sandisk sold off for two sessions and Elon Musk said China scales faster than the rest of the world combined. This piece sets out China's memory makers, foundries, AI chip designers and toolmakers, with two knowledge graphs drawn from the KXCO AI Sector Ontology, and says what the sell-off prices and what it does not.

China's Coordinated Push in AI, Quantum Computing and Blockchain
On 9 October 2026 Beijing called for a nationally integrated computing-power network and a national blockchain network. DeepSeek is scaling on Huawei Ascend chips, China's intelligent computing reached 2,185 EFLOPS by June, per the industry ministry, and quantum communications remain a strength. This analysis explains the strategy and sets out the Hong Kong and US listed companies with exposure, from Tencent and Alibaba to China Mobile, HashKey and Nvidia.

Week Ahead on Wall Street: CPI, Banks and Oil
September CPI lands on Wednesday after a Fed hike and a 10-year yield at its highest since 2002. JPMorgan, Goldman and Citi open bank earnings on Tuesday, ASML and TSMC report midweek, and Saudi pipeline attacks kept Brent at $104.72 on 9 October 2026, per CNBC. The KXCO AI Sector Ontology still shows contracted demand. This week ahead sets out the calendar, the three facts that would change the call, and why dips in the AI leaders remain buying opportunities.
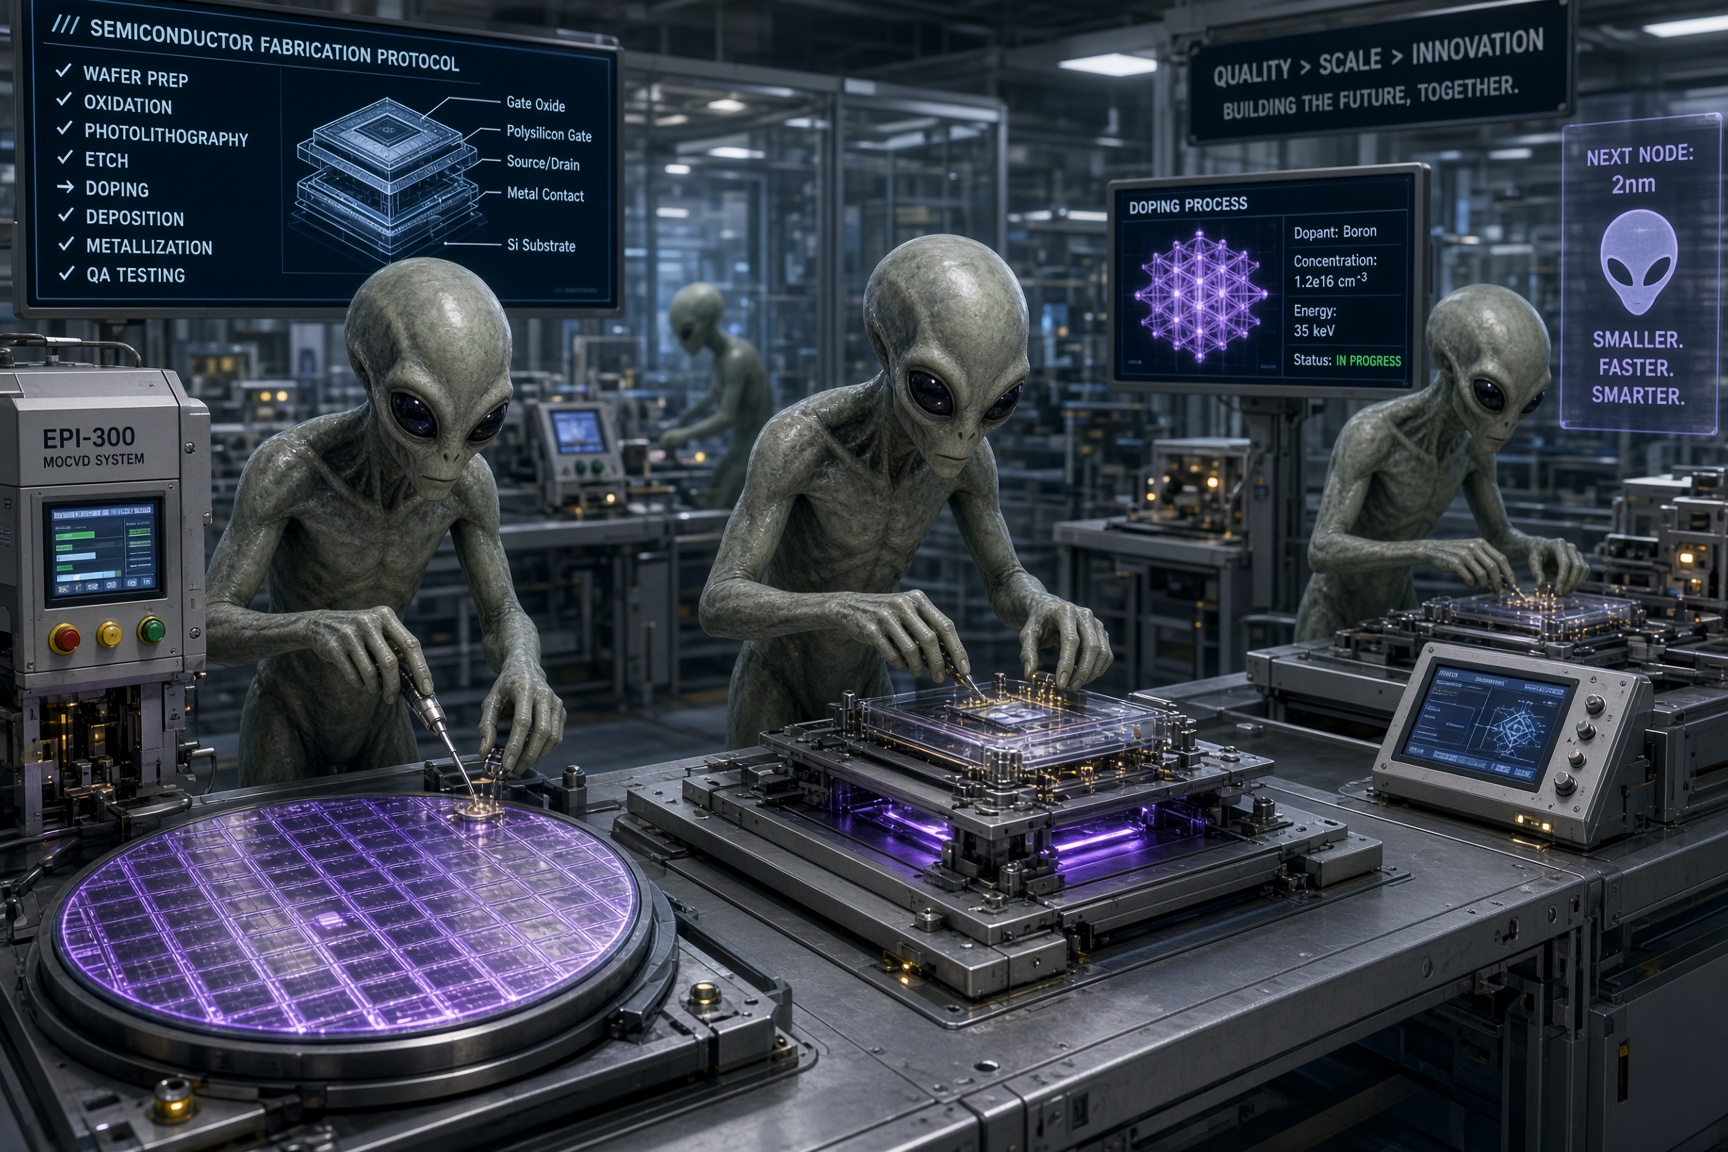
AI Is Being Powered by Tech That Looks Almost Alien
Every frontier AI model runs on chips printed by one Dutch machine. ASML's extreme-ultraviolet scanner fires a laser at up to 50,000 droplets of molten tin a second, per ASML, and bounces the light off mirrors whose deviations are tens of picometres. Veritasium called it the closest thing we have to alien technology. This piece takes the film as the brief and checks it: the machine, High-NA, and the wafer-scale chips and liquid-cooled racks downstream of it.
Every story, signed and delivered.
Subscribe to the kxco channel and get the headline, the AI-written key takeaways, and the chain-anchor link the moment we publish. Audio versions and per-ticker subscriptions arrive in the next iteration.