
Will Saudi Arabia and Iran Go to War? What It Means for Oil
A declared war between Riyadh and Tehran is a minority risk for the next year. The proxy war on Saudi oil is already here, and the oil market is pricing it.
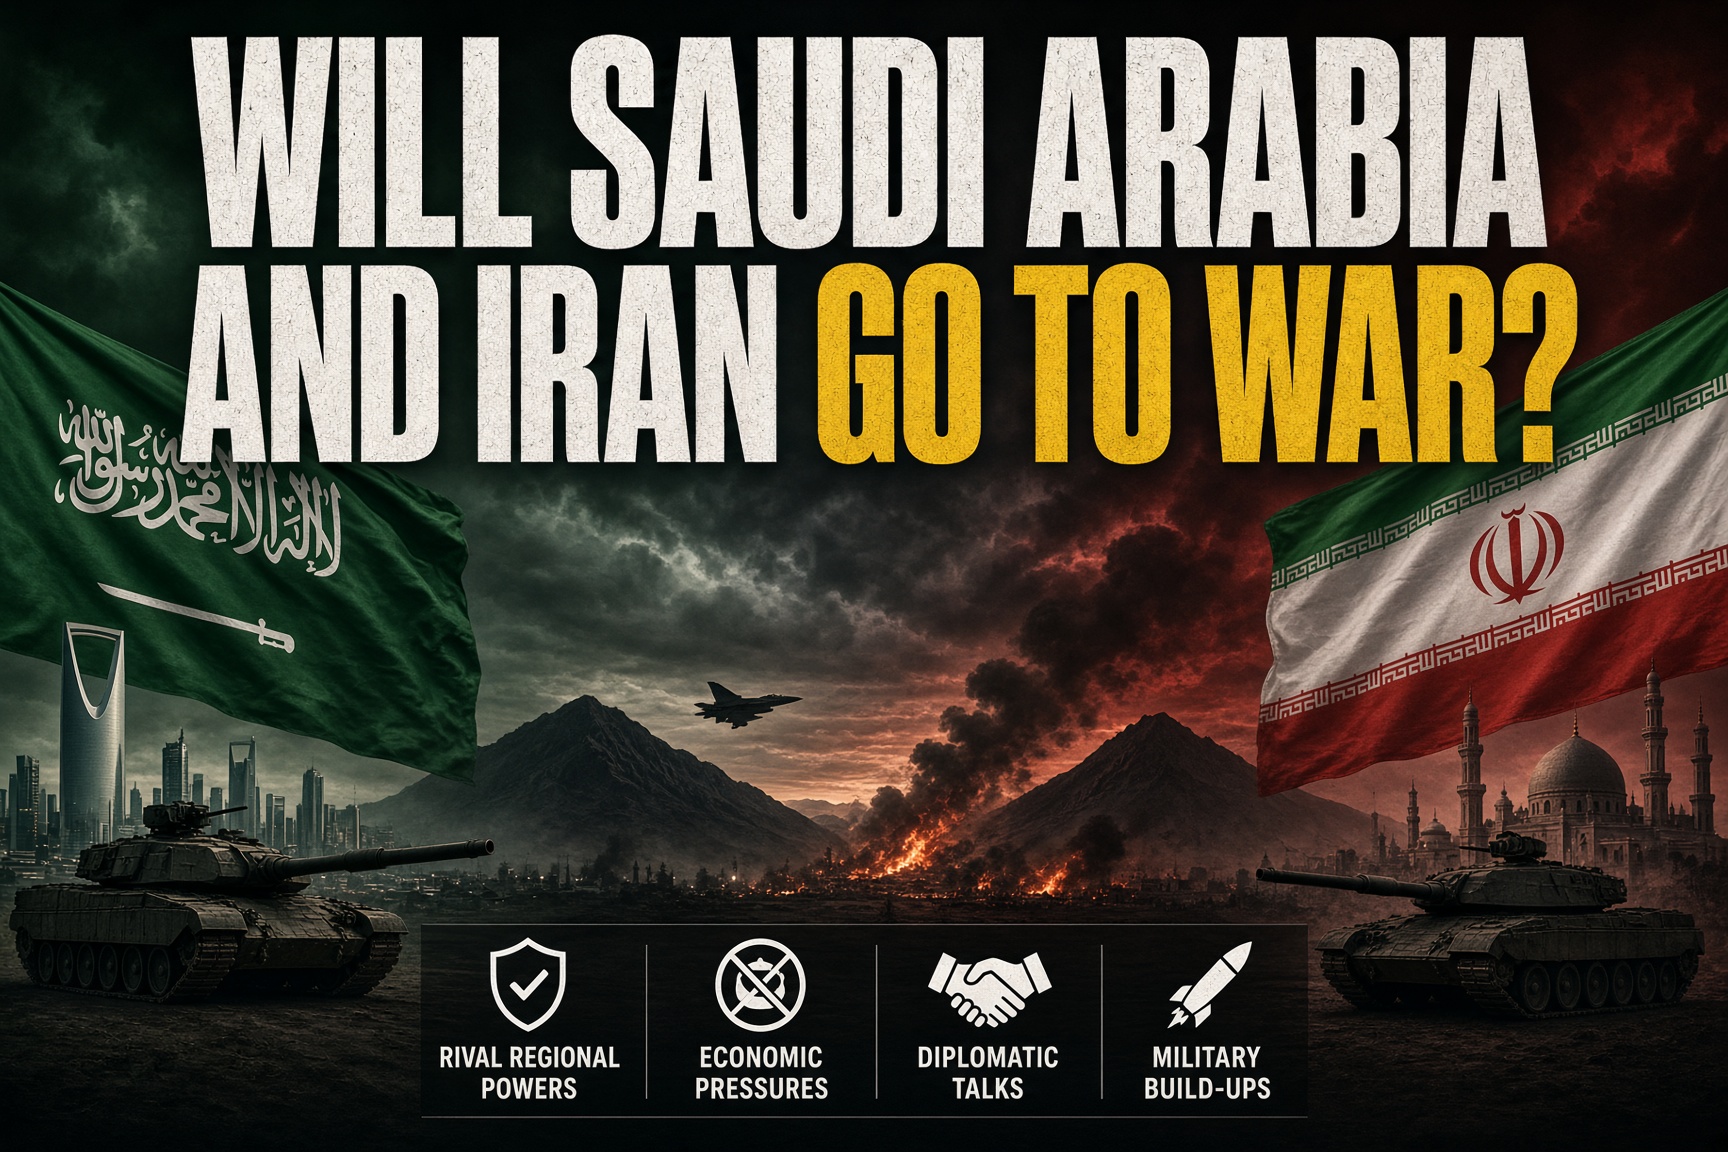
A declared war between Saudi Arabia and Iran is unlikely in the next six to 12 months, at an estimated 15% to 25% per this analysis. The war on Saudi oil is already under way: on Saturday 10 October a missile killed at least 12 people and wounded more than 300 at Riyadh's main airport, per Al Jazeera citing the Saudi civil aviation authority.
The oil market is pricing that proxy war rather than a state-to-state one. Brent settled at $104.72 on 9 October 2026, per CNBC, and the risk that matters for the price is further damage to Saudi export routes, not a declaration of war.
Where things stand
The wider war began on 28 February 2026 with US-Israeli strikes on Iran, and Iran answered the same day against Gulf states that host US forces, including Saudi Arabia, per Al Jazeera. The fighting has not been continuous. On 8 October President Trump said the United States would not attack Iran before the 3 November midterm elections, and the US blockade of Iranian ports stays in force, per The Star citing Reuters.
Saudi Arabia has been hit from three directions this year:
Iran directly. Drones in Iran's first retaliation wave were downed over the Ras Tanura refinery on 2 March, and the refinery shut, per Anadolu citing the Saudi Press Agency. On 9 April the energy ministry said attacks had halted operations at several facilities, including a pumping station on the East-West pipeline, per the Saudi Press Agency.
From Iraq. Riyadh said Iran-aligned militias in Iraq launched the drones that hit the Abqaiq processing complex in late July, per Al Jazeera. In September drones launched from Maysan province in Iraq hit East-West pipeline pumping stations, and the line was shut on 11 September; no group has claimed that attack, per Al Jazeera.
From Yemen. The Houthis declared a naval blockade of Saudi Arabia on 20 July, per Al Jazeera, and seized Mocha and Perim on the Bab al-Mandeb strait in mid-September, per Al Jazeera. Riyadh's King Khalid International Airport was struck three times in the week to 10 October. The Saudi-led coalition blames the Houthis for the deadliest strike, which has not been formally claimed.
Riyadh has answered the Houthis, not Iran. The coalition said on 5 October that 100 jets had joined its air strikes on the Houthis, its first acknowledged strikes in four years, per Al Jazeera. The crown prince asked President Trump twice in September for US strikes on the Houthis and was refused; US support was limited to intelligence and targeting, per CNN. After Saturday's strike, Trump said the United States "may" join, per CNN.
Channels to Tehran remain open but narrow. Prince Faisal bin Farhan spoke to Iran's foreign minister by phone on 6 September, per Ajel, but Riyadh declined the first meeting between the Gulf states and Iran since the war began, per CNN. China, which brokered the restoration of Saudi-Iran relations in Beijing on 10 March 2023, per Al Jazeera, asked Tehran in September to help rein in the Houthis after a Saudi request, per Reuters.
The sharpest public warning came early. On 19 March, after Iranian missiles were fired at Riyadh and the Eastern Province, Prince Faisal said that "the patience that is being exhibited is not unlimited", per Al Jazeera. Seven months on, Riyadh has still not struck Iran.
The chances of a full Saudi-Iran war
Estimate: a full-scale, direct conventional war between Saudi Arabia and Iran over the next six to 12 months is put at 15% to 25%. Source: this analysis, a judgement rather than a measurement.
The more likely path is more proxy conflict, chiefly with the Houthis, and limited direct strikes.
Four facts hold the line against a full war:
Both governments have strong reasons to avoid it. Saudi Arabia's priority is Vision 2030, its economic diversification programme, and Iran is already in a costly war with the United States and Israel and prefers pressure through proxies.
The rivalry has been managed, not fought state to state, for decades.
Diplomatic channels and third-party mediation remain open, if strained, with China pressing Tehran on the Houthis.
Each side's energy infrastructure is exposed to the other, which deters both.
Three developments would raise the probability, and each is the fact to watch:
Further mass-casualty strikes on Saudi cities or critical energy sites, by the Houthis or by Iran.
A major US escalation against Iran that pulls Saudi Arabia in, which Trump has ruled out before 3 November.
The collapse of the remaining de-escalation efforts around Hormuz and Yemen.
What the oil market is already pricing
The supply shock is measurable, and most of it has already happened:
Price. Brent settled between $100.20 and $104.72 from 1 October to 9 October 2026, per CNBC, down from an intraday peak of $109.97 on 11 September, the day the East-West pipeline was shut.
Hormuz. Exports through the strait were 8.5 million barrels a day in the week to 7 October, about 40% below the pre-war level, per CNBC citing Kpler. The figure swings: crude flows had matched the pre-war level on 28 September.
Saudi output. Saudi Arabia told OPEC that its August crude production fell to 6.24 million barrels a day, the lowest since 1990, per Al-Monitor. Exports recovered to about 6 million barrels a day in September, the highest since the war began, per CNBC citing Kpler.
The bypass. The East-West pipeline, the main route around Hormuz to the Red Sea, was back to 5.8 million barrels a day on 6 October, per Al Jazeera, against capacity of 7 million.
The Red Sea. Houthi attacks roughly halved Saudi crude loadings through Bab al-Mandeb, per Kpler. Cargoes for Europe can still go north through Suez, so the squeeze falls hardest on Asia-bound barrels. Aramco deferred or cancelled cargoes to at least three European refiners in September, per Argus.
Inventories. Global observed oil inventories fell by 507 million barrels from February to the end of August, 95 million of it in August, per the IEA.
The buffer. The US Strategic Petroleum Reserve held 282.98 million barrels on 2 October, its lowest since 1982, per the EIA. IEA members agreed a 400 million barrel release on 11 March, with 172.2 million pledged by the United States, per the IEA.
Spare capacity. Saudi Arabia held 1.71 million barrels a day of OPEC+'s 3.80 million of spare capacity before the war, but effective OPEC+ spare capacity is now 0.22 million, per the IEA. Saudi idle capacity is shut in behind constrained routes, not available to the market.
The exposure is structural. Fossil fuels still supply nearly 81% of global energy consumption, per Al Jazeera, and the disruption has already lengthened shipping routes, raised insurance costs and tightened product markets. The KXCO AI Sector Ontology records a second channel: Hormuz also carries about a third of the world's helium, which chip fabs cannot replace.
The war map
Exhibit 1 draws who has struck what in 2026, which Saudi asset or route each strike reached, and where it met the market. Attribution follows each source exactly.
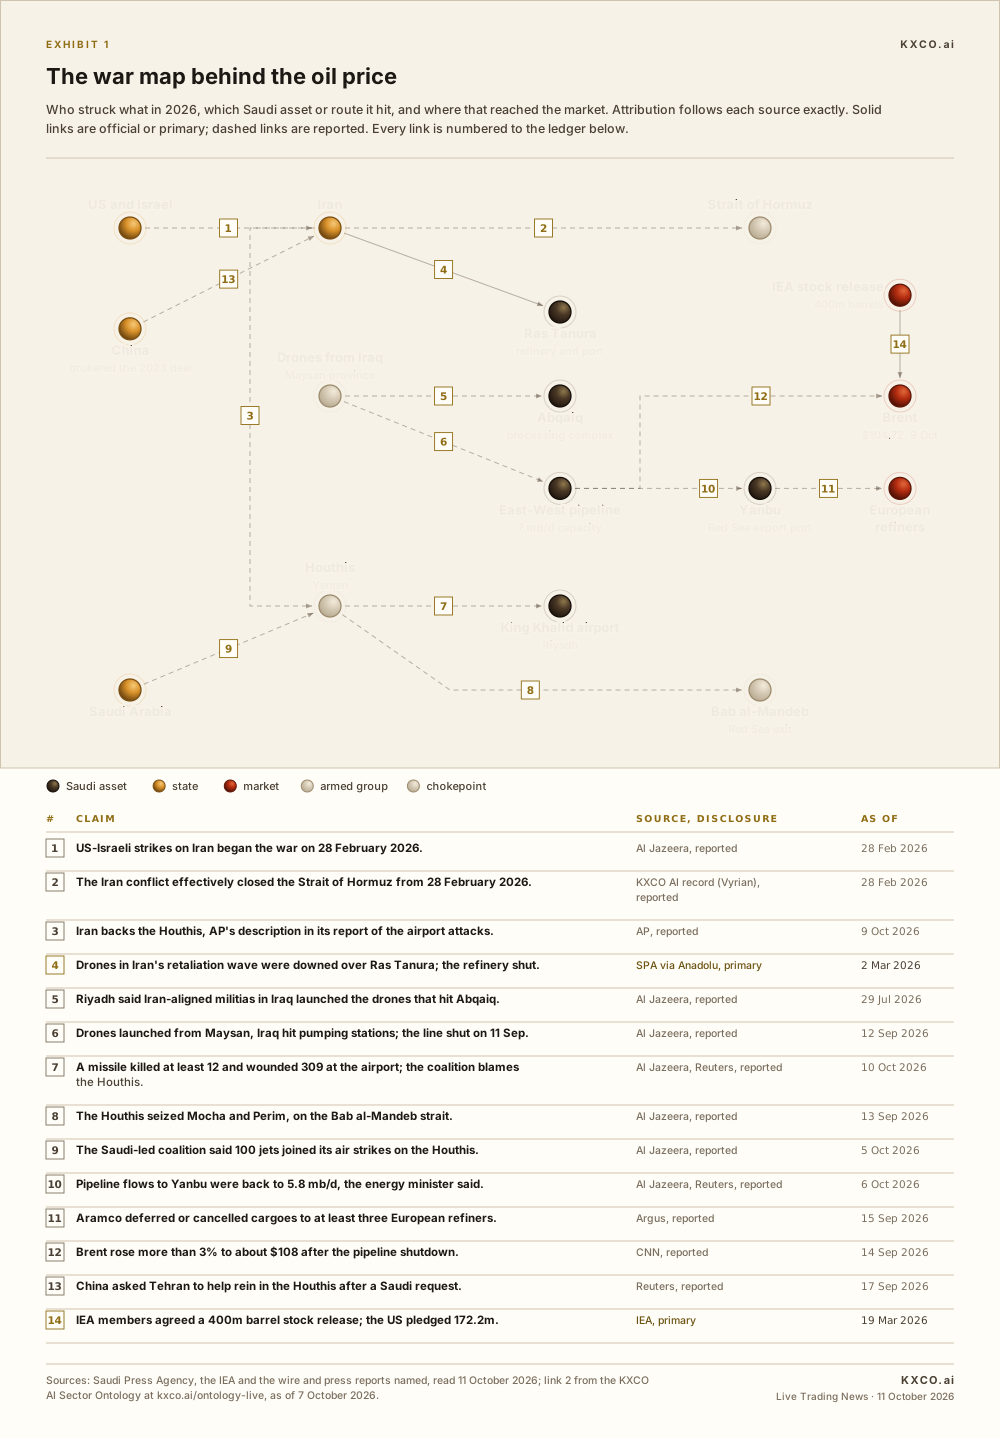
Exhibit 1. The war map behind the oil price. Each numbered link is a sourced claim, listed under the graph.
Three paths for Brent
The scenarios below are this analysis's estimates, not forecasts from any market source:
Continued proxy war and limited strikes, the most likely path: Brent holds a $95 to $115 range with periodic spikes, per this analysis's scenario estimate.
Major new damage to Saudi export capacity, or a sustained closure of both Hormuz and the Red Sea route: Brent moves toward $120 to $140 or higher as inventories draw further, per this analysis's scenario estimate. For scale, Brent settled at $118.35 on 31 March 2026, per CNBC.
De-escalation and a partial reopening of Hormuz: Brent eases toward the mid-$80s to low-$90s over time, per this analysis's scenario estimate. Depleted stocks limit the fall, and Aramco's chief executive said on 5 October that rebuilding inventories could take up to two years, per Al Jazeera.
Further Saudi production losses would amplify every path, because Saudi Arabia is the market's swing producer and its spare capacity is the buffer that is now missing. The Energy and Commodities Center and the Live Trading News trading page carry the live prices and calendar.
What to watch
Whether the United States joins the Saudi-led strikes on the Houthis, which Trump left open on 10 October.
Kpler's weekly Hormuz export figures, published on Fridays, against the 8.5 million barrels a day of the week to 7 October.
East-West pipeline flows against the 5.8 million barrels a day reported on 6 October.
The IEA and OPEC monthly oil market reports in mid-October, the first official readings of Saudi output for September.
The EIA's next weekly SPR figure on Thursday 15 October.
Sources: Al Jazeera, Reuters, CNN, CNBC, AP, the Saudi Press Agency, the IEA, the EIA, Kpler and Argus, as linked in the text, read on 11 October 2026. Probabilities and price ranges are this analysis's estimates.
Shayne Heffernan, Ph.D., is the founder of Live Trading News, the KnightsBridge Group, Knightsbridge Law and the KXCO.ai ecosystem spanning post-quantum cryptography, identity, attestation and enterprise ontology.
This commentary is for informational purposes and does not constitute investment advice.
Earnings, the Economic Calendar and Trading Strategies: September 8 to 12, 2026
A four-session week decides more than a print. Oracle reports after the close on Thursday 10 September, PPI lands that morning and CPI on Friday, with the ECB in between and the FOMC eight days out. Oracle is the last hyperscaler of the cycle and the widest value gap on the KXCO Ontology Live Analyst Outlook layer: a $457bn market value under a $638bn contracted backlog. Here is the calendar, the graph behind it, the levels and the book.
Inside the KXCO AI Sector Ontology: What the Public Map Shows, and What Runs Behind It
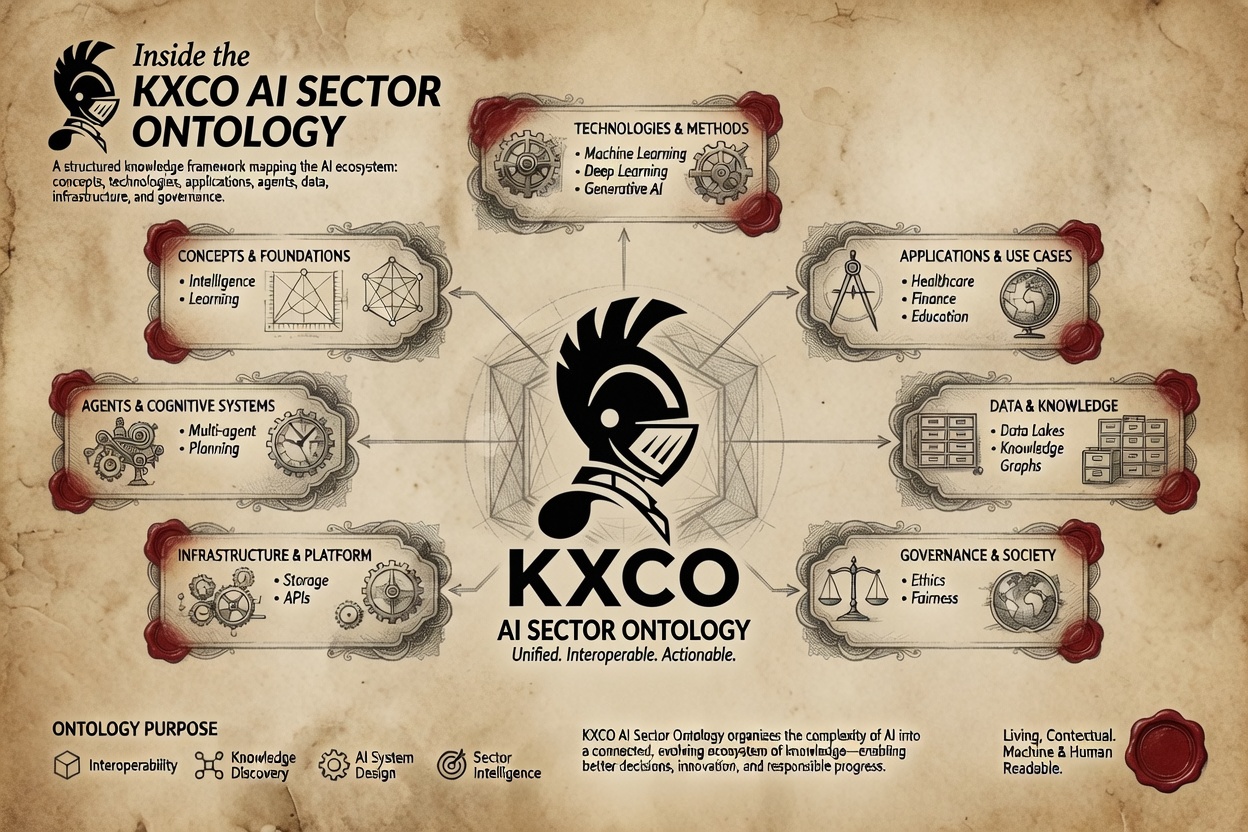
The public AI sector ontology at kxco.ai/ontology-live is a working window onto a much larger in-house system, and KXCO says so in plain language. Shayne Heffernan walks the free map: 315 entities, 713 typed and sourced claims, about $2.4tn of tracked flows, four critical findings, nine chokepoints including a shipping lane, fifteen circular capital loops, five mapped opportunities and sell-side consensus on the 14 public majors in the graph. Every number opens into its source.

Compute and Electricity: The Defining Challenge of Our Times
Compute is no longer limited by silicon. It is limited by firm power. Shayne Heffernan on the AI electricity shock, the nuclear resurgence, the top ten electricity producing countries today and in 2036, who is building for the future, and the equity map of winners across nuclear, gas, fuel and grid.
Big Tech Earnings, the Fed and $100 Oil. Trading Strategies for Every Sector
Microsoft, Meta, Apple and Amazon report, the Fed decides, and oil sits above $100. Shayne Heffernan on the week ahead, with the full economic calendar and a trading strategy for big tech, AI, quantum, gold, silver, FX and Bitcoin.
Every story, signed and delivered.
Subscribe to the kxco channel and get the headline, the AI-written key takeaways, and the chain-anchor link the moment we publish. Audio versions and per-ticker subscriptions arrive in the next iteration.