
Inside the KXCO AI Sector Ontology: What the Public Map Shows, and What Runs Behind It
315 entities, 713 typed claims and about $2.4tn of tracked capital flows, and KXCO calls it the smallest ontology it runs. Shayne Heffernan walks the public map at kxco.ai/ontology-live, finding by finding.
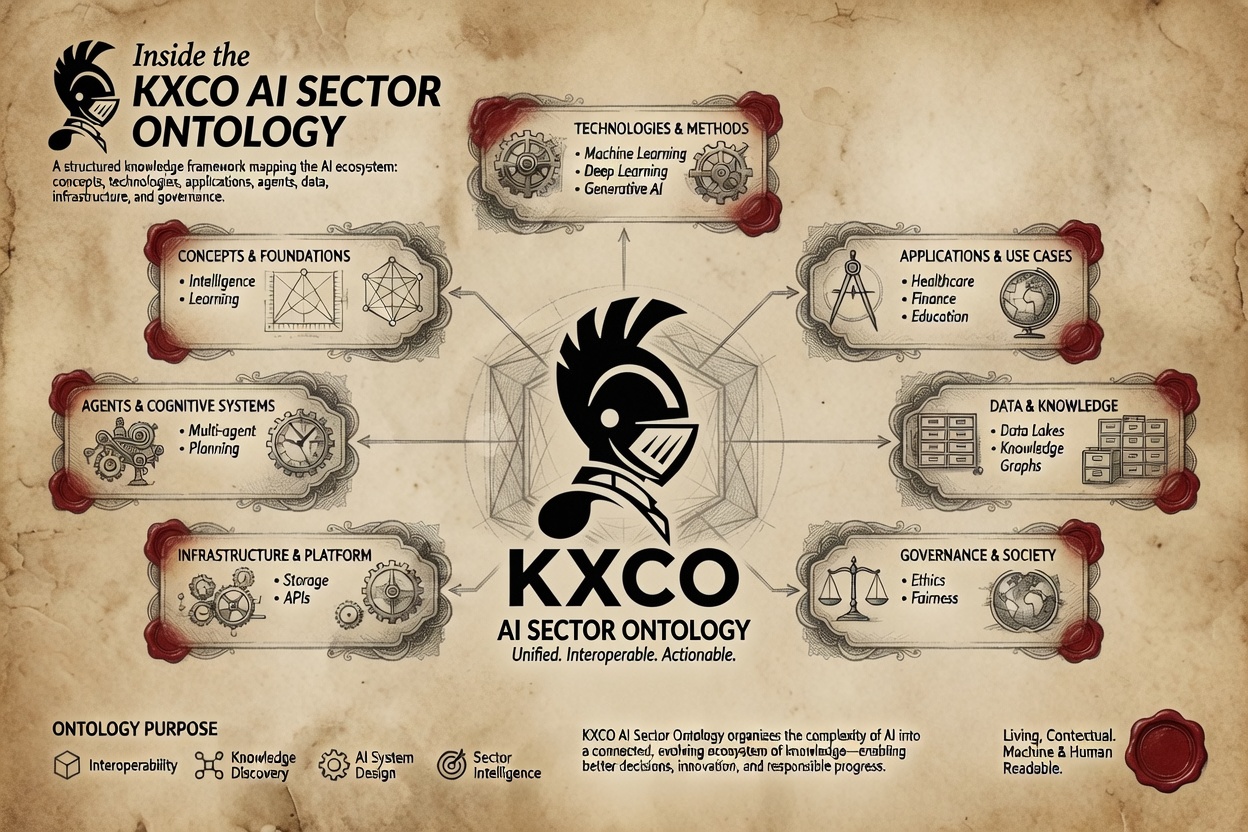
The public AI sector ontology at kxco.ai/ontology-live is a working window onto a much larger system. KXCO says so itself, in plain language, on the developers' blog: the public map is "free and public, and the smallest of the ones we run."
That sentence is the right place to start. What you can open in a browser is a deliberately reduced version of the engine KXCO operates in-house, released so that anyone can inspect the method rather than take the capability on trust. Every number on the page opens into a typed claim with a source, a date and a confidence level. Nothing asks you to believe it.
What makes it worth an article is how much still comes through a window that size. The public map currently carries 315 entities, 713 typed claims and about $2.4 trillion of tracked capital flows, and out of that it surfaces 35 ranked findings covering the concentration of the AI supply chain, the circularity of the capital funding it, the physical chokepoints upstream of the technological ones, and five strategic openings the same structure creates.
I have spent time inside it. Below is what it shows, how to read it, and why the reduced version is a fair advertisement for what sits behind it.
What the public window contains
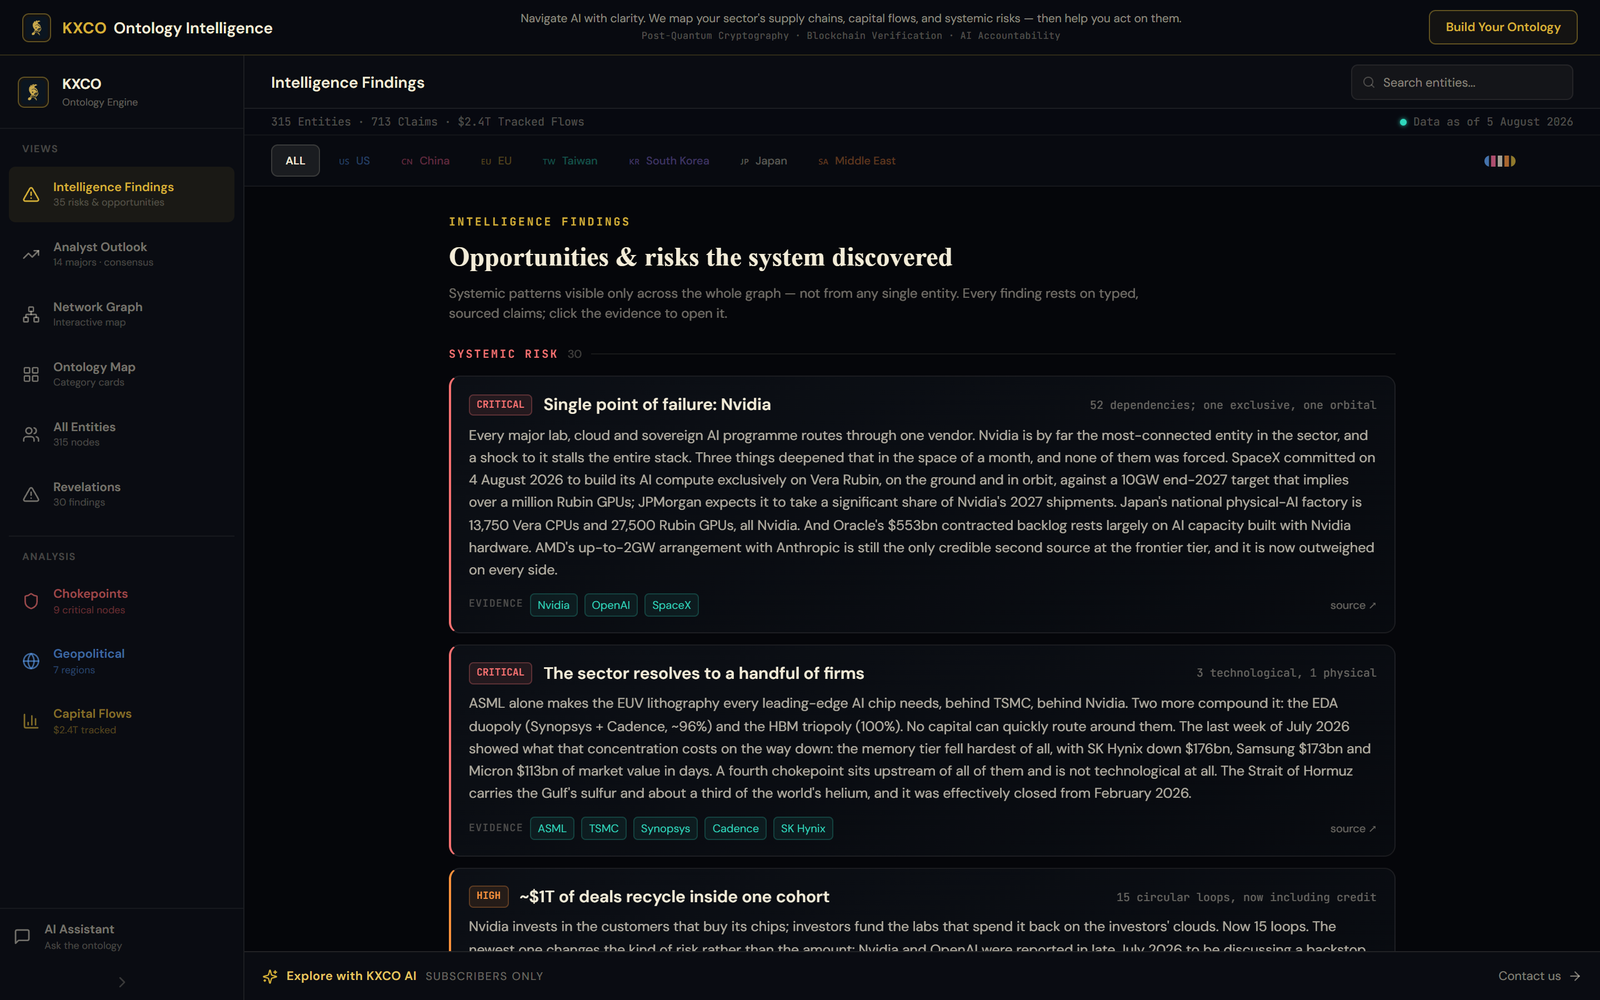
The interface is restrained on purpose. There is no animation competing for attention. Severity labels, evidence chips and source links do the navigating, and the whole graph can be sliced by region across the United States, China, the European Union, Taiwan, South Korea, Japan and the Middle East.
The public surface | As of 5 August 2026 |
|---|---|
Entities mapped | 315 |
Typed claims between them | 713 |
Capital flows tracked | About $2.4 trillion |
Ranked findings | 35 |
Chokepoints flagged as single points of failure | 9 |
Regional filters | 7 |
Public listed majors carried with consensus data | 14 |
Views available without a subscription | 6 |
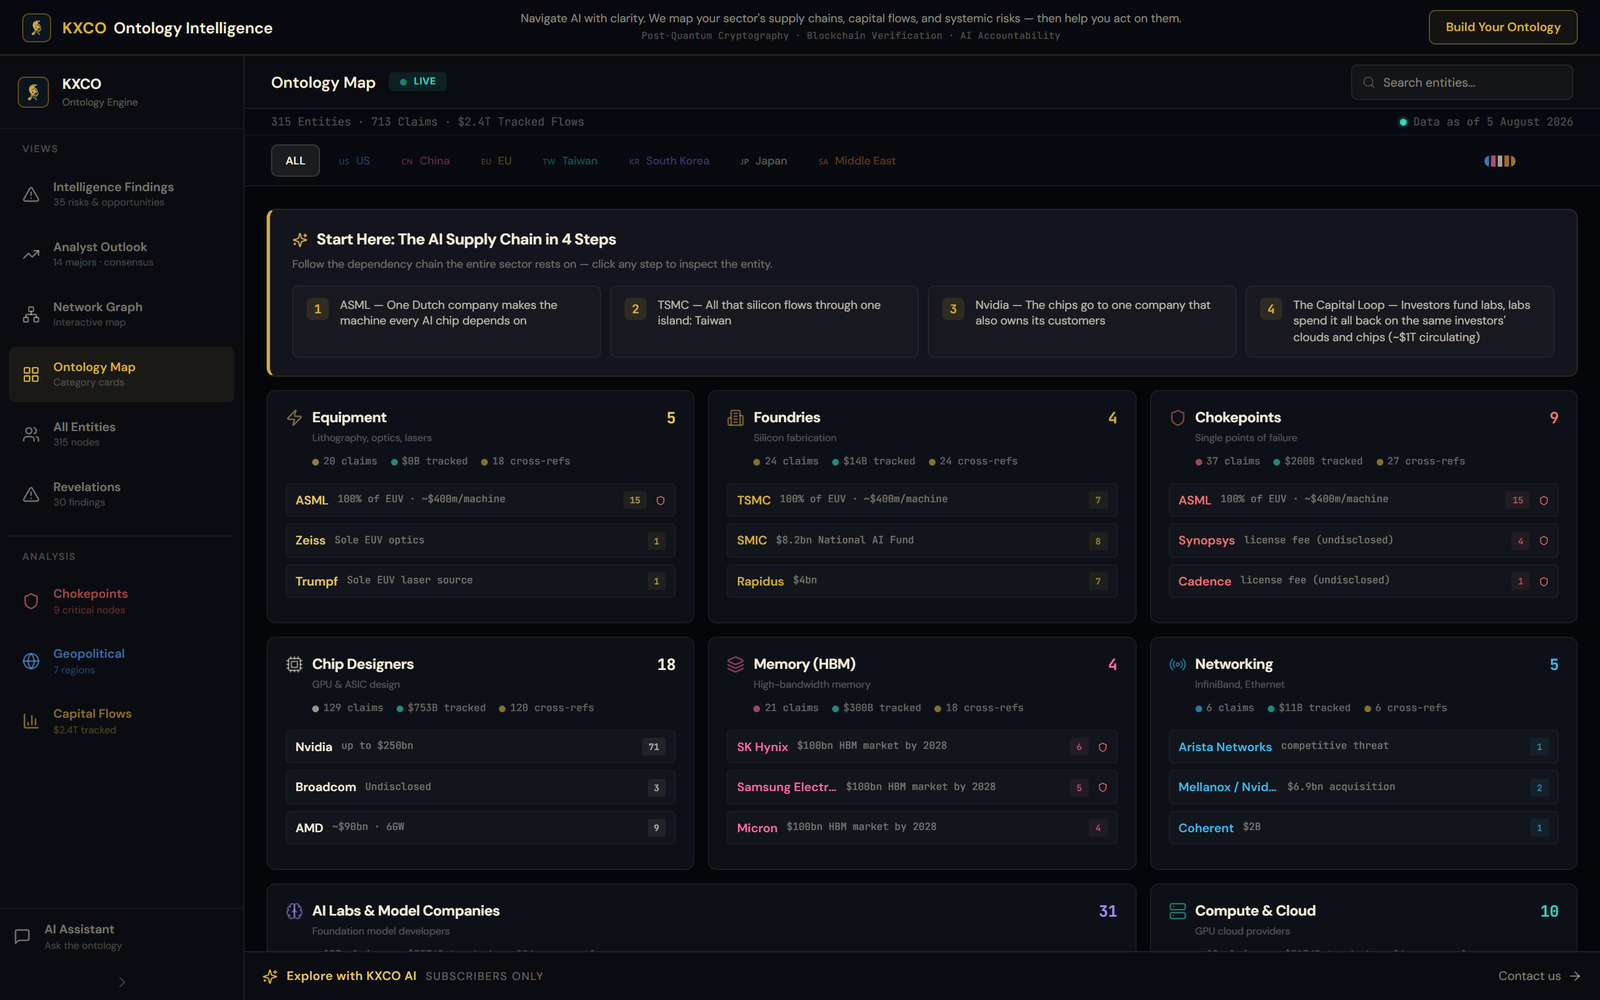
Six views sit in the sidebar: Intelligence Findings, Analyst Outlook, Network Graph, Ontology Map, All Entities and Revelations. An AI assistant that lets you interrogate the graph in natural language sits below them and is reserved for KXCO AI subscribers, along with the deeper query surface. Everything else on that list is open.
Every relationship is typed, and that is the whole point
A news feed gives you events. A database gives you rows. An ontology gives you typed, directional, sourced relationships between named things, which is what allows a pattern spanning six companies and three jurisdictions to become visible at all.
The claims on the public map sort into nine relationship types.
Relationship type | Share of the graph | What it records |
|---|---|---|
Economic | 26% | Supply, purchase and capacity relationships between firms |
Capital | 26% | Equity investments, debt facilities and valuations |
Government | 17% | Contracts, clearances, export rules and state equity |
Control | 12% | Board seats, ownership and operating control |
Talent and lineage | 7% | Founders, alumni and where key people came from |
Rivalry | 5% | Direct competition between mapped entities |
Legal | 4% | Litigation, probes and regulatory action |
Circular flows | 2% | Loops where money returns to where it started |
Data and technology | 1% | Model, data and infrastructure dependencies |
Each of those carries a source URL, an as-of date, a validity window and a confidence rating, so a claim that stops being true can be superseded rather than quietly edited. That discipline is unglamorous and it is the reason the rest of the page holds up.
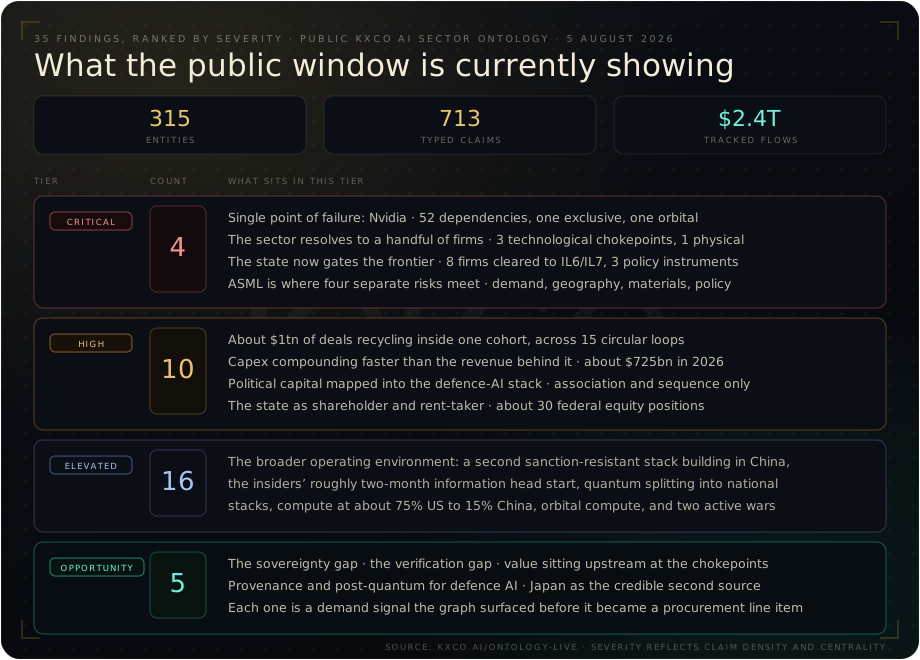
The four critical findings
Severity on this map is not editorial adjective. It reflects how dense and how central the supporting claim network is. A critical finding rests on a chokepoint or single point of failure that shows up across several independent evidence chains.
Critical finding | The metric on the card | Why it ranks where it does |
|---|---|---|
Single point of failure: Nvidia | 52 dependencies, one exclusive, one orbital | Nvidia carries 71 mapped relationships, more than any other entity. SpaceX committed on 4 August 2026 to build its AI compute exclusively on Vera Rubin, on the ground and in orbit, against a 10GW end-2027 target implying over a million GPUs. Japan's national physical-AI factory is specified as 13,750 Vera CPUs and 27,500 Rubin GPUs. Oracle's $553bn contracted backlog rests largely on Nvidia hardware. |
The sector resolves to a handful of firms | 3 technological chokepoints, 1 physical | ASML alone makes the EUV lithography every leading-edge AI chip is printed on. Behind it sits TSMC, and beside them the EDA duopoly at about 96% share and the HBM triopoly. In the last week of July 2026 the memory tier alone lost SK Hynix $176bn, Samsung $173bn and Micron $113bn of market value in days. |
The state now gates the frontier | 8 firms cleared, 3 policy instruments, 1 exclusion | Eight companies held IL6 and IL7 classified-network agreements as of 1 May 2026: SpaceX, OpenAI, Google, Nvidia, Reflection, Microsoft, AWS and Oracle. Access to the most sensitive government workloads is discretionary rather than statutory, which no purely commercial valuation model captures. |
ASML is where four separate risks meet | Sole source, four exposures, three of them indirect | Demand, geography, materials and policy all resolve to one company. The July 2026 capacity expansion eases volume and deepens concentration at the same time, because more of the world's leading-edge capacity now depends on one firm executing one expansion. |
The fourth of those is the one I would point a newcomer to first, because it is the finding a human analyst is least likely to assemble unaided. Three of the four risks reach ASML indirectly. A shipping lane can idle ASML tools without anyone touching ASML, an export licence or a fab. You only see that if the paths are drawn.
The high tier is where the money is
Ten findings sit in the high band, and four of them matter directly to how anyone prices this sector.
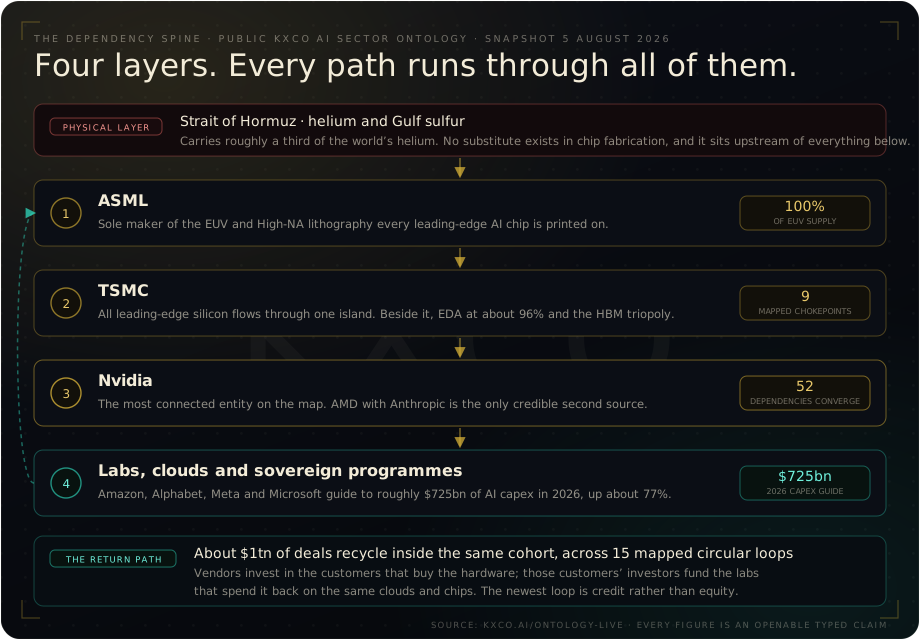
Circular capital. About $1 trillion of deals recycle inside a relatively closed cohort, across 15 mapped loops. Vendors invest in the customers that buy the hardware, and those customers' investors fund the labs that spend it back on the same clouds and chips. The newest loop changes the kind of risk rather than the amount: Nvidia and OpenAI were reported in late July 2026 to be discussing a backstop of up to $250bn, which would let OpenAI borrow against Nvidia's credit rather than take Nvidia's equity. Reported as talks, not a signed agreement, and the map records it that way.
Capex against revenue. Amazon, Alphabet, Meta and Microsoft guide to roughly $725bn of AI capital spending in 2026, up about 77% on roughly $410bn in 2025. Cloud revenue is accelerating alongside it, so demand is not the open question. Funding the rate of spend without leaning on the circular structures above is.
Political capital in the defence-AI stack. The map records that funds associated with Donald Trump Jr. and Eric Trump hold positions in at least 15 companies seeking federal business, with 11 of those through 1789 Capital, and that the Washington Post reported on 13 July 2026 those companies had secured at least $3.2bn in federal contracts since the investments were made. The framing on the card is careful and worth repeating: it records association and sequence, who invested in what and when, and what federal business followed. It does not assert causation, and neither does any source it cites.
The state as shareholder. Direct federal equity now spans a reported thirty-odd companies, including about 10% of Intel for $8.9bn, which makes the United States government Intel's largest single shareholder. Since August 2025 Nvidia and AMD have paid the Commerce Department 15% of revenue on specified China AI chip sales in exchange for export licences. The consequence for reading the graph is concrete: on several nodes the state is a counterparty, not a regulator.
Nine chokepoints, and one of them is a shipping lane
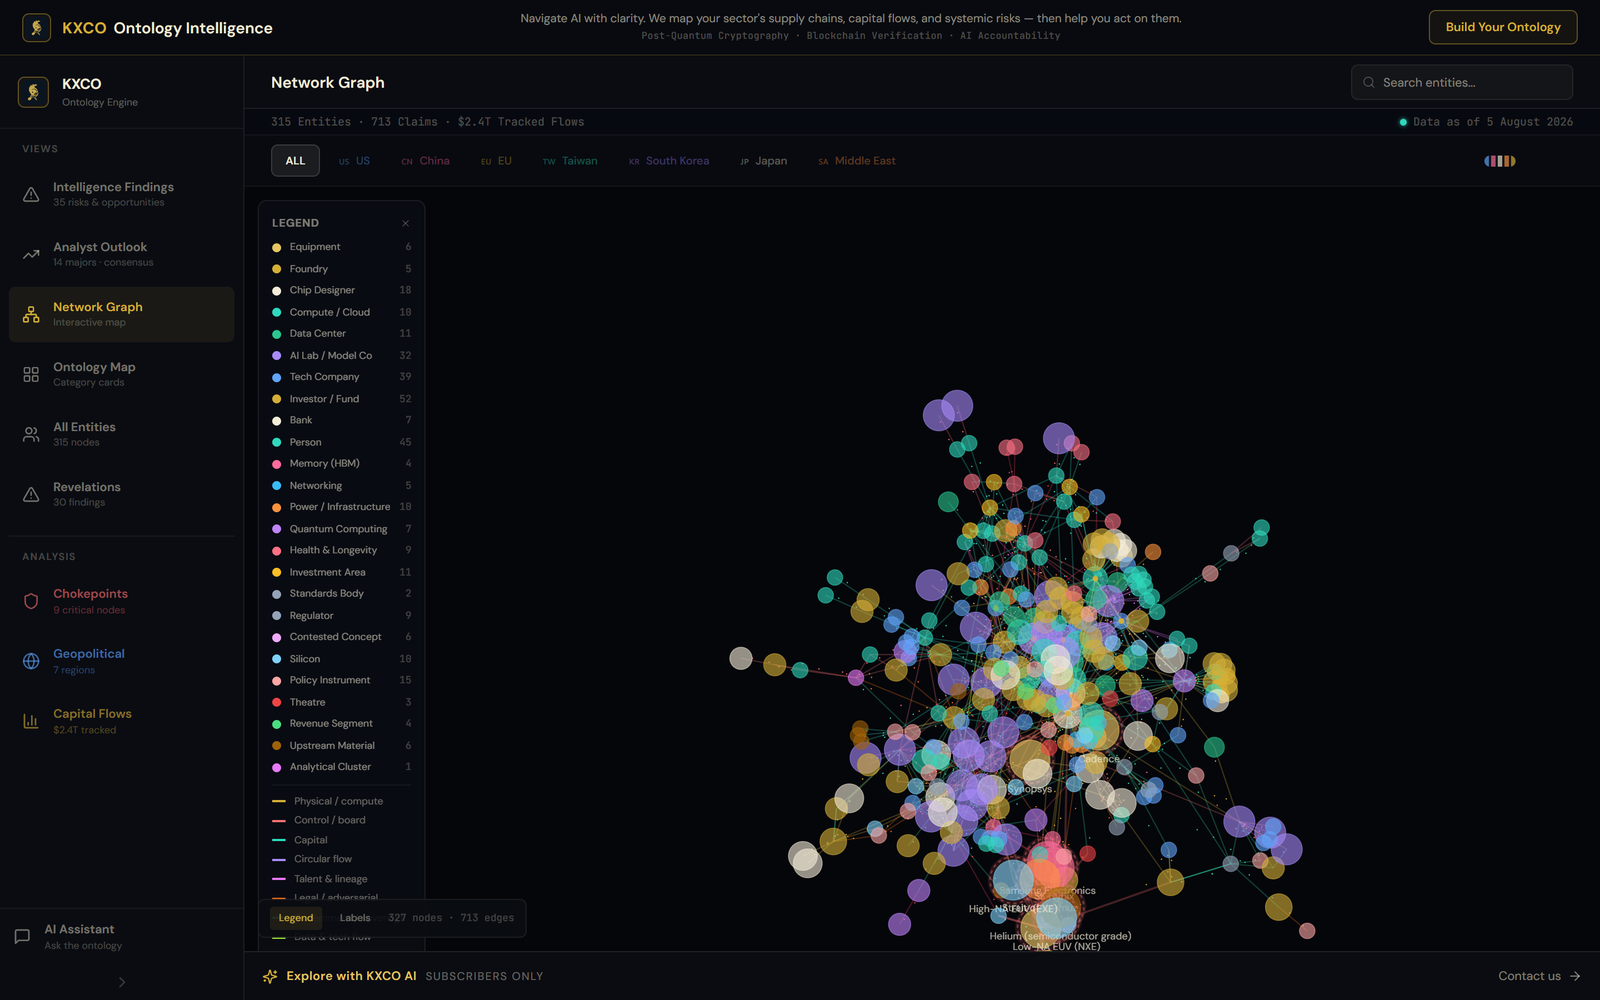
The map flags nine nodes as single points of failure. Seven are technological, and two are physical or material, which is the part most sector models leave out.
Chokepoint | Layer | What depends on it |
|---|---|---|
ASML | Equipment | Every leading-edge AI chip, through EUV and High-NA lithography |
Low-NA EUV (NXE) and High-NA EUV (EXE) | Tooling | The current node and the next one |
Synopsys and Cadence | Design software | Roughly 96% of chip design, as a duopoly |
SK Hynix and Samsung Electronics | Memory | High-bandwidth memory for AI accelerators |
Helium, semiconductor grade | Material | Carrier gas, cleanroom purge and wafer coolant, with no substitute |
Strait of Hormuz | Geography | Gulf sulfur and roughly a third of the world's helium |
The Hormuz entry is the clearest single illustration of what an ontology does that a screener cannot. The strait was effectively closed from 28 February 2026. Ultra-pure helium prices doubled. Memory fab output begins declining within one to two weeks of rationing. None of that appears in a semiconductor income statement until well after it matters, but the dependency chain from a shipping lane to a wafer was already drawn on the map.
Five opportunities, framed as demand signals
Risk mapping is only half of what the page produces. Five findings are logged as opportunities, and they follow directly from the same structure.
Opportunity | The reading |
|---|---|
The sovereignty gap | Every participant depends on a stack it does not control. Japan is the largest worked example, with METI roughly quadrupling its FY2026 AI and semiconductor budget to about Y1.23tn inside a Y370tn, 17-field national framework running to FY2040. |
Value sits upstream | As open weights commoditise the model layer, durable value concentrates in lithography, fabrication, memory, the one GPU vendor, and in energy. |
Japan as credible second source | Rapidus for state-backed 2nm logic, Tower Semiconductor taking up to Y160bn for silicon photonics and advanced packaging, on top of an existing base in robots, materials and equipment. The diversification is real and the timelines are late-decade. |
The verification gap | With demand partly marking its own homework, trust is the scarce asset. A July 2026 breach involving sandboxed test models could not be fully investigated because the closed tools involved blocked forensic analysis. |
Provenance and post-quantum for defence AI | AI is moving onto classified networks with model supply chains that are not audited. Verifiable, quantum-safe provenance is the missing layer. |
The last two are where KXCO's own stack points, and the page does not hide that. What is useful for a reader is that the demand signal is mapped across the sector rather than asserted about one vendor. This is the same thesis running through KXCO Sentinel and the Nexus verification stack, and here you can see the evidence that led to it rather than the marketing that followed.
The Analyst Outlook view
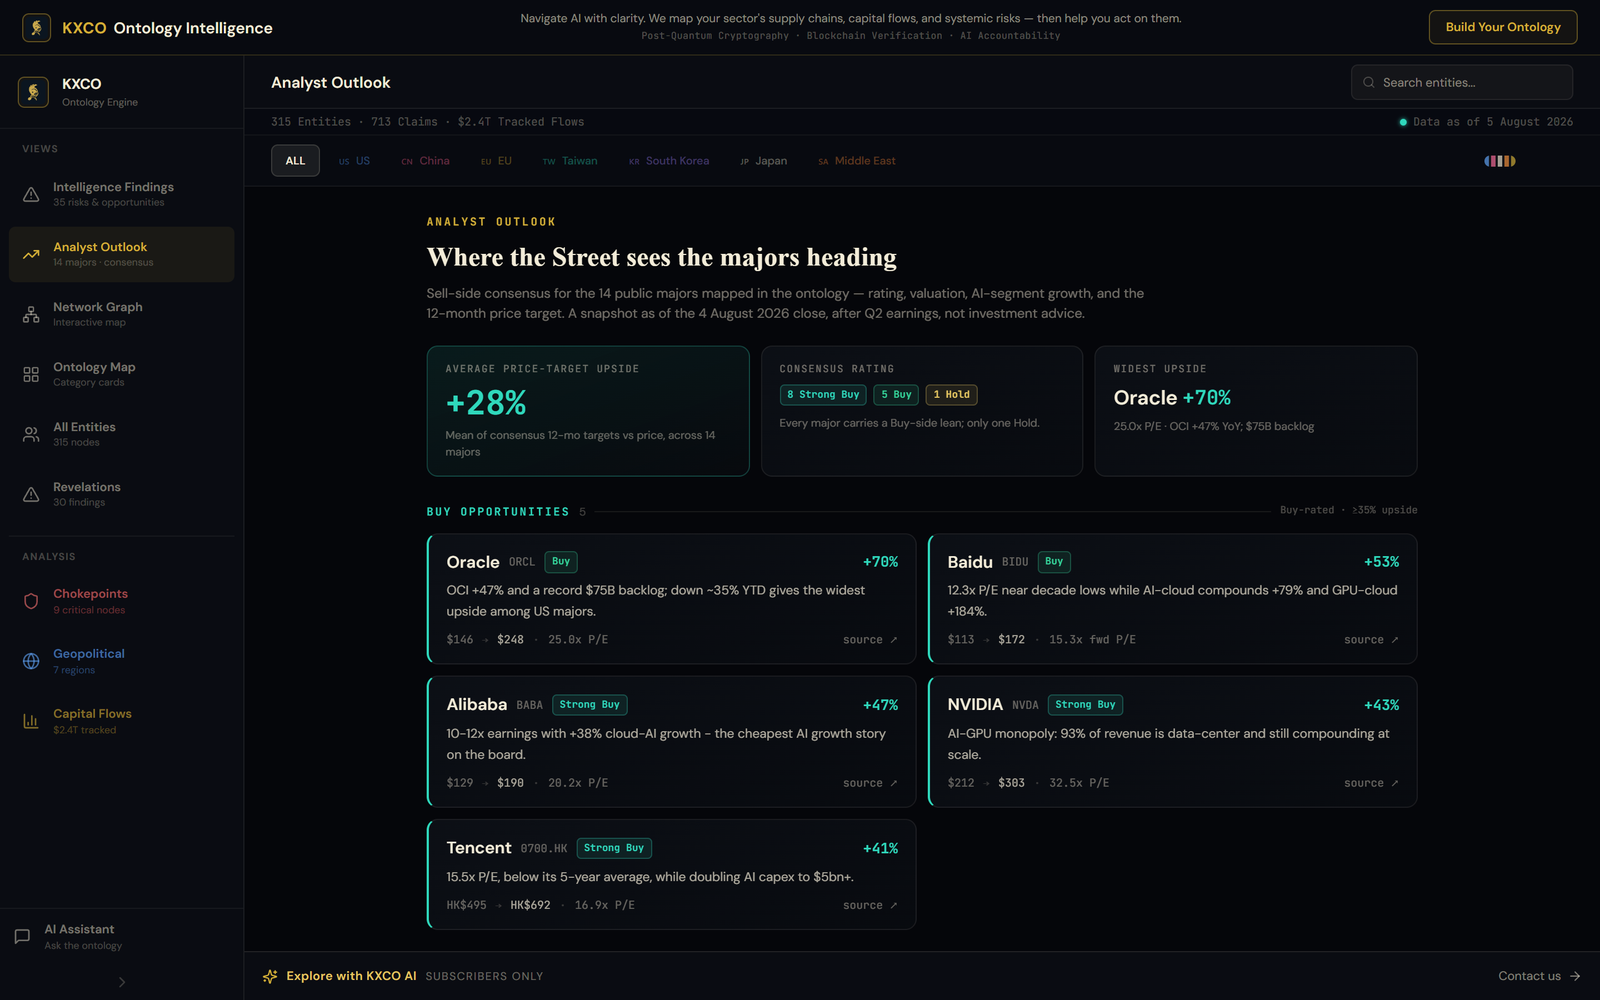
One view will be immediately familiar to readers of this site. Analyst Outlook carries sell-side consensus for the 14 public majors that appear in the graph, stamped to the 4 August 2026 close, after Q2 earnings. It is a snapshot, not a recommendation, and it is useful precisely because it sits next to the structural map rather than apart from it.
Ticker | Company | Price | Market cap | P/E | Rating | 12-month target | Implied |
|---|---|---|---|---|---|---|---|
ASML | ASML Holding | $1,712 | $651B | 53.7x | Strong Buy | $2,126 | +24% |
NVDA | NVIDIA | $212 | $5.13T | 32.5x | Strong Buy | $303 | +43% |
ORCL | Oracle | $146 | $420B | 25.0x | Buy | $248 | +70% |
PLTR | Palantir | $163 | $391B | 139x | Buy | $189 | +16% |
MSFT | Microsoft | $493 | $3.66T | 27.5x | Strong Buy | $563 | +14% |
AMZN | Amazon | $277 | $2.99T | 22.3x | Strong Buy | $323 | +17% |
GOOGL | Alphabet | $378 | $4.62T | 19.0x | Strong Buy | $428 | +13% |
META | Meta | $588 | $1.50T | 22.2x | Strong Buy | $757 | +29% |
INTC | Intel | $101 | $509B | Loss | Hold | $115 | +14% |
AAPL | Apple | $309 | $4.52T | 35.5x | Buy | $323 | +4% |
ARM | Arm Holdings | $281 | $300B | 286x | Buy | $287 | +2% |
BABA | Alibaba | $129 | $294B | 20.2x | Strong Buy | $190 | +47% |
BIDU | Baidu | $113 | $38B | 15.3x fwd | Buy | $172 | +53% |
0700.HK | Tencent | HK$495 | $562B | 16.9x | Strong Buy | HK$692 | +41% |
The aggregate reads +28% average implied upside across the 14, with eight Strong Buy, five Buy and one Hold. Read against the findings, the interesting part is not the direction. It is that the two names with the most structural protection in the graph, ASML and NVDA, are also the two the map identifies as the sector's tightest single points of failure. Concentration is both the moat and the risk, and the same graph shows you both sides of it.
What the record actually looks like
I want to be precise here, because this is where write-ups of tools like this usually overreach.
The ontology is an instrument, not an oracle. It does not make price calls and it does not claim to. What it has done consistently is keep structural theses visible while narrative attention moved elsewhere, and several of those theses have since been validated by events rather than by opinion.
Upstream concentration. Lithography, EDA and high-bandwidth memory were mapped as non-substitutable chokepoints well before the last week of July 2026, when the memory tier repriced by hundreds of billions in days. The map did not invent the scarcity. It organised the scarcity into a dependency graph, which made the implication hard to avoid.
Energy as a binding constraint. Power was treated as a first-order constraint rather than a footnote, and the subsequent run of multi-gigawatt campus announcements and the premium now attached to sites with secured long-term power has borne that out.
Japan as a diversification destination. The map argued that capital seeking reduced single-point exposure has a limited set of realistic destinations and that Japan is the most institutionally coherent of them. Government support and private interest in Japanese semiconductor, materials and robotics names have moved in that direction since.
Political and contract edges. Continuous, sourced visibility of ownership and contract edges in the defence-AI stack is something traditional financial data vendors still handle awkwardly. On 5 August 2026 lawmakers called for a Pentagon probe into part of the same set of relationships the map had already drawn.
That is a record of structural clarity, not of forecasting. It is the more durable of the two.
What the full system adds
KXCO has not published internal metrics for the in-house version, and I am not going to invent any. What the company does say is that the public map is the smallest of the ontologies it runs, which implies parallel and nested graphs across additional sectors, deeper claim history, licensed and private data where contracts permit, and continuous rather than snapshot refresh. The query surface inside the firm includes counterfactual and scenario questions the public interface deliberately withholds.
The primitives underneath both versions are the same, and they are the part I find most interesting as a technologist rather than an investor. Post-quantum cryptography, blockchain verification and AI accountability sit underneath every claim, which means provenance survives the transition from classical to post-quantum threat models. For a knowledge graph intended to stay authoritative for years, being able to prove that a claim was true at a given time and has not been silently altered since is foundational rather than decorative.
The public page is the proof of work for all of that. It demonstrates that the method scales, that provenance is maintained, and that the output is actionable rather than merely interesting. Institutions evaluating a custom sector twin can look at the live map and judge the engine on evidence.
Three ways to use it this week
Run a concentration audit. Before adding to any AI-related position, find the name on the map and look at where it sits. A company downstream of several critical chokepoints carries a different risk profile from one sitting at a chokepoint itself. Portfolio models that ignore dependency concentration systematically understate exposure. The AI stocks hub on this site is the natural companion.
Use the opportunity set as a screen. Lithography, advanced memory, power, materials, Japanese sovereignty plays and verification layers are the current high-signal clusters. That is a filter for where to do fundamental work, not a buy list.
Watch the political and capital-flow edges. When a new federal award, large equity investment or credit facility appears, the question becomes whether it reinforces or alters an edge already on the map. That is faster than rediscovering the same relationships every time a headline lands. The same applies to the quantum computing hub, where the map tracks the split into two national stacks.
The window and the room behind it
The public ontology is an intentionally limited view, and KXCO has been straightforward about that from the start. What is striking is how much high-quality structure still comes through it. Single points of failure, circular capital, political and contract overlaps, upstream value migration and geographic diversification are all visible, all sourced, and all ranked.
Treat it as a continuously updated structural map rather than a static report. Open the claims. Check them against their sources, which is the whole reason they are there. Then remember that this is the smallest of the systems running behind it.
The demonstration is open at kxco.ai/ontology-live. The engine behind it is at kxco.ai/ontology.
Questions readers are asking
Is the public ontology free? Yes. All six views, the regional filters and every source link are open. The natural-language assistant and the deeper query surface are for KXCO AI subscribers.
How current is the data? The page carries a visible as-of stamp, currently 5 August 2026, and individual claims carry their own dates and validity windows so superseded facts are replaced rather than edited away.
Does the ontology give investment advice? No, and neither does this article. It maps entities, claims and dependencies. What you do with the map is your decision.
Can a firm get its own? Yes. Custom sector and enterprise ontologies are what the public map is a demonstration of. The contact route is on kxco.ai.
Disclosure: Live Trading News and KXCO are part of the same group. This piece covers a KXCO product, and readers should weigh it accordingly. All figures are drawn from the live public demonstration as of the 5 August 2026 snapshot. Nothing here is investment advice.
KXCO is Enhanced Intelligence, Not Artificial
I never wanted artificial intelligence. I wanted enhanced intelligence, and they are not the same product. Artificial means the machine does the thinking and hands you the answer. Enhanced means I do the thinking, with more of my own mind in the room than I have ever had at one time. Forty years of reading, recallable in the second I need it. Patterns across law, credit, physics and markets that no specialist sees, because the useful ones sit between the fields rather than inside them.
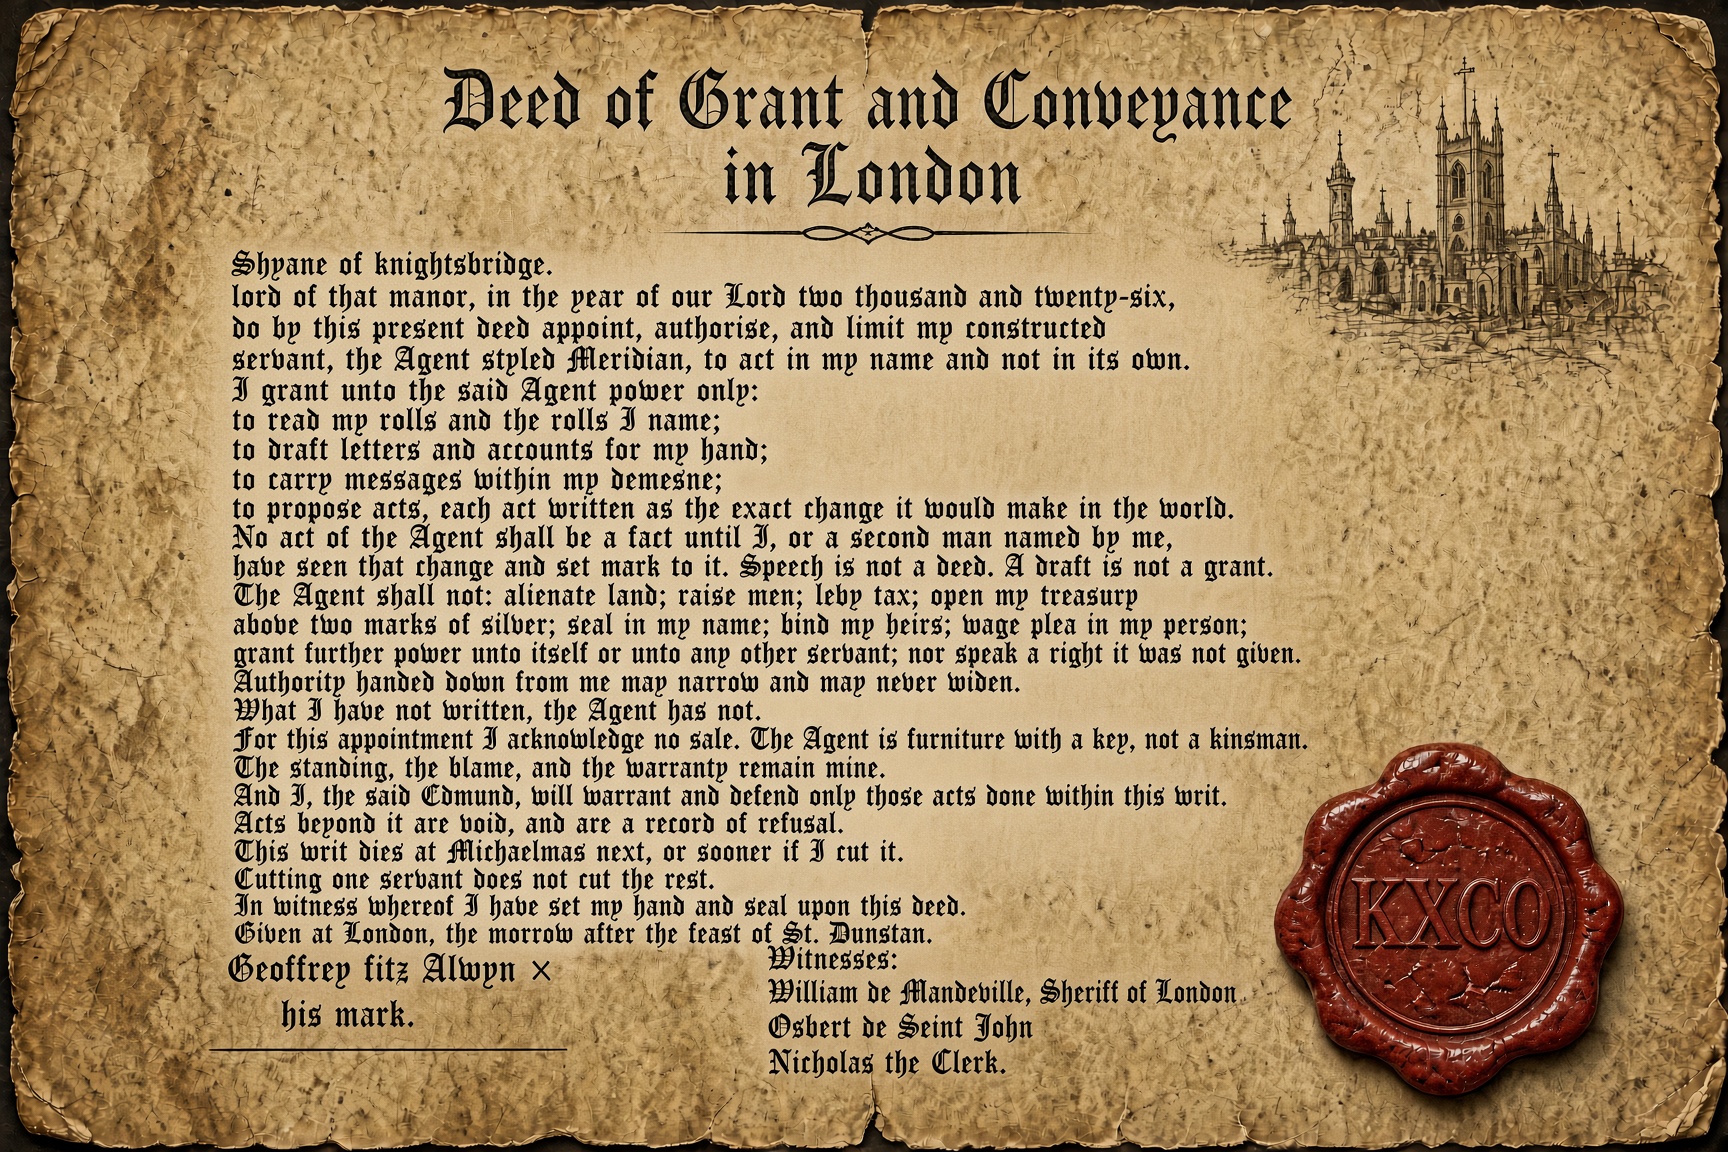
Your AI Agent and the Law: Who Acted, By What Right, and What You Can Prove
Your agent already acts in a legal system that was built for people. No new statute is needed for a payment it releases to be an act of your institution. Twelve months later a court asks who acted, by what right, and what can be reconstructed, and an export from a product you do not own is not a file. KXCO writes the act quantum-signed, time-stamped and marked on chain before the dispute. Knightsbridge Law sits on every Round Table ontology, so counsel is at the table before the act.
The AI Safety Argument Is Being Held in the Wrong Room
The people who will be blamed for what AI does are not in the room where its safety is argued. A jailbreak escapes a policy. The failure that costs money is an action that escapes an owner, a payment sent or a record altered. Tokens are not authority. Intelligence got cheap and judgment did not, and there is no organ of standing you can copy into a model. Shayne Heffernan on the objection worth taking seriously, and the questions to take into a vendor meeting.
Quantum Is Accelerating
Quantum is accelerating. Not toward a machine that breaks RSA next quarter, which is still five orders of magnitude away on the first honest cross-platform yardstick the field has ever had, but toward foundries, clouds, logical qubits and government deadlines that are already fixed. Two clocks are running. Only one of them is slow, and it is not the one that decides what a bank, a court or a ministry has to do this year.
Every story, signed and delivered.
Subscribe to the kxco channel and get the headline, the AI-written key takeaways, and the chain-anchor link the moment we publish. Audio versions and per-ticker subscriptions arrive in the next iteration.