
How to use the RSI to your advantage trading Bitcoin
The Relative Strength Index (RSI) is a widely used technical indicator that helps traders and investors analyze the internal strength of Bitcoin. Developed by Welles Wilder, the RSI oscillates between 0 and 100, providing insights into whether an asset is overbought or oversold.
The RSI is calculated through a step-by-step process as follows:
Calculate Price Changes: The RSI looks at the price changes of Bitcoin over a specific period, typically 14 days, but other periods like 9 days or 25 days can be used as well.
Calculate the Average Gain and Average Loss: For each period, the RSI calculates the average gains (positive price changes) and average losses (negative price changes).
Calculate Relative Strength (RS): The RS is the ratio of the average gain to the average loss. It is calculated as follows: RS = (Average Gain / Average Loss).
Calculate RSI: Finally, the RSI is derived using the RS value in the following formula: RSI = 100 - (100 / (1 + RS)).
Interpreting the RSI:
An RSI above 70 indicates that Bitcoin is overbought, suggesting a potential upcoming price correction or pullback.
An RSI below 30 indicates that Bitcoin is oversold, which might signal a potential upward price reversal or bounce.
Traders often look for specific patterns and signals in the RSI to make informed decisions.
Common uses of the RSI in analyzing Bitcoin charts include:
Tops and Bottoms: Traders watch for RSI values topping above 70 and bottoming below 30, which may precede corresponding price movements and potential trend reversals.
Chart Formations: The RSI can form chart patterns like head and shoulders or triangles, offering additional insights beyond the price chart.
Failure Swings: A failure swing occurs when the RSI surpasses a previous high or falls below a recent low, indicating potential support or resistance breakouts.
Support and Resistance: The RSI can highlight levels of support and resistance, sometimes more clearly than price movements themselves.
Divergences: Divergences between Bitcoin's price and the RSI can indicate potential corrections or trend reversals.
As traders often experiment with different time periods for calculating the RSI, they can adjust the indicator's sensitivity to suit their trading strategies and timeframes better. Overall, the RSI is a valuable tool for assessing the momentum and potential future movements of Bitcoin's price, aiding traders in making more informed decisions in the market.
For more detailed information join the XT Knights trading here https://bit.ly/KnightsXT and message https://t.me/XTknights on telegram to join the informed trading group.

Economic Calendar and Trading Strategies for the Week Ahead: July 20–24, 2026
A pivotal week for markets: Iran's closure of the Strait of Hormuz sends crude above $86 and gasoline over $5, while Alphabet, Tesla and Intel earnings test the AI trade. Full economic calendar plus trading strategies across oil, gold, Bitcoin, FX and AI chip stocks.
Economic Calendar and Trading Strategies for the Week Ahead: July 14–18, 2026
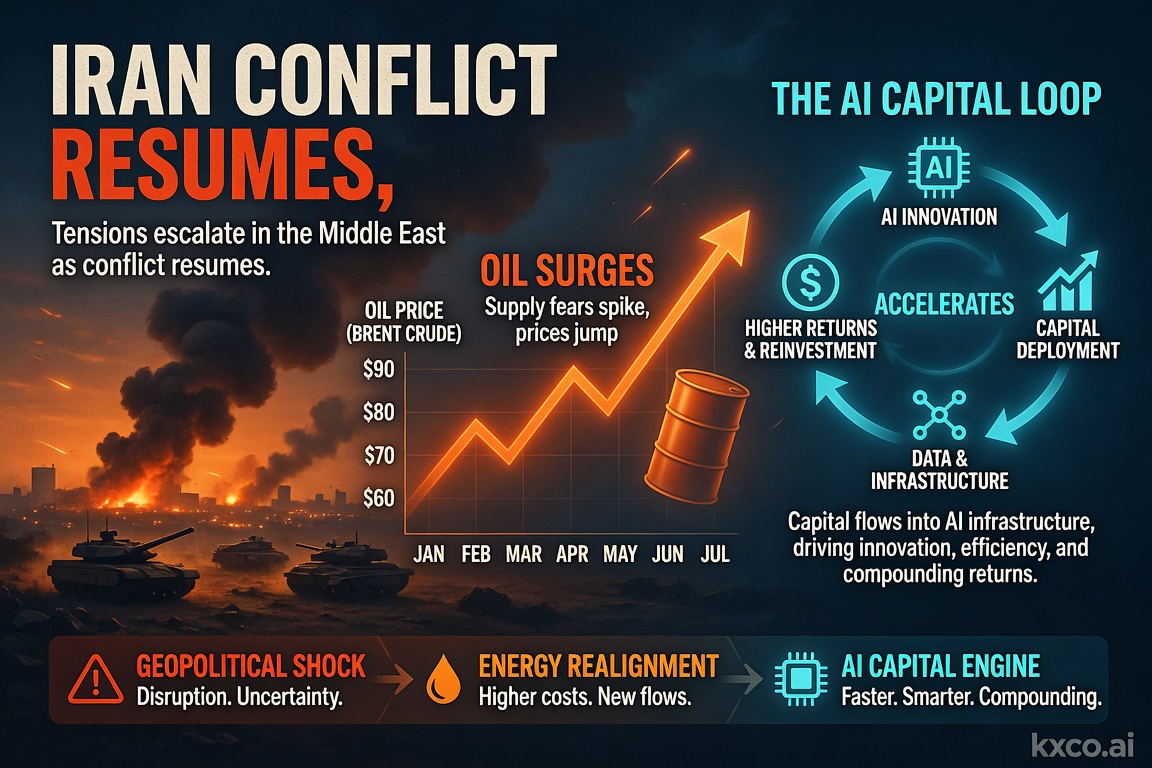
A pivotal week for markets: US strikes on Iran reignite the oil risk premium, June CPI and retail sales test the Fed's rate-cut path, and the $1 trillion AI capital loop keeps driving the tech trade. Full economic calendar plus trading strategies across oil, gold, Bitcoin, FX and AI stocks.

Quantum Computing Just Became an Institutional Risk
Shayne Heffernan on BlackRock's quantum-computing warning for Bitcoin and Ethereum, Google's cryptanalysis research, the two on-chain risk vectors, and how KXCO's Armature L1 — post-quantum from genesis, coordinated by its ontology — answers a threat that just went institutional.

Economic Calendar and Trading Strategies for July 7–11, 2026
A trader's guide to the week of July 7–11, 2026: the US and China economic calendar, the Fed-pivot test after a soft jobs report, and how to trade Nvidia, SpaceX, Bitcoin, the dollar, gold, silver, AI and quantum. Track every release on Live Trading News.
Every story, signed and delivered.
Subscribe to the kxco channel and get the headline, the AI-written key takeaways, and the chain-anchor link the moment we publish. Audio versions and per-ticker subscriptions arrive in the next iteration.