
Economic Calendar and Trading Strategies for the Week Ahead: July 14–18, 2026
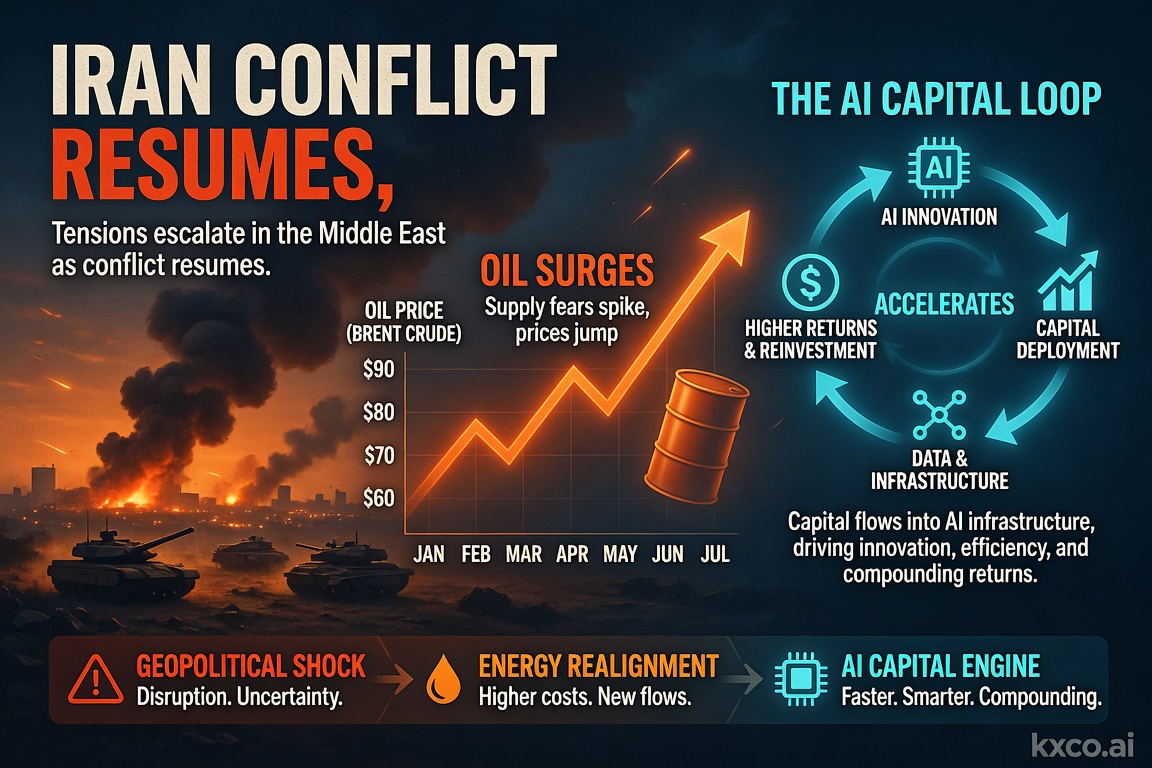
Iran Conflict Resumes, Oil Surges, and the AI Capital Loop Accelerates
The Week at a Glance: Geopolitics, Inflation Data, and the AI Capital Loop
Markets enter the week of July 14–18, 2026, grappling with a potent cocktail of geopolitical risk, crucial macroeconomic data releases, and a technology sector that continues to defy gravity. The resumption of hostilities between the United States and Iran has shattered the fragile ceasefire that briefly restored calm to global energy markets, sending crude oil prices sharply higher and injecting a fresh wave of risk aversion across equities, currencies, and safe-haven assets. Against this backdrop, traders and investors face a pivotal week in which US Consumer Price Index data, retail sales figures, and a parade of Federal Reserve speakers will determine whether the dollar can extend its recent strength and whether the Fed's rate-cut trajectory remains intact.
The Iran conflict is the single most important variable this week. After US strikes on Iranian targets reignited tensions that had only just begun to subside, oil prices surged above $77 per barrel on Brent before pulling back slightly as traders assessed the scope of the escalation. The Strait of Hormuz, through which approximately 20% of the world's daily oil supply transits, remains the focal point of risk. Any disruption to shipping through this critical chokepoint would send shockwaves through every asset class, from energy stocks and the dollar to gold and Bitcoin. For traders, the playbook is clear: sell the rallies in oil and buy the dips in safe-haven assets, particularly gold and Bitcoin, which have demonstrated remarkable resilience in the face of geopolitical turmoil.
Meanwhile, the artificial intelligence sector continues to command an outsized share of global capital flows. The KXCO AI Sector Ontology, which maps the entire AI supply chain from lithography equipment through to end-user applications, tracks over $973 billion in capital flows across 81 entities spanning the United States, China, Taiwan, South Korea, and Japan. The ontology reveals a striking pattern: the AI capital loop, in which investors fund labs that spend those funds right back on the cloud and chip infrastructure owned by the same investors, is now circulating an estimated $1 trillion. Understanding this loop is essential for any trader looking to position for the next leg of the AI trade. You can explore the full ontology live at kxco.ai/ontology-live.
Track every economic release this week on the Live Trading News Economic Calendar.
Economic Calendar: July 14–18, 2026
The economic calendar this week is front-loaded with high-impact US data that will shape market expectations for Federal Reserve policy through the summer and into the autumn. Monday is quiet on the data front, serving as a positioning day ahead of the CPI release. The real fireworks begin on Tuesday with the June Consumer Price Index, the single most important inflation report of the month. Consensus forecasts point to a headline CPI print of 0.3% month-over-month and a year-over-year rate that continues to decelerate. The core CPI, which excludes food and energy, is expected to come in at 2.9% year-over-year and 0.3% month-over-month. Any deviation from these estimates, particularly on the upside, would rattle markets by raising questions about the pace and magnitude of future Fed rate cuts.
Wednesday brings the Producer Price Index, which often provides an early indication of pipeline inflation pressures that may eventually feed into consumer prices. A higher-than-expected PPI reading would compound any CPI-related concerns and could push Treasury yields higher, strengthening the dollar at the expense of risk assets. Also on Wednesday, the Federal Reserve will release its latest Beige Book, offering qualitative insights into regional economic conditions across the twelve Fed districts. This anecdotal evidence often provides color that raw data cannot, and traders will be watching for any mention of pricing pressures in the services sector, which has been the most persistent source of sticky inflation.
Thursday is the busiest day of the week, headlined by June retail sales data. Consumer spending accounts for roughly 70% of US GDP, making this report a critical barometer of economic momentum. A strong print would suggest the US economy remains on solid footing, potentially reducing the urgency for the Fed to cut rates. Conversely, a weak number would reinforce the narrative of a slowing economy and could bolster the case for more aggressive easing. Also on Thursday, weekly initial jobless claims will provide a real-time pulse check on the labor market, and several Federal Reserve officials are scheduled to speak, including regional bank presidents whose comments often move markets.
Friday rounds out the week with the preliminary University of Michigan Consumer Sentiment Index for July. This survey captures Americans' views on their personal finances, the broader economy, and inflation expectations. The one-year inflation expectations component is particularly closely watched by the Fed as an indicator of whether inflation psychology is becoming entrenched. A rise in inflation expectations would be a yellow flag for policymakers and could weigh on both equities and bonds.
Date | Event | Forecast | Previous | Impact |
|---|---|---|---|---|
Mon Jul 14 | No major releases | — | — | Low |
Tue Jul 15 | US CPI (YoY) | 2.8% | 2.9% | High |
Tue Jul 15 | US Core CPI (MoM) | 0.3% | 0.2% | High |
Wed Jul 16 | US PPI (MoM) | 0.2% | 0.1% | Medium |
Wed Jul 16 | Fed Beige Book | — | — | Medium |
Thu Jul 17 | US Retail Sales (MoM) | 0.3% | 0.1% | High |
Thu Jul 17 | Jobless Claims | 235K | 238K | Medium |
Thu Jul 17 | Fed Speakers (Multiple) | — | — | Medium |
Fri Jul 18 | UoM Consumer Sentiment | 65.5 | 64.8 | Medium |
Fri Jul 18 | 1-Yr Inflation Expectations | 3.1% | 3.0% | Medium |
Beyond the headline numbers, traders should pay close attention to the core services CPI component, which excludes both food and energy and is considered by the Fed to be the best measure of underlying inflation pressure. The shelter component, which includes rents and owners' equivalent rent, has been the primary driver of elevated core inflation throughout 2025 and into early 2026. Any moderation in shelter costs would be a bullish signal for both equities and bonds, as it would suggest that the Fed's patient approach to rate cuts is bearing fruit. Conversely, a re-acceleration in shelter inflation would raise fears that the last mile of disinflation could be the most painful, delaying the timeline for meaningful rate relief. Traders should also monitor the minutes from the most recent FOMC meeting, which will be scoured for any shift in the committee's collective assessment of the inflation outlook.
International data releases this week include Chinese GDP figures for the second quarter, which will provide insight into whether the mainland's post-stimulus recovery is gaining traction or stalling. European industrial production data and UK employment figures round out the global calendar. For traders focused on emerging markets, Indian wholesale price inflation and Brazilian central bank minutes will be closely watched for signals of diverging monetary policy paths in the developing world. The interconnected nature of these data points means that surprises in one region can quickly cascade across global asset classes, making this a week that demands constant vigilance and well-hedged positions.
For the complete interactive economic calendar with real-time updates, visit the Live Trading News Trading Hub.
The Iran Conflict: What the Resumption of Hostilities Means for Markets
The resumption of military hostilities between the United States and Iran marks a dangerous escalation in a conflict that had appeared to be de-escalating just weeks ago. US strikes on Iranian targets have shattered a fragile ceasefire, and oil markets have responded with characteristic volatility. Brent crude, the international benchmark, surged as much as 8% from its pre-escalation levels, briefly touching $77 per barrel before some profit-taking set in. WTI crude followed a similar trajectory, trading above $72 per barrel. The question now is not whether oil will remain volatile, but how high it can go and how long the risk premium persists.
The Strait of Hormuz is the single most critical geographic chokepoint in global energy markets. Approximately 20 million barrels of crude oil transit the strait each day, representing roughly 20% of global daily oil consumption. Any sustained disruption to shipping through this narrow waterway would be catastrophic for energy supplies and would send oil prices into triple-digit territory. Even the perception of elevated risk is enough to keep a significant geopolitical risk premium baked into crude prices. Insurance rates for tankers transiting the region have already spiked, and several major shipping companies have rerouted vessels around the Cape of Good Hope, adding weeks to journey times and effectively removing tonnage from the market.
The macroeconomic implications of higher oil prices are deeply concerning for central bankers and investors alike. An oil price shock acts as a tax on consumers, reducing disposable income and dampening consumer spending, which is the primary engine of economic growth in most developed economies. For the Federal Reserve, an oil-driven pickup in headline inflation creates a policy dilemma: does the central bank look through a supply-side shock and continue cutting rates to support growth, or does it hold rates steady to prevent inflation expectations from re-anchoring at higher levels? The balance of probabilities suggests the Fed will look through a temporary oil shock, but a prolonged conflict that keeps energy prices elevated for months would test that resolve.
The impact on energy stocks is nuanced. While integrated oil majors like ExxonMobil and Chevron benefit from higher crude prices in the short term, the broader market selloff that typically accompanies geopolitical shocks often drags energy equities lower despite the favorable commodity price environment. Refiners, however, face a more complex picture: higher crude input costs squeeze refining margins unless product prices rise in lockstep, which is not always the case when demand destruction becomes a concern. Natural gas prices, which have been trading in a relatively tight range, could also see spillover volatility if the conflict disrupts liquefied natural gas shipments from Qatar and the broader Persian Gulf region. Traders with exposure to energy equities should consider hedging with put options on the XLE ETF or taking partial profits on upstream names that have rallied on the oil spike.
The broader commodity complex is also feeling the effects of the Iran escalation. Industrial metals including copper and aluminum have come under pressure as the risk-off sentiment weighs on demand expectations, while agricultural commodities have been more mixed, with wheat and corn finding some support from supply disruption concerns in the Middle East and Black Sea regions. The commodity currency block, comprising the Australian dollar, Canadian dollar, and Norwegian krone, is caught between the supportive impact of higher energy prices and the depressive effect of global growth fears. This tension is likely to persist until the geopolitical situation clarifies, making these currencies difficult to trade with conviction in either direction.
Trading Strategy — Oil: Sell the Rallies. The playbook for oil is straightforward but requires discipline. Oil prices are driven by fear and speculation in the early stages of a geopolitical conflict, and the initial surge rarely holds. Traders should look to establish short positions or buy put options on oil ETFs such as USO or Brent futures on any move above $80 per barrel. Take-profit targets should be set in the $68–72 range, where pre-conflict support levels existed. Stop-losses above $85 provide a reasonable buffer against further escalation. The key risk is a full-scale closure of the Strait of Hormuz, which would invalidate the bearish thesis and send prices to $120 or higher. Position sizing should reflect this tail risk.
Bitcoin and Gold: Buy the Dips in the Ultimate Safe-Haven Duo
Bitcoin has been grinding higher through July, reclaiming the $64,000 level and building a constructive base that suggests further upside is likely. After a period of consolidation in the $60,000–63,000 range, whale accumulation has been evident on-chain, and the price has responded by climbing back inside a $62,360 to $64,467 trading band. The macroeconomic environment is increasingly supportive of Bitcoin: geopolitical risk from the Iran conflict, a Federal Reserve that is widely expected to continue cutting rates, and growing institutional adoption through spot ETFs and sovereign wealth fund allocations are all tailwinds. The medium-term target for Bitcoin remains $68,000–$70,000, with some analysts projecting a move toward $86,000 by year-end if the global liquidity environment continues to improve.
Gold has been the standout performer of 2026, surging above $4,100 per ounce and showing no signs of fatigue. The yellow metal is benefiting from the same macro forces that support Bitcoin, but with the added catalyst of central bank buying, particularly from China, India, and Middle Eastern sovereign wealth funds. Central banks globally added over 1,000 tonnes of gold to their reserves in 2025, and the pace of accumulation has accelerated in the first half of 2026. The Polymarket prediction market currently assigns a 39% probability to gold hitting $4,300 in July, which would represent a new all-time high. The fundamental case for gold remains compelling: it is a hedge against currency debasement, geopolitical instability, and the erosion of real yields in a falling-rate environment.
Trading Strategy — Bitcoin: Buy the Dips. The strategy for Bitcoin is to accumulate on any pullback toward the $60,000–$62,000 zone, which has served as strong support. Scale in with one-third of your intended position at $62,000, another third at $60,000, and hold the final third in reserve for a deeper pullback toward $58,000, which would represent an exceptional buying opportunity. The upside target is $68,000 in the near term and $80,000+ if the Iran conflict escalates significantly. Risk management is critical: place stop-losses below $56,000 to protect against a breakdown of the current base.
The relationship between Bitcoin and gold is evolving in ways that challenge traditional portfolio construction. Historically, these two assets were seen as competitors for safe-haven capital, but the data increasingly shows they are complementary. Gold provides stability and a proven track record during systemic crises, while Bitcoin offers asymmetric upside driven by technological adoption and a finite supply that cannot be debased by any government. Institutional investors are increasingly allocating to both assets simultaneously, viewing them as complementary pillars of a modern safe-haven allocation. The combined market capitalization of gold (approximately $16 trillion) and Bitcoin (approximately $1.3 trillion) represents a significant and growing share of global investable assets, and the trend toward greater allocation is accelerating as sovereign wealth funds and pension funds formalize their digital asset strategies.
Trading Strategy — Gold: Buy the Dips. Gold corrections have been shallow and short-lived in 2026, reflecting strong underlying demand. Any pullback toward $3,950–$4,000 should be aggressively bought. The $4,300 level is the near-term target, and a move to $4,500 is possible if the Iran situation deteriorates or if the Fed signals more aggressive rate cuts. Physical gold, gold ETFs such as GLD or IAU, and gold mining stocks all offer exposure, with mining stocks providing leveraged upside but also greater volatility.
AI Stocks: The Capital Loop and the Stocks to Watch
The artificial intelligence sector remains the most powerful theme in global equity markets, and understanding its structure is essential for making informed investment decisions. The KXCO AI Sector Ontology provides a comprehensive, verifiable map of the entire AI value chain, from the Dutch company ASML, which manufactures the extreme ultraviolet (EUV) lithography machines that every advanced AI chip depends on, through TSMC in Taiwan, which fabricates 100% of the leading-edge silicon used by the AI cohort, to Nvidia, which designs the GPUs that dominate the training and inference of large language models. The ontology tracks 81 entities, 112 claims, and $973 billion in tracked capital flows, making it the most detailed public map of the AI sector available anywhere.
The most striking insight from the ontology is what we call the AI Capital Loop. Investors pour hundreds of billions of dollars into AI labs like OpenAI, Anthropic, and xAI. These labs then spend virtually all of that capital on cloud compute and GPU infrastructure from providers like Microsoft Azure, Amazon Web Services, Oracle, and SpaceX's Colossus supercomputer cluster. Those cloud providers, in turn, use the revenue to buy more Nvidia GPUs and invest in data center capacity. Nvidia then uses its profits to fund R&D and buy back stock, enriching the same investors who funded the labs in the first place. This loop is now circulating an estimated $1 trillion, and it is self-reinforcing: as long as investors believe in the transformative potential of AI, the loop will continue to expand, driving demand for chips, cloud services, and data center infrastructure.
For traders and investors, the key cashtags to watch in the AI space span every layer of the value chain. At the chip design layer, $NVDA (Nvidia) remains the undisputed leader, with a market capitalization exceeding $3 trillion and a dominant position in both training and inference GPUs. $AVGO (Broadcom) is the critical player in custom AI accelerators and networking chips, while $AMD offers a credible alternative with its MI300X series. In the foundry layer, $TSM (TSMC) is the single point of failure for the entire industry, fabricating all leading-edge AI silicon on its Taiwanese fabs. In memory, SK Hynix and Samsung Electronics dominate the high-bandwidth memory (HBM) market, which is essential for feeding data to AI GPUs fast enough to keep them fully utilized. At the cloud and compute layer, $MSFT (Microsoft Azure), $AMZN (Amazon Web Services), and $ORCL (Oracle) are the primary beneficiaries of AI capex spending, while $PLTR (Palantir) is emerging as a leader in enterprise AI deployment.
Among the mega-cap technology companies, $GOOGL (Alphabet/Google) and $META (Meta Platforms) are both developing their own custom AI chips and deploying large language models at scale. Google's Tensor Processing Units (TPUs) power its internal AI workloads and are available through Google Cloud, while Meta's LLaMA family of open-source models has become one of the most widely deployed AI frameworks in the world. The recent pullback in META shares, which are down approximately 18% over the past year, has created what some analysts view as a compelling entry point, with price targets suggesting 30–42% upside from current levels around $660.
SpaceX, which completed its record-breaking IPO in June 2026 with an initial valuation approaching $1.8 trillion, represents a unique convergence of AI and space infrastructure. The company's Colossus supercomputer cluster, built in partnership with Nvidia, is one of the largest AI training facilities in the world, costing an estimated $1.25 billion per month to operate. SpaceX's AI satellites are also revolutionizing global connectivity and compute distribution, creating a new paradigm for distributed AI inference. The ontology maps SpaceX at the intersection of the Compute & Cloud and Data Center categories, reflecting its dual role as both a compute provider and a data center operator.
Chinese AI companies represent the most significant competitive threat to US dominance in the sector. $BABA (Alibaba) and $TCEHY (Tencent) are investing heavily in AI through their cloud platforms, while $BIDU (Baidu) has been a pioneer in large language model development with its ERNIE series. The KXCO Ontology reveals that China has 12 critical dependencies in the AI supply chain, the most significant being its reliance on Taiwan (via TSMC) for leading-edge chip fabrication. The US export controls on advanced semiconductors, which have restricted China's access to Nvidia's most powerful chips, have forced Chinese companies to develop domestic alternatives. SMIC, China's leading foundry, is backed by an $8.2 billion National AI Fund and is racing to close the technology gap, though it remains years behind TSMC in advanced process nodes.
Explore the full AI Sector Ontology with interactive supply chain mapping at KXCO.
Cashtag | Company | AI Role | Key Catalyst |
|---|---|---|---|
Nvidia | GPU Design (Training & Inference) | GB300/Blackwell Ultra cycle, $100B HBM TAM | |
Alphabet/Google | TPUs, Gemini AI, Google Cloud | Custom silicon, $920M/mo cloud spend | |
Microsoft | Azure AI Cloud, OpenAI Partner | OpenAI ~$500B JV, Copilot enterprise | |
Amazon | AWS AI Services, Trainium Chips | $38B/7yr AWS AI capex, Anthropic stake | |
Meta Platforms | LLaMA Models, Custom AI Chips | Open-source AI leadership, 42% upside target | |
TSMC | Chip Fabrication (100% leading-edge) | AI chip demand, 2nm process ramp | |
Broadcom | Custom AI ASICs, Networking | Hyperscale custom chip wins | |
Oracle | Cloud Infrastructure, AI Apps | $500B AI infrastructure project | |
Palantir | Enterprise AI Deployment | Government & commercial AI contracts | |
Alibaba | Alibaba Cloud AI, Tongyi Qianwen | China AI leader, cloud growth | |
Tencent | Tencent Cloud, Hunyuan AI | Gaming + AI integration | |
Baidu | ERNIE LLM, Apollo Autonomous | China LLM pioneer, autonomous driving |
As I have stated before, AI is still early — the opportunity is broadening from NVIDIA and the frontier model labs into the entire infrastructure stack: power generation, data center construction, cooling systems, optical networking, and the software layer that translates raw compute into enterprise value. Traders should look for pullbacks in the highest-quality names and scale into positions over the coming weeks.
The geopolitical dimension of the AI race cannot be ignored. The KXCO Ontology maps seven regions with varying levels of exposure and dependency. The United States has 98 dependencies in the AI supply chain, most critically its total reliance on Taiwan for advanced chip fabrication and on the Netherlands for EUV lithography. China has 12 dependencies, constrained by US export controls that have restricted its access to the most advanced chips. Taiwan has 3 dependencies but occupies the most critical position in the chain, fabricating 100% of leading-edge AI silicon. Any escalation in cross-strait tensions would make the current Iran-related market volatility look mild by comparison. This geopolitical overlay is not a hypothetical risk — it is a structural feature of the AI investment landscape that every trader must factor into their positioning and risk management.
The power and infrastructure requirements of the AI buildout are another critical investment theme that is only beginning to be priced in by the market. The KXCO Ontology tracks Constellation Energy's landmark $16 billion, 20-year power purchase agreement to supply electricity to a single AI data center customer, and Talen Energy's $650 million deal to repurpose a nuclear facility for AI compute. These numbers are staggering, and they represent just the beginning. The total power consumption of AI data centers is projected to exceed the entire electricity consumption of some mid-sized countries within the next five years. Companies involved in power generation, grid infrastructure, and advanced cooling technologies represent compelling investment opportunities that are often overlooked in favor of the more glamorous chip and model companies.
FX Markets: Dollar Strength, Euro Weakness, and the Carry Trade
The US dollar has been grinding higher through July, with the dollar index (DXY) hovering near 100.94 as of July 10. The greenback is benefiting from a combination of relative economic strength, higher Treasury yields compared to European and Japanese bonds, and safe-haven demand driven by the Iran conflict. The EUR/USD pair has fallen to 1.1411, and J.P. Morgan's Global Research team sees the pair trading in a 1.13–1.15 range over the next three quarters, down from their previous target. The euro is under pressure from sluggish Eurozone growth, a dovish European Central Bank that has already begun cutting rates, and the political uncertainty that continues to grip several member states.
The dollar's trajectory this week will be heavily influenced by the CPI and retail sales data. A hotter-than-expected CPI print would push Treasury yields higher and reinforce dollar strength, potentially driving EUR/USD toward the 1.13 level. Conversely, a soft inflation number that reinforces the Fed's easing bias could trigger a dollar pullback and provide relief for euro bulls. The GBP/USD pair faces similar dynamics, with the Bank of England navigating its own inflation challenge against a backdrop of slowing UK growth. The yen remains the weakest major currency, with USD/JPY elevated as the Bank of Japan maintains its ultra-accommodative stance, though verbal intervention from Japanese officials continues to cap upside momentum.
For forex traders, the dominant theme is dollar strength against the majors, with the exception of commodity-linked currencies like the Australian and Canadian dollars, which are finding support from higher oil and metal prices. The Iran conflict has introduced a geopolitical bid into safe-haven currencies, with the Swiss franc and Japanese yen both attracting flows despite the BoJ's dovish posture. Carry trades, in which investors borrow in low-yielding currencies like the yen and invest in higher-yielding assets, remain popular but carry significant risk in a geopolitical shock scenario where correlations break down and safe-haven flows overwhelm yield differentials.
Emerging market currencies are facing a particularly challenging environment. The combination of a strong dollar, higher oil prices, and capital outflows to safe-haven assets is pressuring currencies across Asia, Latin America, and Africa. The Indian rupee, the Indonesian rupiah, and the Turkish lira are among the most vulnerable, with central banks in these countries forced to choose between supporting their currencies through interest rate hikes or cutting rates to support domestic growth. For traders with emerging market exposure, the risk-reward favors selective short positions in the most vulnerable currencies, paired with long positions in commodity exporters like the Norwegian krone and the Brazilian real that benefit directly from higher energy prices.
The Chinese yuan deserves special attention this week. The People's Bank of China has been managing the yuan's exchange rate within a narrow band, but the dual pressures of dollar strength and potential capital outflows related to the Iran conflict could test the PBOC's resolve. A significant depreciation of the yuan would have ripple effects across Asian currency markets and could trigger competitive devaluation pressures in the region. Traders should monitor USD/CNY closely for any signs that the PBOC is allowing a more aggressive depreciation, which would be bearish for regional equities and bullish for Chinese export-oriented companies.
Pair | Current Level | Key Support | Key Resistance | Bias |
|---|---|---|---|---|
EUR/USD | 1.1411 | 1.1300 | 1.1550 | Bearish |
GBP/USD | 1.2680 | 1.2600 | 1.2800 | Neutral-Bearish |
USD/JPY | 161.50 | 159.00 | 163.50 | Bullish |
AUD/USD | 0.6730 | 0.6680 | 0.6800 | Neutral |
USD/CAD | 1.3650 | 1.3580 | 1.3750 | Bearish (oil bid) |
XAU/USD (Gold) | $4,161 | $3,950 | $4,300 | Bullish |
BTC/USD | $64,100 | $60,000 | $68,000 | Bullish |
Brent Crude | $71.41 | $68.00 | $80.00 | Volatile-Bearish |
Trading Strategy — FX: Sell EUR/USD on rallies toward 1.1500, targeting 1.1300 with a stop above 1.1600. Buy USD/JPY on dips toward 159.00, targeting 163.00 with a stop below 158.00. For commodity currencies, buy AUD/USD on dips toward 0.6680 with a target of 0.6800, as the China stimulus narrative and firmer metal prices provide underpinning. The key risk to all FX positions is the Iran conflict: a significant escalation would trigger flight-to-safety flows into the yen and Swiss franc, potentially causing sharp reversals in carry trades.
Mangoes, SpaceX, and the Space Economy: The Next Frontier of Trade
While the headlines are dominated by AI, oil, and geopolitics, an underappreciated trend is emerging in global commodity markets: the space economy. SpaceX's historic IPO in June 2026, the largest in stock market history with a valuation approaching $1.8 trillion, has brought the commercial space sector into the mainstream investment conversation. But beyond the headline-grabbing valuation, SpaceX is fundamentally reshaping global logistics, including the trade of perishable commodities like mangoes and other fresh produce.
SpaceX's Starship vehicle, designed for rapid, reusable transport of cargo and eventually passengers, has the potential to revolutionize global supply chains. While the technology is still in its early stages for commercial cargo, the vision is clear: same-day delivery of high-value perishable goods between any two points on Earth. Mangoes from India arriving in London within hours of harvest, rather than the days or weeks currently required by sea freight, would command a significant premium and open new markets for farmers in tropical regions. The implications extend far beyond mangoes to pharmaceuticals, high-end food products, and urgent industrial components.
The mango trade is more than a curiosity; it is a window into how space technology could reshape global commerce. Currently, the global mango market is worth approximately $60 billion annually, but a significant portion of the crop is lost to spoilage during transit, particularly for premium varieties shipped from South and Southeast Asia to markets in Europe, the Middle East, and North America. SpaceX's vision of point-to-point suborbital transport could reduce transit times from days to hours, dramatically reducing spoilage rates and opening new premium markets for farmers in developing countries. The economic multiplier effects would be substantial, from job creation in agricultural regions to the development of new cold-chain logistics technologies that would have applications far beyond the mango trade.
The space economy more broadly is attracting significant capital from sovereign wealth funds and venture capitalists. Saudi Arabia's Public Investment Fund (PIF), which manages a $900 billion portfolio, has been a prominent investor in space and satellite technology. The KXCO Ontology maps the space economy as an emerging category within the broader AI and technology ecosystem, recognizing that space-based compute, satellite communications, and Earth observation are increasingly integrated with AI workloads. SpaceX's AI satellites, for example, are not just communication relays; they are edge-compute nodes that can process AI inference tasks in orbit, reducing latency for applications that require real-time data processing.
For investors, the space economy remains a long-duration theme that is best accessed through established companies with credible space exposure rather than speculative startups. SpaceX, now publicly traded, is the purest play, but companies like $LMT (Lockheed Martin), $BA (Boeing), and $RTX (RTX Corporation) all have significant space-related revenue streams. The key catalyst to watch is the successful deployment of Starship for commercial cargo operations, which would validate the business model and potentially trigger a re-rating of the entire space sector. The convergence of space infrastructure and AI is a particularly exciting area: SpaceX's satellite constellation, combined with its Colossus supercomputer, creates a distributed compute network that could fundamentally change how AI inference is delivered to users around the world, reducing latency and expanding access to advanced AI capabilities in regions where terrestrial data center infrastructure is lacking.
Summary: Key Trading Strategies for the Week Ahead
The convergence of geopolitical risk, macroeconomic data, and sector-specific catalysts creates a complex but tradable environment this week. Below is a concise summary of the key strategies we are implementing across asset classes, reflecting our core thesis: buy the dips in safe-haven and growth assets, and sell the rallies in risk-sensitive commodities that are being temporarily inflated by fear. The unifying principle across all of these strategies is disciplined risk management. In a week dominated by the unpredictable evolution of the Iran conflict and potentially market-moving economic data, the most important skill a trader can possess is the ability to adapt quickly to new information without abandoning a well-conceived plan. The strategies outlined here are designed to be robust across a range of scenarios, from a rapid de-escalation of the Iran situation to a significant escalation that closes the Strait of Hormuz. Position sizes should reflect the elevated volatility environment, with wider stop-losses than normal and smaller position sizes to account for the potential for gap moves and liquidity dislocations.
Portfolio construction this week should emphasize diversification across asset classes and a bias toward quality and liquidity. The Iran conflict has the potential to cause sudden and severe dislocations in less liquid markets, making it essential to maintain positions in the most liquid instruments available. For equities, this means focusing on the mega-cap AI names with deep options markets and tight bid-ask spreads rather than small-cap AI stocks that could be impossible to exit in a crisis. For commodities, futures contracts on the major exchanges offer the best liquidity, while physical gold provides a non-correlated safe-haven that does not depend on the functioning of financial markets. For cryptocurrencies, Bitcoin on major exchanges remains the most liquid digital asset, though traders should be prepared for the possibility of exchange withdrawals or temporary platform outages during periods of extreme volatility.
Asset | Strategy | Entry Zone | Target | Stop-Loss |
|---|---|---|---|---|
Bitcoin (BTC) | Buy the Dip | $50,000–$58,000 | $68,000 | $46,000 |
Gold (XAU) | Buy the Dip | $3,950–$4,000 | $4,300 | $3,850 |
Oil (Brent) | Sell the Rally | $78–$80 | $68–$72 | $85 |
EUR/USD | Sell Rallies | 1.1480–1.1500 | 1.1300 | 1.1600 |
USD/JPY | Buy Dips | 159.00–159.50 | 163.00 | 158.00 |
Buy Dips | Support levels | Higher | Below key MA | |
Accumulate | $640–$660 | $829 (42% upside) | $600 | |
Hold/Buy | Current levels | Higher | Below $170 | |
Buy Dips | Pullback zone | $250 target | Below key support |
Risk management is paramount this week. The Iran conflict introduces a level of uncertainty that can overwhelm even the best-laid trading plans. Position sizes should reflect the elevated volatility environment, with wider stop-losses than normal and smaller position sizes to account for the potential for gap moves. Traders should also maintain adequate cash reserves to capitalize on any sharp dislocations that may arise from unexpected headlines. The old adage applies: in times of crisis, cash is king, and the ability to deploy capital decisively when others are panicking is what separates great traders from good ones.
As always, track every economic release and market-moving event in real time on the Live Trading News Economic Calendar, and use the KXCO AI Sector Ontology to stay ahead of the structural shifts in the AI value chain that will drive the next generation of investment opportunities.
Disclaimer: Trading involves substantial risk of loss. CFDs and leveraged products may not be suitable for all investors. Past performance is not indicative of future results. The views expressed in this article are those of the author and do not constitute financial advice. Always conduct your own research and consult with a qualified financial advisor before making investment decisions.

AI Is Being Powered by Tech That Looks Almost Alien
Every frontier AI model runs on chips printed by one Dutch machine. ASML's extreme-ultraviolet scanner fires a laser at up to 50,000 droplets of molten tin a second, per ASML, and bounces the light off mirrors whose deviations are tens of picometres. Veritasium called it the closest thing we have to alien technology. This piece takes the film as the brief and checks it: the machine, High-NA, and the wafer-scale chips and liquid-cooled racks downstream of it.
There Is No AI Bubble
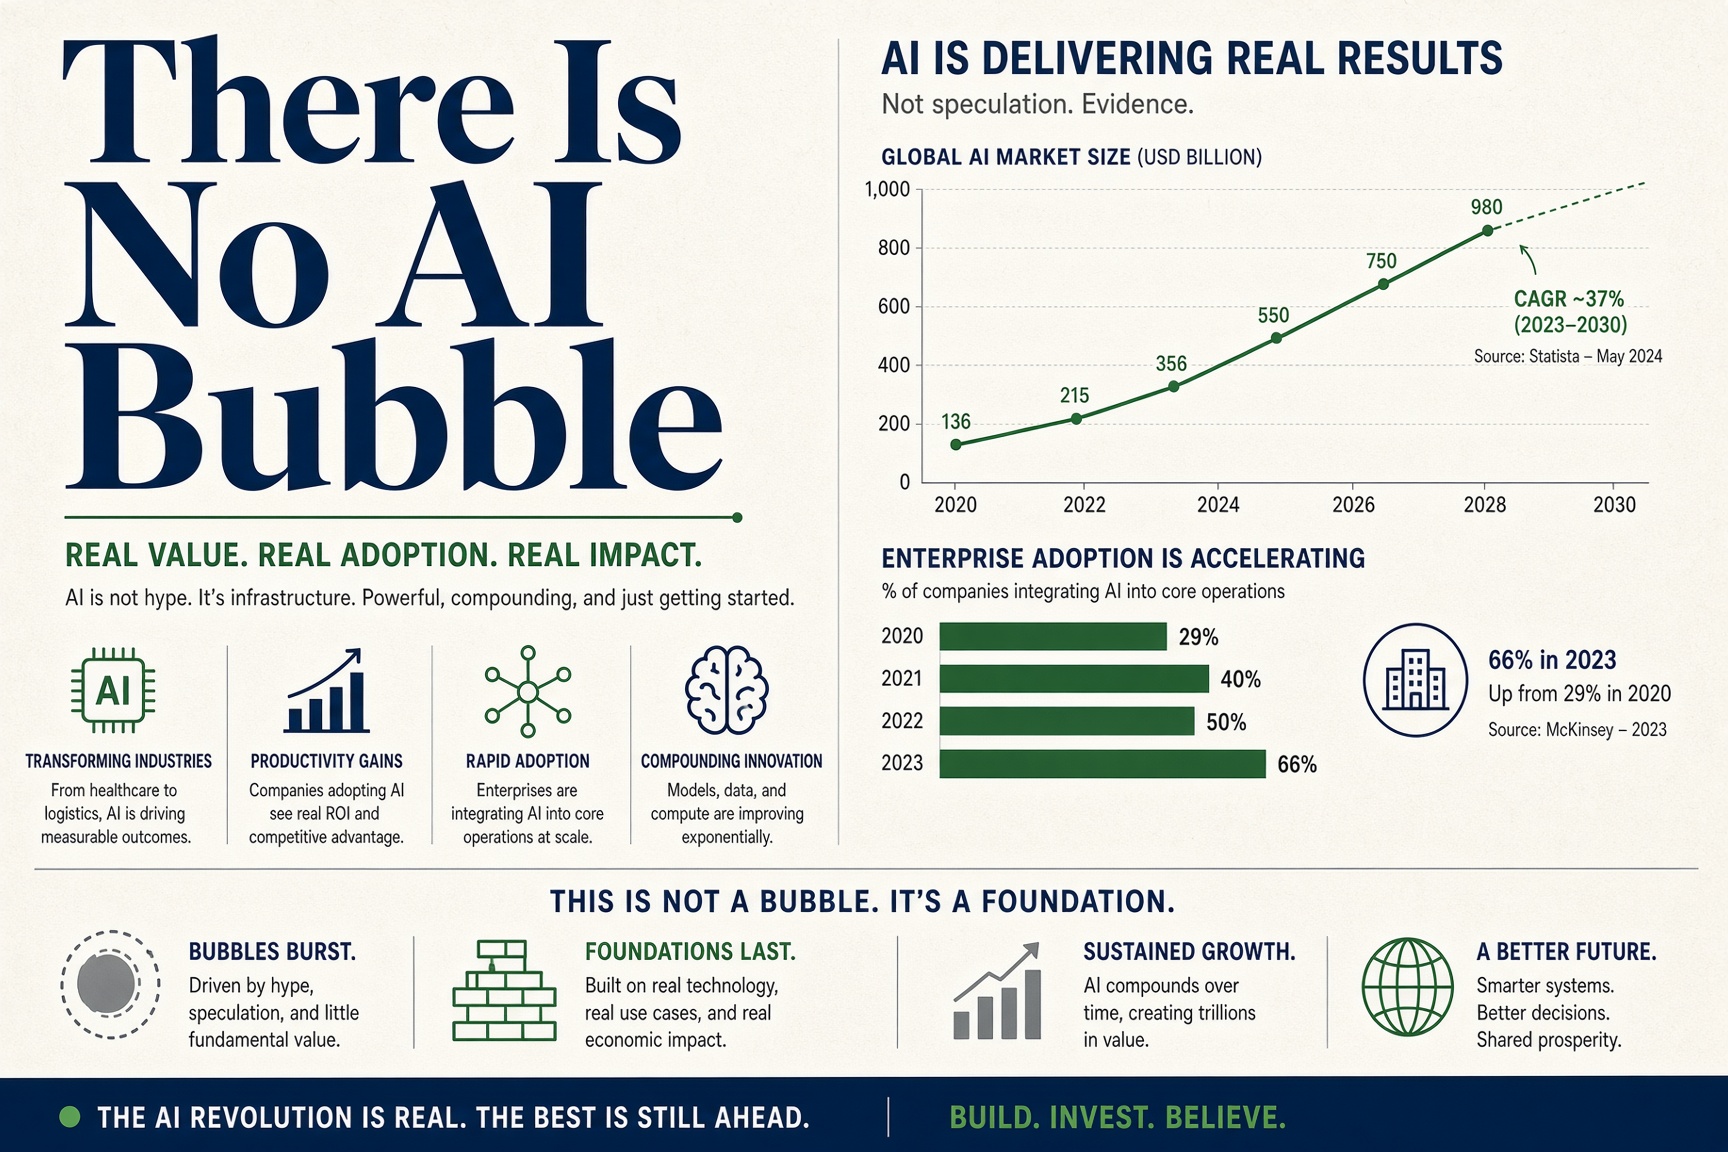
There is no AI bubble. A bubble is capacity nobody uses, demand nobody signs for and a glut when the building stops. KXCO's AI sector ontology, refreshed on 7 October 2026, finds the reverse: adoption rising on six independent measures, about $2.35tn of contracted backlog at the four largest sellers of compute per their own reports, and supply rationed at every layer. It keeps the bear case in the same record, 20 circular capital claims, and answers it.
Weekly Market Outlook: Fed Minutes, Anthropic and OpenAI IPOs, Gold, Bitcoin, FX
The Fed raised rates in September and payrolls rose 29,000, per the Labor Department. This week the FOMC minutes, three Treasury auctions and a 10-year near 5.3 percent test that gap. Anthropic's IPO clock runs toward a 14 October investor day while OpenAI's chief executive says not 2026. Gold sits 26 percent below its record, bitcoin near $85,500, the dollar up three weeks running. Two knowledge graphs from KXCO's records map the IPO backers and the FDA board.
KXCO Is the Layer Between the LLM and the World
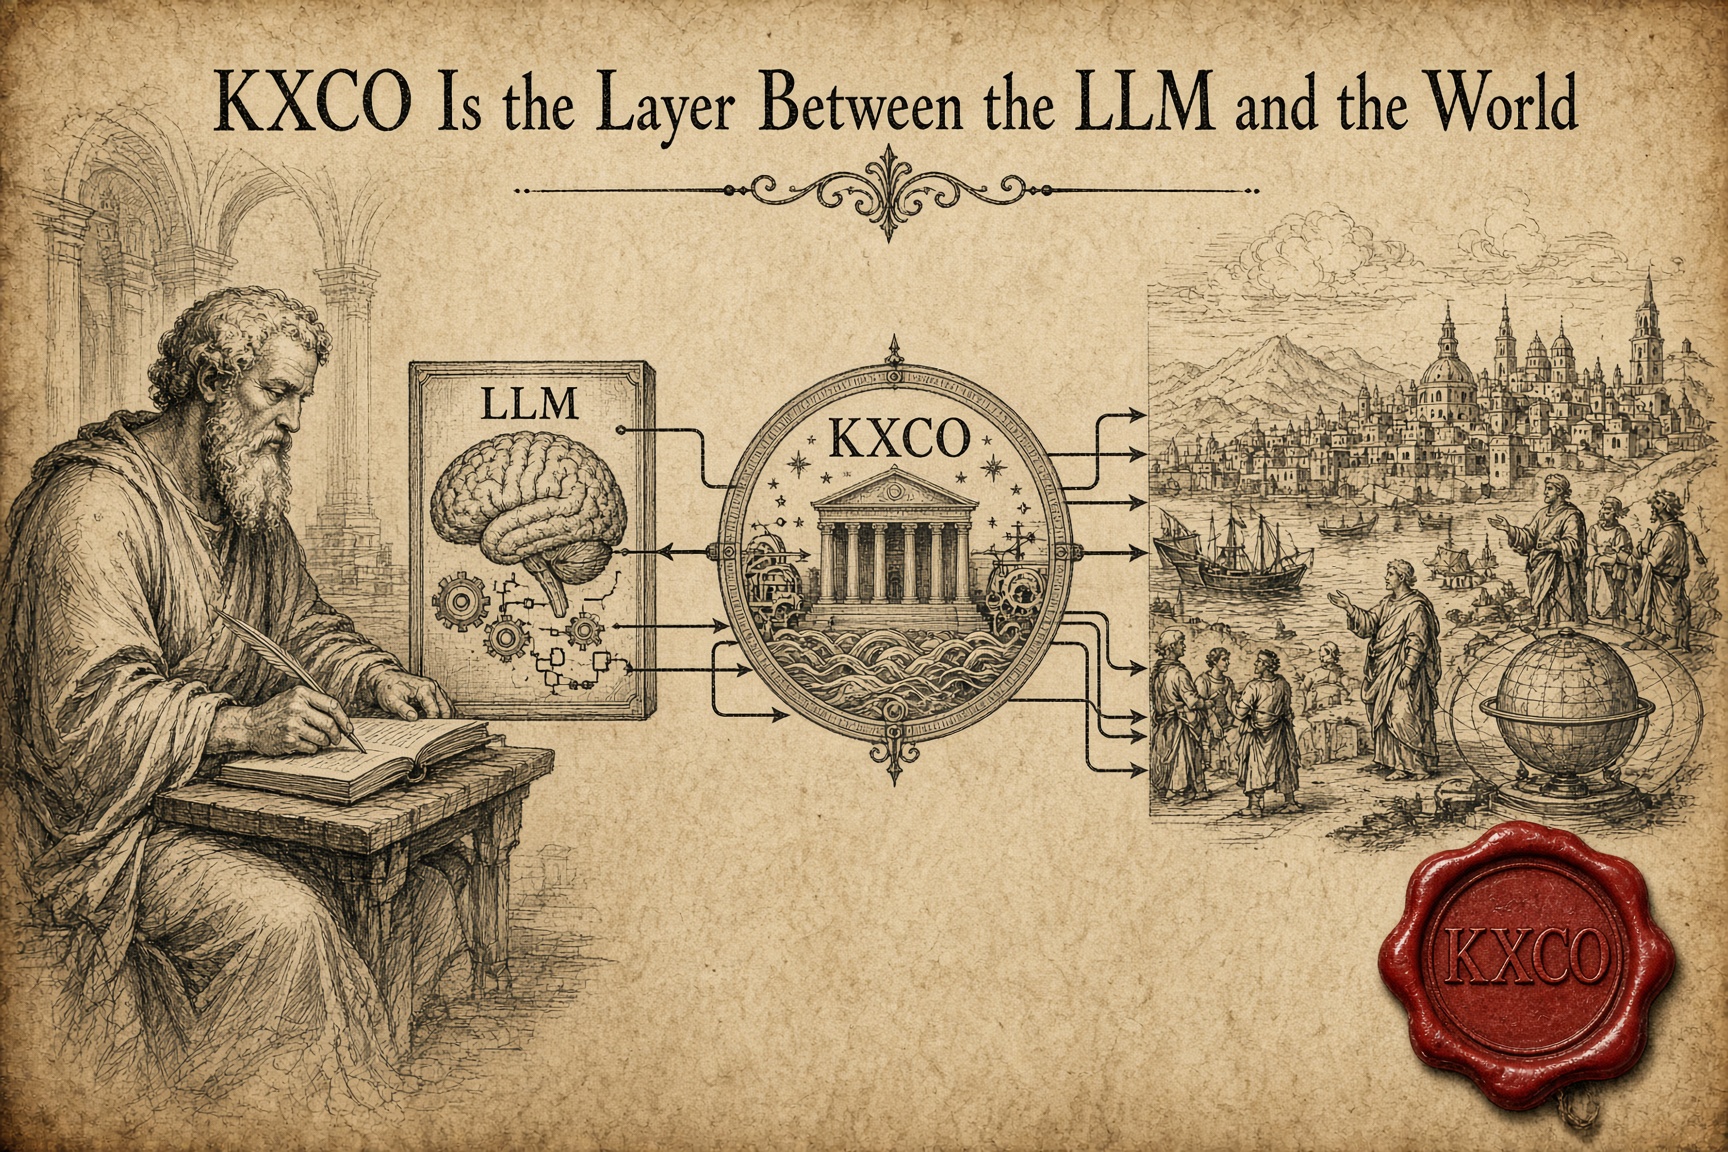
Give a hundred people the same book and very few will act on it. AI is that book: it distributes access, not understanding, and an institution cannot act on a paragraph. KXCO does not build another model or another agent. It builds the layer between the model and the world: who is speaking, what they are allowed to do, what they committed, and a post-quantum signature a stranger can check without asking us.
Every story, signed and delivered.
Subscribe to the kxco channel and get the headline, the AI-written key takeaways, and the chain-anchor link the moment we publish. Audio versions and per-ticker subscriptions arrive in the next iteration.