
Economic Calendar and Trading Strategies for the Week Ahead: July 20–24, 2026
The Strait of Hormuz Is Shut, Oil Is Surging, and Alphabet, Tesla and Intel Report Into a Market on Edge
The Week at a Glance: War Risk, Megacap Earnings, and a Market on Edge
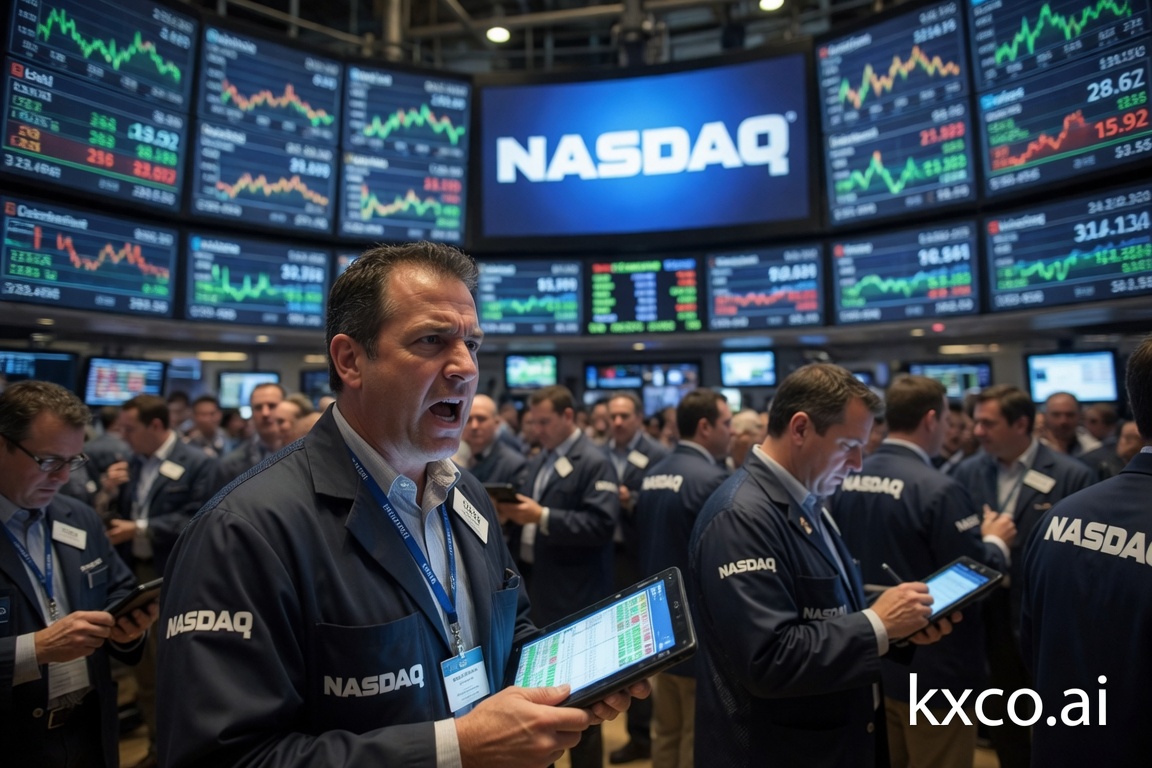
The week of July 20–24, 2026 arrives as one of the most consequential trading weeks of the year, defined by a collision between escalating conflict in the Middle East and a heavy slate of megacap technology earnings. The confrontation between the United States and Iran has deteriorated sharply over the past 72 hours: two American service members have been confirmed killed in the region, another is missing, and the United States has now conducted nine consecutive nights of strikes against Iranian military infrastructure. Iran, in turn, has declared the Strait of Hormuz — the artery for roughly 20% of the world's daily oil supply — shut to shipping. Crude jumped more than 9% in a single session, WTI printed a one-month high of $86.88, and gasoline has pushed above five dollars a gallon across much of the United States.
Against that backdrop, Alphabet, Tesla, and Intel headline a defining week for the technology tape. The Magnificent Seven have returned a muted 5.5% year-to-date through mid-July — a stark reversal from the triple-digit cumulative gains of 2023 and 2024 — and retail investors are rotating out of the old leaders into newer AI names. Gold continues its record run with J.P. Morgan now targeting $6,000 an ounce by year-end. Bitcoin has retreated from its July 2025 peak above $122,000 into a $65,000–$74,000 range. And the dollar is broadly weak, down roughly 11% year-to-date, with the euro at 1.1440 and the yen up nearly 9% on the year.
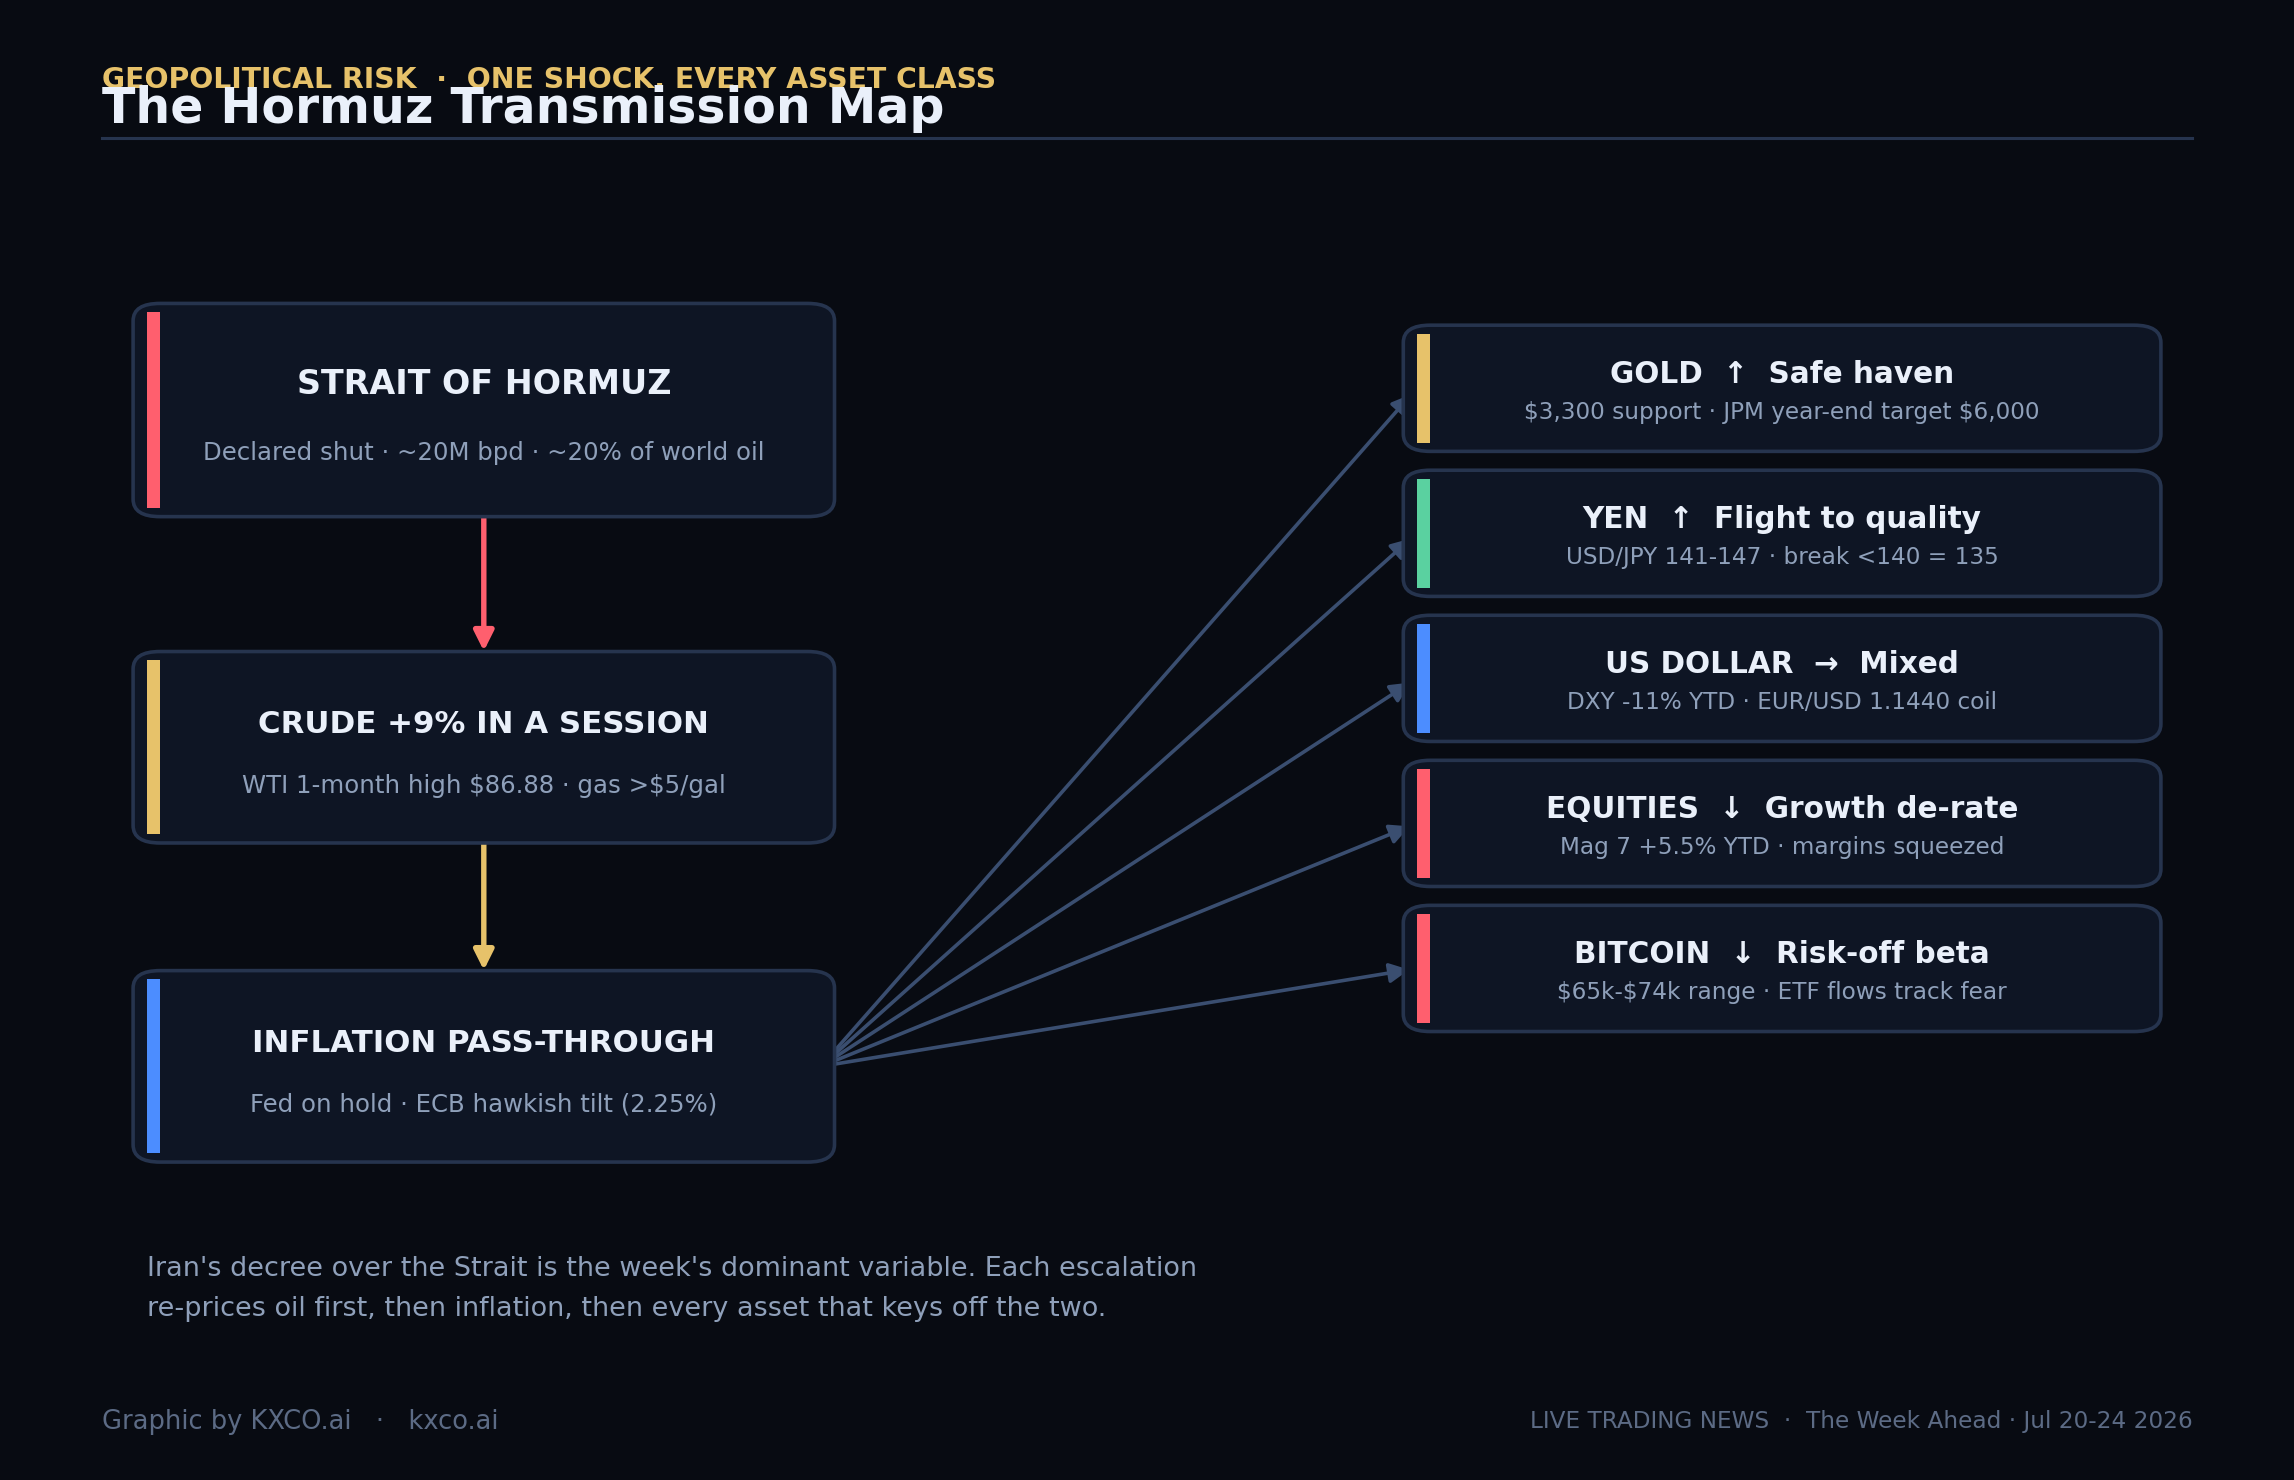
The through-line for every desk this week is simple: one geopolitical variable — the Strait of Hormuz — is now re-pricing oil, then inflation, then every asset that keys off the two. The map below traces how that single shock propagates across the board.
Track every economic release and market-moving headline this week on the Live Trading News Economic Calendar, and use the KXCO AI Sector Ontology to map the AI supply chain that is driving the megacap earnings trade.
Economic Calendar: July 20–24, 2026
The US data docket is light this week, which hands the wheel to corporate earnings and geopolitics. But several international releases and central-bank decisions still matter, and in a market this jumpy, sparse domestic data plus heavy geopolitical noise is exactly the environment where sharp, unexpected moves happen.
Date | Event | Consensus | Impact |
|---|---|---|---|
Mon Jul 20 | Canada CPI (YoY) | Watch USD/CAD | Medium |
Mon Jul 20 | ECB Rate Decision | Hold at 2.25% | High |
Mon Jul 20 | Japan — Marine Day (markets closed) | — | Low |
Tue Jul 21 | UK Employment / Claimant Count | Softening | Medium |
Tue Jul 21 | US API Crude Inventories | Hormuz read-through | Medium |
Wed Jul 22 | Alphabet ($GOOGL) Earnings | After close | High |
Wed Jul 22 | Tesla ($TSLA) Earnings | After close | High |
Wed Jul 22 | UK CPI | BoE input | Medium |
Thu Jul 23 | Intel ($INTC) Earnings | EPS ~$0.21 | High |
Thu Jul 23 | US Initial Jobless Claims | ~19,750 | Medium |
Thu Jul 23 | US New Home Sales | — | Low |
Fri Jul 24 | US Leading Indicators | — | Medium |
Fri Jul 24 | US Trade Balance (Goods) | Hormuz-sensitive | Medium |
Monday opens with Canadian CPI — a bellwether for North American price trends and the key input for USD/CAD — while Japan is out for Marine Day, thinning Asian liquidity. The marquee event is the ECB rate decision, where consensus is a hold at 2.25%. Given the energy shock rippling out of Hormuz, watch for a more hawkish-than-expected tone from President Christine Lagarde if she flags inflation pass-through from higher oil.
Tuesday brings UK employment data; a weak claimant-count print would accelerate Bank of England cut expectations and weigh on sterling. The US calendar is quiet, so watch the weekly API crude inventory report for an early read on the Hormuz disruption. Wednesday is the single most important session for equities: Alphabet and Tesla both report after the close. Thursday delivers Intel after the bell (consensus ~$0.21 EPS), plus jobless claims and new home sales. Friday closes with US leading indicators and the trade balance — the latter unusually interesting given the energy-import distortion from the Strait.
For the full interactive calendar with real-time updates, visit the Live Trading News Trading Hub.
The Iran Conflict and the Strait of Hormuz: The Overhang on Every Asset
The confrontation between the United States and Iran has escalated to its most dangerous level in modern memory. Two American service members were killed defending against Iranian ballistic-missile and drone attacks on Friday, July 18; a third died in a controlled explosion in Iraq on Saturday, July 19, with another still missing. These are the first US military fatalities of this round, and they have sharply raised the stakes. Washington has vowed to respond, and the United States has now run nine consecutive nights of strikes on Iranian missile sites, drone facilities, and command nodes. As CNN reported on July 19, the escalation has deepened fears of a wider regional war.
The Strait of Hormuz is the single most important flashpoint. Iran has declared the strait shut to shipping — a move affecting roughly 20 million barrels of crude per day, about 20% of global consumption. The reaction was immediate: crude jumped more than 9% after a naval blockade was announced, WTI hit a one-month high of $86.88, and US pump prices pushed above five dollars a gallon. Tanker insurance has spiked and several carriers are rerouting around the Cape of Good Hope, effectively removing tonnage from the market and keeping a fat risk premium in the price.
There is also an Israel dimension. The current fighting sits inside a broader regional conflict, and reporting on July 19 suggests Israel may be a wildcard even as both Washington and Tehran try to cap its involvement. Any independent Israeli action could trigger an Iranian response that further disrupts energy flows.
For the Federal Reserve, the shock is a policy dilemma: an oil-driven jump in headline inflation argues for patience, while the growth hit from higher energy costs argues for easing. The base case is that the Fed looks through a temporary supply shock — but a prolonged closure of the Strait would test that resolve and keep the geopolitical premium baked into gold, the dollar, Treasuries, and every risk asset.
Trading Strategy — Oil: Sell the Rallies, Hedge the Tail. Early-conflict oil is driven by fear, and the initial surge rarely holds. The disciplined play is to fade strength — short or buy puts on moves toward the $90s — with take-profit into the high $70s where pre-shock support sat, and stops above the recent high. The tail risk that invalidates the bearish thesis is a full, sustained closure of the Strait, which would send crude toward $120. Size positions so that tail cannot ruin the book; a call-spread overlay (long a near-the-money call, short a higher strike to fund it) keeps upside exposure to escalation while capping cost.
AI Chip Makers: The Semiconductor Battleground
The semiconductor complex enters the week at an inflection point — caught between the extraordinary demand of the AI infrastructure buildout and the headwinds of conflict, tariffs, and intensifying Chinese competition. The AI chip market remains the single most important growth driver in global equities, and the signals sent this week will ripple across the whole ecosystem. You can trace the full chain — from lithography through to end-user applications — in the KXCO AI Sector Ontology.
NVIDIA ($NVDA) still dominates AI acceleration with its Hopper and Blackwell architectures, but the leader faces a confluence of challenges. Its move into the PC-chip market sent $AMD, $INTC, and $QCOM lower as Wall Street priced the threat to incumbents in yet another segment. CEO Jensen Huang's push across every layer of the AI stack — data-center GPUs, edge, and now client PCs — is a bold bet on AI ubiquity. For traders, the next earnings print is the catalyst: watch data-center revenue growth, gross-margin trajectory under tariff pressure, and Blackwell demand guidance. The stock trades at a meaningful discount to its 2024 highs, which some see as an entry point.
AMD ($AMD) has been the standout challenger, up roughly 49% year-to-date at mid-2025, with its MI300X and upcoming MI350 series winning hyperscaler share as clouds diversify away from a single supplier. The decision to lift the AI-chip ban on China — clearing AMD to resume MI308 sales — is a real revenue opportunity, and the stock jumped more than 4% on the news. The offsetting risk is the rise of domestic Chinese alternatives, underscored by China's new Kimi K3 model. Watch AMD's relative strength versus NVIDIA as a barometer of competitive dynamics.
Intel ($INTC) reports Thursday, and it is one of the week's highest-stakes events. Investors want evidence that the multi-year turnaround is producing results. Intel has been the laggard — manufacturing delays, share loss to AMD, a late AI entry — and its foundry ambition to rival TSMC is a high-risk, high-reward bet. Reports of an accounting-related raid on Super Micro's Taiwan office add ecosystem uncertainty, since SMCI is a major Intel server-chip customer. Expect a binary reaction: a move of 10% or more in either direction is realistic, so wait for the release and the call before committing.
Broadcom ($AVGO) and the broader ecosystem — $QCOM, Marvell, Arm — round out the picture. Broadcom's custom AI accelerators and networking silicon are essential to large training clusters, and shares firmed even after a report questioning the durability of hyperscaler capex. The multi-vendor procurement reality — clouds building in-house silicon and buying from AMD and NVIDIA — ultimately supports the whole sector.
The Magnificent Seven: Rotation, Reckoning, or Resurgence?
Apple, Microsoft, Amazon, Alphabet, Meta, NVIDIA, and Tesla have been the defining equity trade of the post-pandemic era, driving the lion's share of S&P 500 returns and topping $15 trillion in combined market cap at the peak. But 2026 has been different: through July 13, the group is up just 5.5% on a cap-weighted basis — a fraction of its 2023–24 run. That has forced a real reassessment of whether the trade has run its course or is simply consolidating.
The most important shift is in retail behavior. Everyday investors are buying fewer shares of the old leaders and rotating into newer AI names offering more growth at lower valuations — AI infrastructure, enterprise AI software, and AI-powered healthcare and cybersecurity. That reduction in retail buying pressure can prolong relative underperformance, especially for Tesla and Apple, which carry company-specific baggage. This week's Alphabet and Tesla prints will either accelerate the rotation or spark a snapback.
There is also a contrarian, value case. Several analysts argue that NVIDIA is now the cheapest Magnificent Seven name on a forward P/E basis — a striking claim for one of the world's most valuable companies — on the view that AI infrastructure spend keeps accelerating past 2026 on enterprise adoption and sovereign-AI buildouts. Amazon (AWS + advertising) and Meta (AI-driven engagement, Reality Labs) are also cited as attractive, and Alphabet remains a favorite on Google Cloud and YouTube despite EU regulatory headwinds.
A word on concentration. Institutional capital is unusually concentrated in a handful of names, which cuts both ways: a negative catalyst can force correlated selling across funds and amplify downside, while an upside surprise can trigger a buying cascade. Position accordingly — earnings misses this week risk outsized selling, while beats may be met with a more muted response as capital keeps reallocating.
Gold: The Ultimate Safe Haven in a Time of War
Gold has been the standout of the commodity complex, returning 26% in US-dollar terms in the first half of 2025 alone and reaching double-digit gains across virtually every major currency, per the World Gold Council. The rally rests on a powerful trio: central-bank buying (China, India, and emerging markets diversifying from the dollar), the geopolitical premium from the Iran conflict, and falling real yields as the ECB, BoC, and BoE ease.
Near-term, gold is expected to trade a wide $3,365–$4,236 band through July, with a tighter $3,542–$3,887 settle projected by month-end. The levels that matter: support at $3,300 (tested repeatedly and holding) and resistance at $3,440, with a decisive break above $3,500 signaling the next leg higher. A daily close below $3,300 opens the path toward $3,200.
The boldest call on the Street is J.P. Morgan's: $6,000 an ounce by year-end 2026, with $6,300 flagged for 2027 — roughly 50–70% upside from here, driven by de-dollarization and a persistent risk premium. That target is highly sensitive to the Iran trajectory and the Fed's response, but it frames the upside.
Trading Strategy — Gold: Buy the Dips. Hold core longs and use strength toward $3,500 to trim. For new entries, buy dips toward $3,300 with a stop below $3,200 — a favorable risk-reward given the structural bid. Options traders can sell out-of-the-money puts to get paid while setting entries lower. Any de-escalation could spark a sharp but likely temporary selloff — a gift for disciplined, longer-horizon buyers. Size for gap risk and expect volatile session opens.
Foreign Exchange: Dollar Weakness, a Euro Coil, and the Yen's Comeback
The FX story is broad dollar weakness — the DXY is down roughly 11% year-to-date — driven by a relatively dovish Fed, fiscal concerns around US debt, and the drag from the Iran conflict on US fundamentals through higher energy costs and military spend.
EUR/USD has been locked in a four-week standoff around 1.1440, with the July range intact and a breakout looming. Monday's ECB decision is the near-term catalyst: a hold at 2.25% plus hawkish guidance from Lagarde could power a break above 1.15, while a surprise dovish tilt on growth fears could send it back toward 1.12–1.13. J.P. Morgan's team sees a gradual euro grind higher (1.15-area into Q3, easing toward 1.13 by early 2027); MUFG is similarly constructive near-term.
USD/JPY has delivered the most dramatic currency move of the year. The yen has appreciated nearly 9% against the dollar, from just under 160 to the current 141–147 range, as the Bank of Japan normalizes policy and safe-haven flows and carry-trade unwinds add fuel. The pair is a range trade between 140 and 148, with a break below 140 opening the path toward 135 if the conflict escalates and triggers a flight to quality.
Trading Strategy — FX: For EUR/USD, a break above 1.15 on ECB hawkishness warrants a long targeting 1.17 with a stop at 1.135. For USD/JPY, favor selling rallies toward the 147–148 resistance zone, targeting 143 with a stop above 150. Sterling faces headwinds from softening UK labor data and could test 1.26 if Tuesday's employment report disappoints. Treat emerging-market currencies with caution — dollar weakness helps, but rising energy prices hurt energy importers, and the two forces can whipsaw price.
Bitcoin: Navigating the Post-Halving Range
Bitcoin's 2026 has been a study in contrasts: an all-time high above $122,000 in July 2025, then a retreat into a $65,000–$74,000 range on profit-taking, regulatory friction, and the broader risk-off from the Iran conflict. But the structural bull case is intact — the April 2024 halving supply cut, growing institutional adoption through spot ETFs, and deeper integration into traditional finance. Historically, post-halving price action is consolidation followed by a parabolic advance, and this correction may simply be that consolidation.
Forecasts are wide: Binance models a $64,901–$101,754 band (average ~$83,328) for 2026–27; CoinCodex sees ~$73,874 near-term; a Yahoo Finance survey of AI models mostly expects Bitcoin to finish July above current levels in the $60,000–$68,000 zone. The dispersion underscores how much the Iran conflict is driving cross-asset risk appetite. Spot-ETF flows remain the tell — institutions trim into geopolitical stress and redeploy as tensions ease, so daily flow data is a useful leading indicator.
Trading Strategy — Bitcoin: Patience and Precision. Accumulate on weakness toward $60,000–$65,000 with a stop below $58,000; resistance at $75,000 is the first hurdle, and a decisive break there signals the corrective phase is ending. Keep size small given the elevated correlation to risk assets, and remember crypto trades 24/7 — weekend Iran headlines can move price outside traditional hours. For longer-horizon traders, out-of-the-money calls (three-to-six-month expiry, $80,000 strike) offer defined-risk leverage to the post-halving thesis. Approach altcoins with extra caution; they typically underperform Bitcoin during geopolitical stress.
Cross-Asset Key Levels and the Week's Trade Map
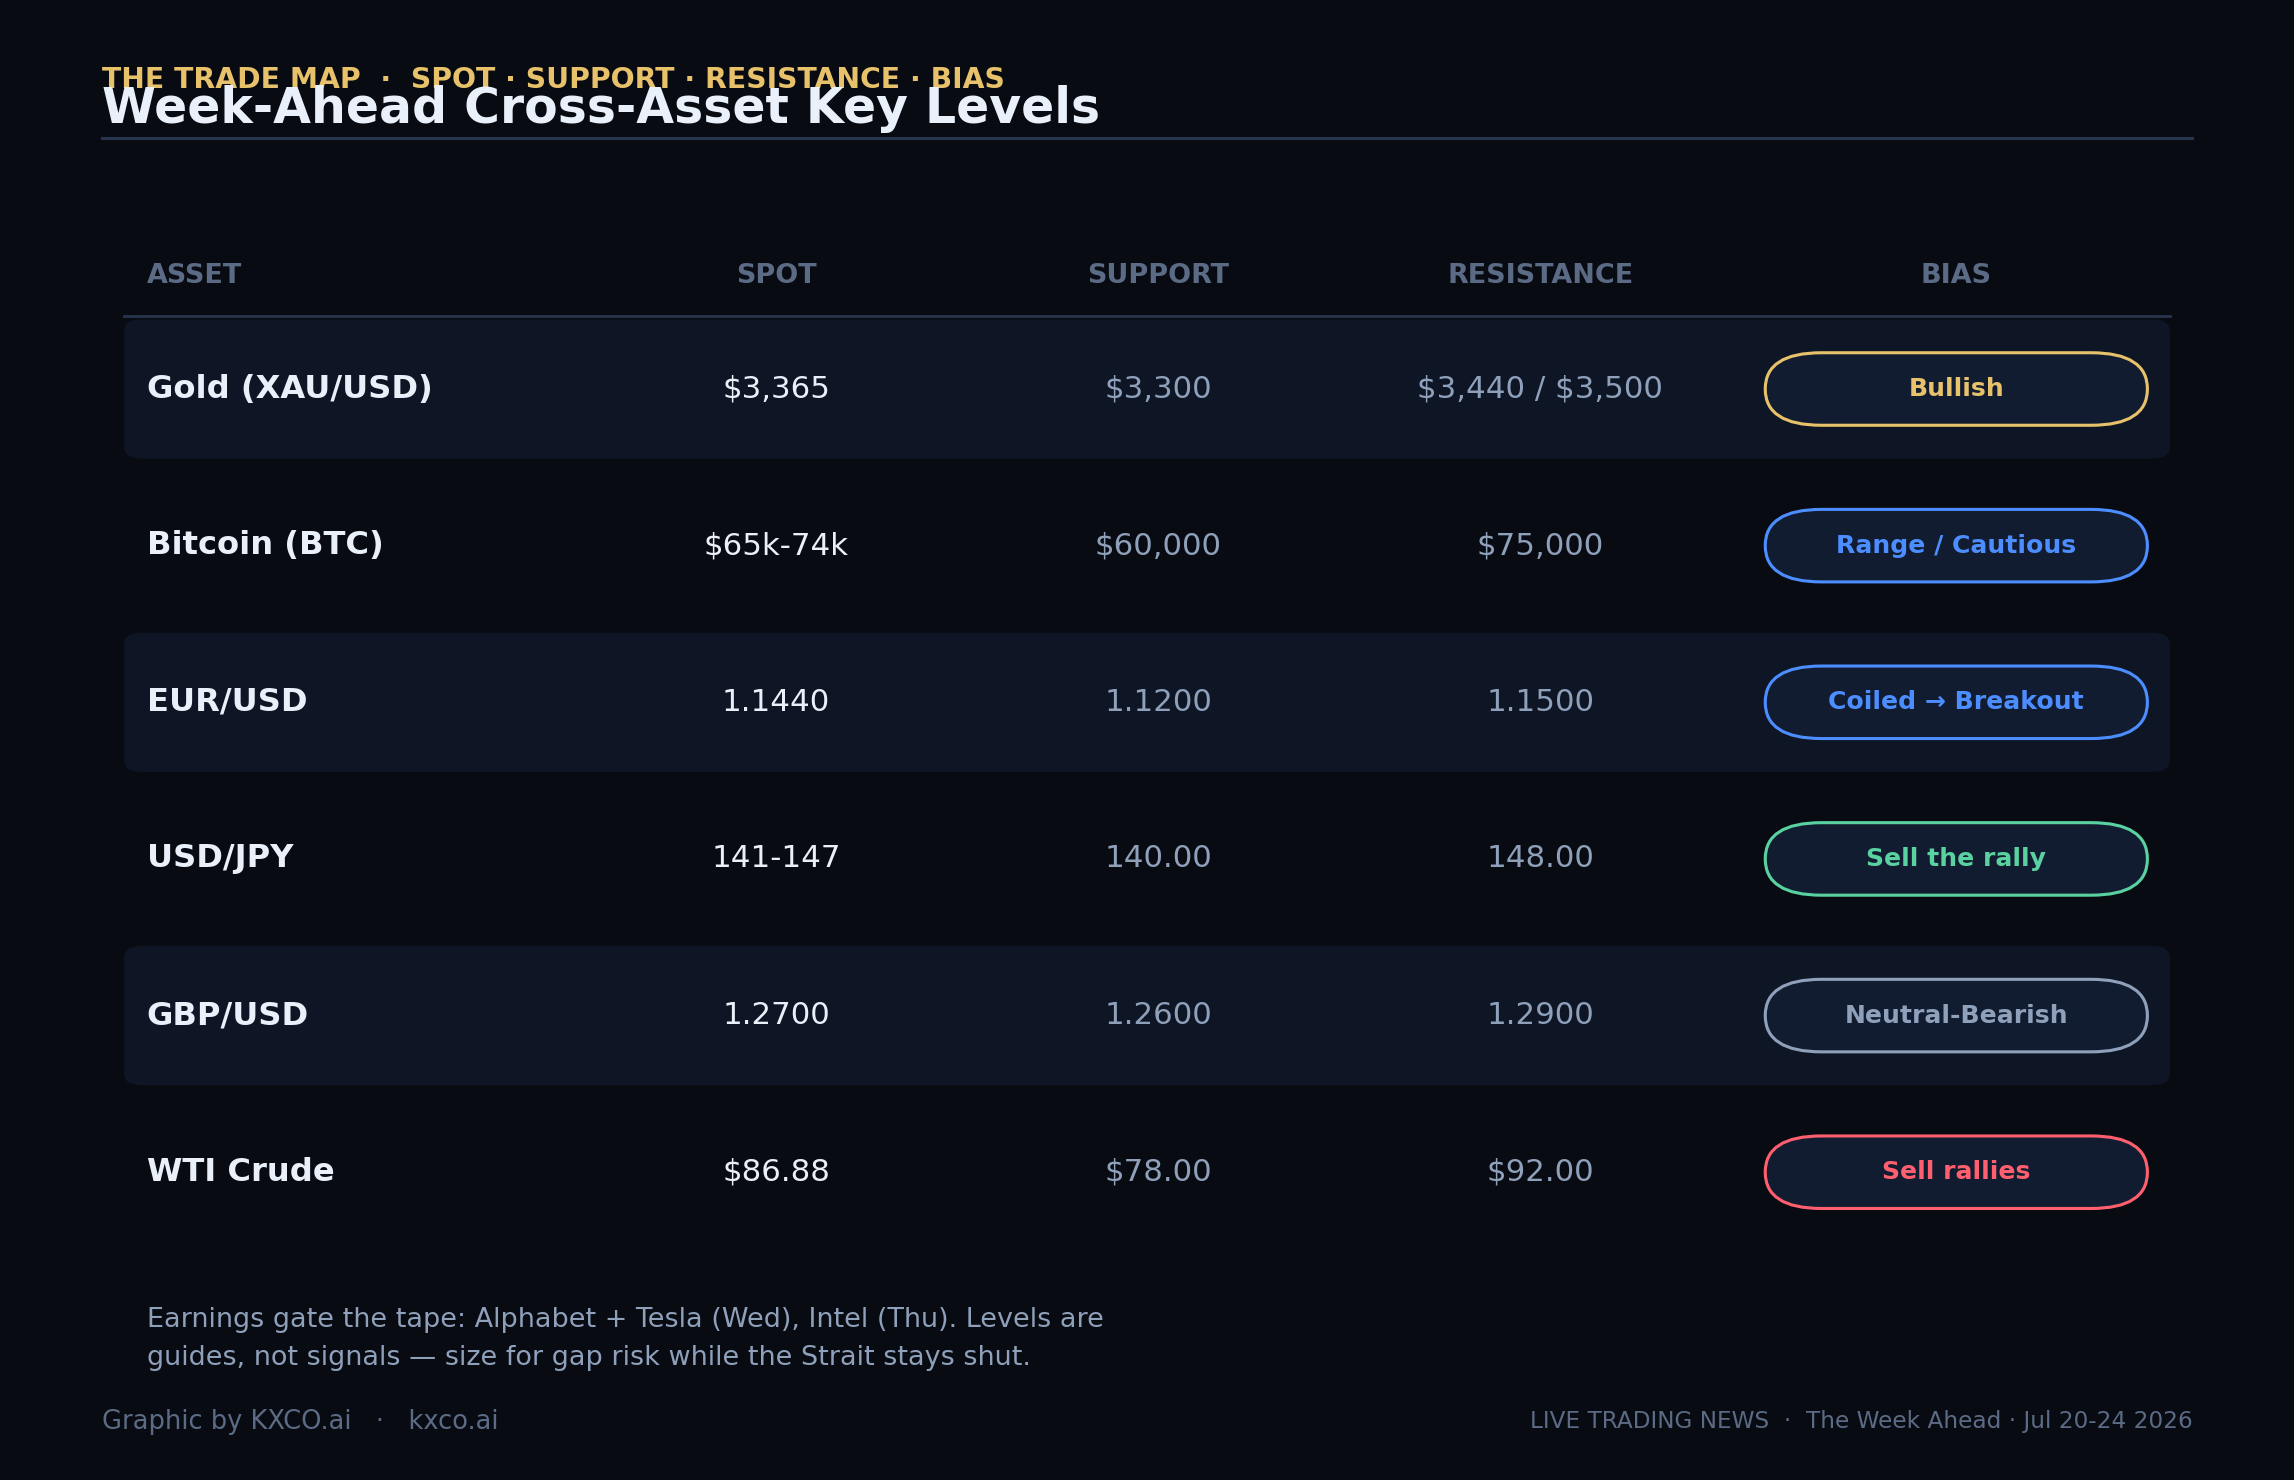
The table below consolidates the levels that matter across the board — spot, support, resistance, and directional bias — so every position this week can be framed against a clear plan.
Asset | Spot | Support | Resistance | Bias |
|---|---|---|---|---|
Gold (XAU/USD) | $3,365 | $3,300 | $3,440 / $3,500 | Bullish — buy dips |
Bitcoin (BTC) | $65k–$74k | $60,000 | $75,000 | Range / cautious |
EUR/USD | 1.1440 | 1.1200 | 1.1500 | Coiled → breakout |
USD/JPY | 141–147 | 140.00 | 148.00 | Sell the rally |
GBP/USD | 1.2700 | 1.2600 | 1.2900 | Neutral-bearish |
WTI Crude | $86.88 | $78.00 | $92.00 | Sell rallies / hedge tail |
The Trading Playbook: Positioning Across Asset Classes
The week rewards flexibility, discipline, and the willingness to adapt fast. The unifying thesis: buy the dips in safe-haven and quality-growth assets, sell the rallies in fear-inflated commodities, and keep risk small.
Equities — earnings-driven. For Alphabet ($GOOGL), consider longs below $345 targeting $365 with a stop at $335, given the recent pullback and cloud-revenue optionality. For Tesla ($TSLA), a straddle captures a large move in either direction without a directional bet. For Intel ($INTC), wait for the print and the call — a 10%+ binary move is realistic. Across the Magnificent Seven, misses risk outsized selling while beats may be muted.
Commodities — gold and oil. Buy gold dips toward $3,300 (target $3,500, stop $3,200). Fade oil rallies while overlaying a call spread to stay long the escalation tail. Natural gas can spill over if the conflict disrupts Gulf LNG.
Currencies — trade the dollar's weakness with discipline. Long EUR/USD on a break above 1.15; sell USD/JPY rallies into 147–148. Keep emerging-market size small.
Crypto — patience. Accumulate Bitcoin toward $60,000–$65,000; sell strength into $72,000–$75,000; keep an eye on ETF flows.
Asset | Strategy | Entry Zone | Target | Stop |
|---|---|---|---|---|
Gold (XAU) | Buy the Dip | $3,300–$3,320 | $3,500 | $3,200 |
Oil (WTI) | Sell the Rally | $88–$92 | $78 | $95 |
Bitcoin (BTC) | Accumulate | $60,000–$65,000 | $75,000 | $58,000 |
EUR/USD | Buy the Breakout | >1.1500 | 1.1700 | 1.1350 |
USD/JPY | Sell Rallies | 147.00–148.00 | 143.00 | 150.00 |
Buy Pre-Earnings | <$345 | $365 | $335 | |
Straddle | At the money | Large move | Defined premium | |
Wait for Print | Post-earnings | Trend follow | Below key MA |
Risk Management: The Most Important Strategy
In an environment this unpredictable, risk management is not an adjunct to strategy — it is the strategy. Reduce position sizes relative to normal, hold more cash than usual, and use stop-losses on every position without exception. The Iran conflict creates the potential for overnight gap moves that jump straight through stops, so consider options to hedge tail risk. Diversify across asset classes, currencies, and time horizons. And stay informed: the ability to react quickly and decisively to new information is the single most important edge in this tape.
Key Questions for the Week Ahead
What is the biggest risk to markets this week? The Strait of Hormuz. Iran's declared closure removes roughly 20% of global oil supply from the market and is re-pricing oil, inflation, and every risk asset. A full, sustained closure is the tail that would send crude toward $120 and drive a broad flight to safety.
Which companies report earnings the week of July 20–24, 2026? Alphabet ($GOOGL) and Tesla ($TSLA) report Wednesday, July 22 after the close; Intel ($INTC) reports Thursday, July 23 after the close, with consensus EPS around $0.21.
What is the gold price forecast for 2026? Near-term, gold is expected to trade a $3,365–$4,236 range with support at $3,300 and resistance at $3,440–$3,500. J.P. Morgan targets $6,000 an ounce by year-end 2026 and flags $6,300 for 2027.
Where is Bitcoin trading now? Bitcoin is in a $65,000–$74,000 range after retreating from its July 2025 peak above $122,000, with support at $60,000 and resistance at $75,000.
What is the ECB expected to do on July 20? The consensus is a hold at 2.25%, with the risk skewed toward a hawkish tone from President Lagarde given the energy-price shock from Hormuz.
Bottom Line
This is a week where a single geopolitical variable sits upstream of every asset class, and where three of the most widely held technology companies report into a market already on edge. The disciplined approach is to respect the Hormuz tail risk, fade fear-driven oil strength, buy quality safe havens on weakness, and keep size small enough to survive a gap. Track every release and headline in real time on the Live Trading News Economic Calendar, and use the KXCO AI Sector Ontology to stay ahead of the structural shifts driving the AI trade.
Disclaimer: This article is for informational and educational purposes only and does not constitute financial, investment, or trading advice. All trading involves substantial risk of loss, and past performance is not indicative of future results. Readers should conduct their own research and consult a qualified financial advisor before making investment decisions. The views expressed are those of the author and do not necessarily reflect those of Live Trading News.

How Can You Trust AI When You Cannot Trust Humans?
Can you trust AI? Can you trust humans? More often than we like to admit, the answer is no. AI inherits its failures from the human records it is trained on. Sheikh Mohammed bin Rashid wrote this month that the currency the UAE is betting on is trust. This piece sets out what a trust layer has to do, shows the method on three public knowledge graphs, and lays out the post-quantum work KXCO has published so that an institution can check the claim rather than take it.
KXCO AI Ontology at 3 Months: What It Called and What Comes Next
On 19 July 2026 the Round Table's AI room published its first Analyst Outlook. To the 16 October 2026 close its 13 names rose 2.6% on an equal weight against 2.1% for QQQ, per StockAnalysis closes, and the six it opened with 35% or more of upside rose 8.6%. This piece lists the six names up more than 5%, the ten names I rate as opportunities now, the month's results in AI and quantum computing, and the official data showing that four in five firms have not yet started using AI.

SpaceX: The Road to 10 Gigawatts
SpaceX did not add an AI business. A company whose processes run on compute built its own computing plant, then built the power to run it. The 10-Q reports 1.4 gigawatts of nameplate compute at 30 June 2026, four leases worth about $41 billion a year and $100 billion of cash. The target is closer to 10 gigawatts than 5 by the end of 2027. This piece sets out the build sequence, the four layers of power in Memphis, and why Terafab is the act after 2027, not the road to it.
The China Chip Shock
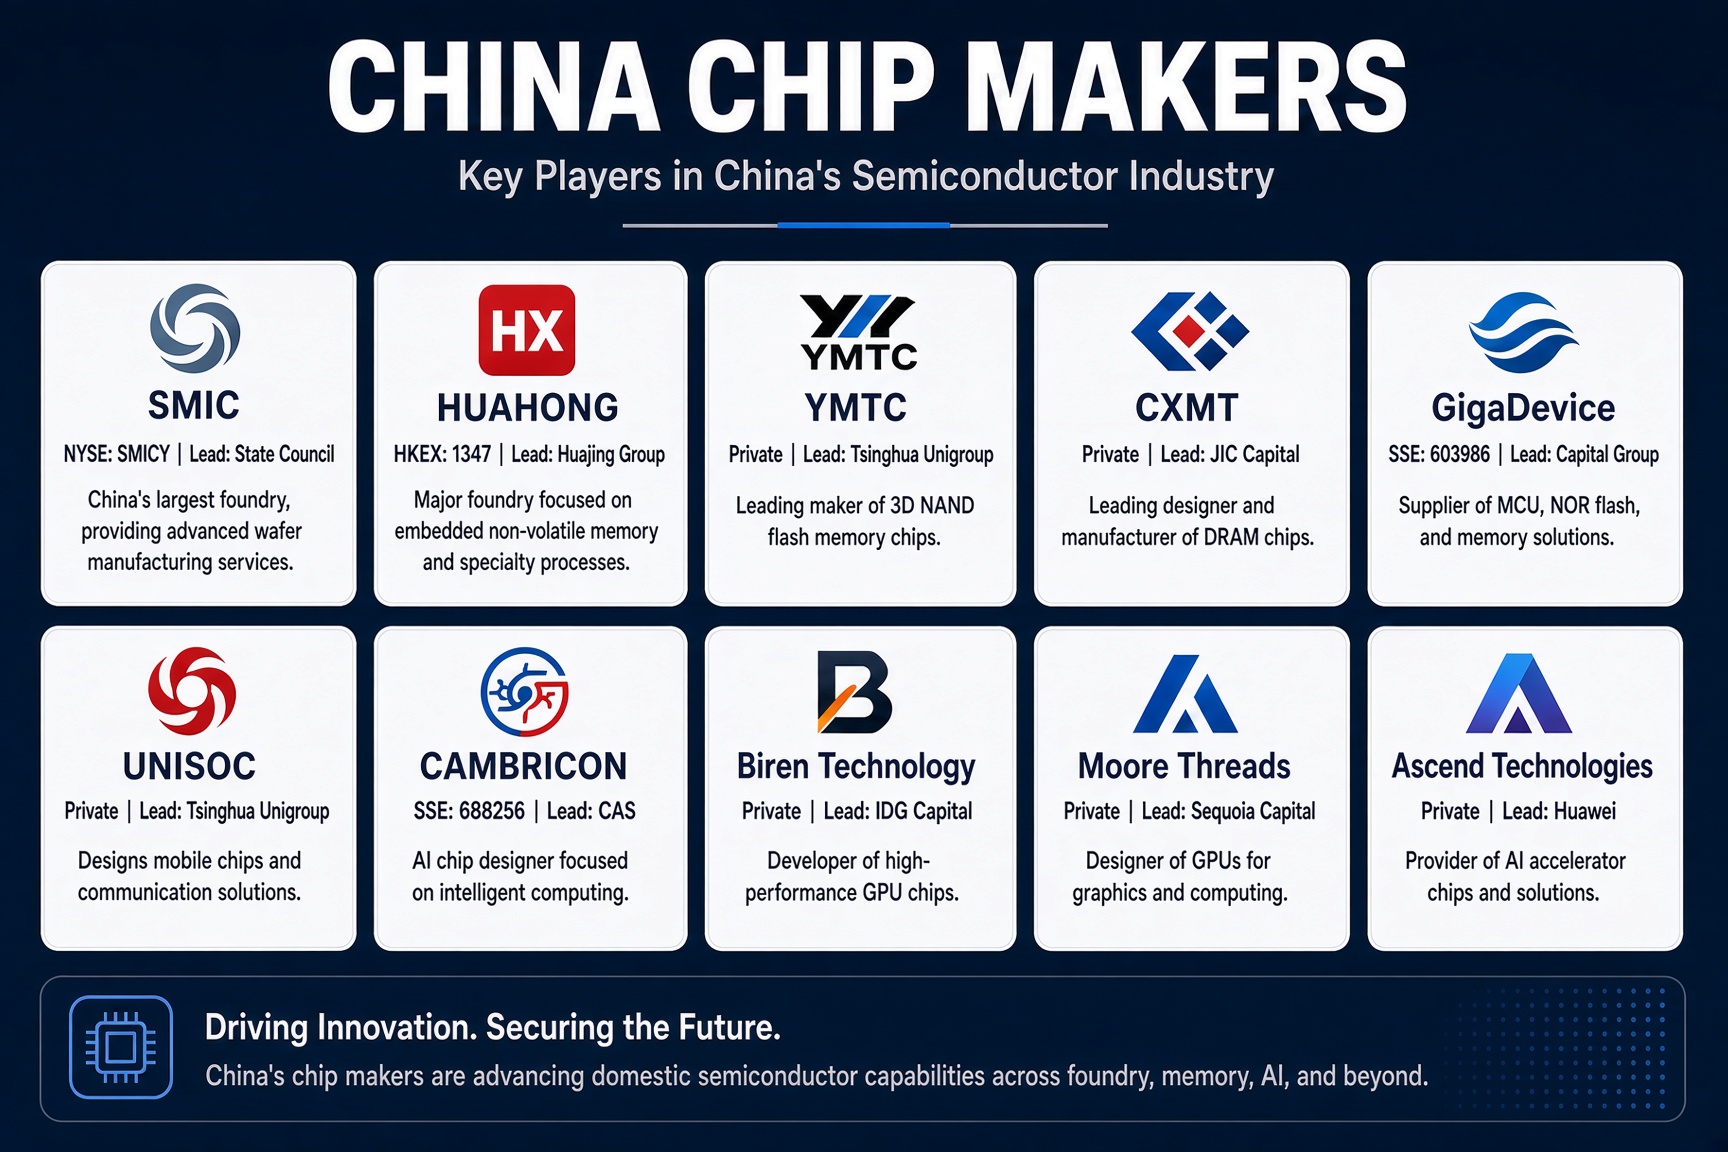
On 10 October CXMT said it will ship DDR5 server modules on a 4F2 cell by year-end. Micron, SK Hynix, Samsung and Sandisk sold off for two sessions and Elon Musk said China scales faster than the rest of the world combined. This piece sets out China's memory makers, foundries, AI chip designers and toolmakers, with two knowledge graphs drawn from the KXCO AI Sector Ontology, and says what the sell-off prices and what it does not.
Every story, signed and delivered.
Subscribe to the kxco channel and get the headline, the AI-written key takeaways, and the chain-anchor link the moment we publish. Audio versions and per-ticker subscriptions arrive in the next iteration.