
Economic Calendar Trading Strategy
Economic calendar, trading strategy, the AI buy list, quantum updates, and what $40 trillion of US debt actually changes
Part of theStocks Center
1. The week in one paragraph
Markets enter the final full week of August with the heaviest event cluster of the quarter and a bond market that has stopped cooperating. The S&P 500 closed Friday at 7,674.37, up 0.43% on the day but down 1.4% on the week, with information technology off more than 3% across the five sessions. The 10-year Treasury yield sits at 4.73% and the 30-year at 5.27%, levels that survived the Treasury's decision on 19 August to at least double its buybacks of 10 to 30-year paper. Gold closed at $4,590.51, its highest since 18 May, after a week of roughly 5% gains. Bitcoin finished at $77,182.60, up 22% on the week, its best week since November 2024. On Wednesday the Federal Reserve's preferred inflation gauge lands at the same moment as the second estimate of Q2 GDP, and Nvidia reports that evening. On Friday, a new Fed Chair speaks at Jackson Hole for the first time. The strategic posture through the mid-August pullback was to buy quality dips in AI leadership and hard assets. That worked. This is the week to bank part of it.
2. What changed since our last note, stated plainly
We publish corrections in the piece rather than in a footnote. Five things in the weekend draft of this note did not survive verification, and one omission mattered more than any of the corrections.
Item | Weekend draft said | Verified position |
|---|---|---|
Nvidia earnings | Not mentioned | Wednesday 26 August, after the close, same day as core PCE |
Oracle backlog | "record backlog in the region of $75 billion" | Remaining performance obligations of $638bn at Q4 FY2026, up $85bn in the quarter from $553bn |
Core PCE trajectory | "elevated but showing gradual progress" | 3.3% year over year in June, July nowcast 3.29%, no progress in the last three prints |
Ontology scale | 374 entities, 837 claims | 387 entities, 851 claims, 40 findings, as of 22 August |
Gold level | "$4,600 to $4,680 area" | $4,590.51 at the Friday close |
Treasury yields | No yield cited | 10-year 4.73%, 30-year 5.27% |
The Nvidia omission is the one that would have cost money. A calendar that flags core PCE as the high-impact event of Wednesday and does not mention that the largest company in the index reports the same evening is not a calendar, it is half of one.
3. The calendar, with the numbers that matter
Consensus and prior readings below are drawn from the Newsquawk and FinancialJuice week-ahead compilations and the Kansas City Fed programme.
Day | Time ET | Event | Prior or consensus | Impact |
|---|---|---|---|---|
Mon 24 | 08:30 | Chicago Fed National Activity Index (Jul) | Diffusion index, rarely moves price | Low |
Mon 24 | intraday | Treasury Secretary Bessent press conference on bond intervention | Follows the 19 Aug buyback expansion | Medium to high |
Mon 24 | after close | Earnings: PDD, XPeng | China consumer read | Low |
Tue 25 | 09:00 | FHFA House Price Index (Jun) | Lagging consumer balance-sheet signal | Low |
Tue 25 | 10:00 | Conference Board Consumer Confidence (Aug) | Prior 90.8, missed | Medium |
Tue 25 | 10:00 | Richmond Fed Manufacturing (Aug) | Regional survey | Low |
Tue 25 | after close | Earnings: Intuit | Software demand read | Low |
Wed 26 | 08:30 | Core PCE Price Index (Jul), Personal Income and Spending | June 3.3% YoY, +0.1% MoM. July nowcast 3.29% | Very high |
Wed 26 | 08:30 | GDP Q2, second estimate | Advance 1.5% annualised | High |
Wed 26 | 08:30 | Durable Goods Orders (Jul, preliminary) | Capex proxy | Medium |
Wed 26 | intraday | Atlanta Fed GDPNow, Q3 update | Tracks with the official revision | Medium |
Wed 26 | after close | Nvidia FQ2 FY2027 | Consensus $91.85bn revenue, $2.08 EPS. Company guided ~$91bn plus or minus 2% | Very high |
Wed 26 | after close | Earnings: Salesforce, CrowdStrike | Enterprise software and security | Medium |
Thu 27 | 08:30 | Initial jobless claims (w/e 22 Aug) | Labour market pulse | Medium |
Thu 27 | all day | Jackson Hole Symposium opens, runs 27 to 29 | Theme: Financial Innovation, Implications for Payments and Policy | High |
Thu 27 | after close | Earnings: Marvell | AI networking and custom silicon | Medium |
Fri 28 | ~10:00 | Chair Warsh keynote, first as Chair | No prior as Chair | Very high |
Fri 28 | 08:30 | Non-farm payrolls annual benchmark revision, preliminary | Can restate the labour narrative wholesale | High |
Fri 28 | 10:00 | UMich Sentiment and inflation expectations, August final | Prelim 51.0, from 55.2. One-year expectations 4.3% | Medium |
Fri 28 | after close | Sovereign rating reviews: Fitch on France, Moody's on Switzerland, S&P on Portugal | Sovereign credit, into a heavy supply calendar | Medium |
Three observations about the shape of this calendar.
First, it is back-loaded and then front-loaded again. Monday and Tuesday carry almost nothing that moves an index, which historically means positioning rather than information drives the tape. Watch for early de-grossing in levered long books on Monday and Tuesday, because that is what a desk does when it can see Wednesday coming.
Second, Wednesday is not one event, it is three. The 08:30 block gives you inflation and growth in the same second, and the market has to price both against a rate path. Then it waits nine hours and prices the AI complex against a single earnings release. There is no version of Wednesday that resolves cleanly.
Third, Friday has a hidden item. The preliminary annual benchmark revision to non-farm payrolls arrives 90 minutes before the Chair speaks. Benchmark revisions have restated the labour market by hundreds of thousands of jobs in recent years. If that number is large and negative, Warsh will be asked about it within the hour, and the entire framework discussion shifts from inflation persistence to labour fragility.
4. The inflation arithmetic nobody wants to write down
Here is the uncomfortable position, stated without decoration. Core PCE ran 3.3% year over year in June, edging down from May. Headline PCE actually fell 0.1% month over month in June while core rose 0.1%. The Cleveland Fed's nowcast for July core PCE sits at roughly 3.29%, and prediction-market pricing clusters around 88% probability of a 3.2% to 3.3% print. Q2 GDP came in at 1.5% annualised on the advance estimate. Consumer sentiment is at 51.0 on the August preliminary, down from 55.2 in July, with one-year inflation expectations at 4.3%.
Read those five numbers together. Growth at 1.5%, core inflation at 3.3%, sentiment near a record low, household inflation expectations at 4.3%, and a 30-year yield at 5.27%. That is not a soft landing narrative with a stubborn tail. That is an economy where the inflation problem has stopped improving while the growth impulse has weakened, and where the long end of the curve is charging a real premium for fiscal risk.
What this means practically is that the distribution of Wednesday outcomes is not symmetric around a benign centre. A 0.2% monthly core print keeps the year-over-year rate near 3.2% and lets the market retain hope. A 0.3% print puts the annualised run rate near 3.6% and makes any dovish Jackson Hole language impossible to deliver credibly. A 0.1% print is the genuine upside surprise, and on current nowcasts it is the least likely of the three.
Composition matters more than the headline, and this is where most desks will get Wednesday wrong. A re-acceleration driven by shelter and medical services is sticky, policy-relevant, and hands the Chair a hawkish script. A re-acceleration driven by residual goods-price volatility, tariff pass-through, or a one-off in portfolio management fees is noise that the Fed has learned to look through. Read the services line before you trade the print.
One further note on the tariff channel. Part of the reason the debt crossed $40 trillion earlier than forecasters expected is lost revenue from tariffs that were subsequently invalidated. That same channel cuts the other way on prices: tariff-driven goods inflation unwinding is disinflationary at the margin even as the fiscal hole gets deeper. Do not model the fiscal and price effects as pointing the same direction. They do not.
5. Wednesday evening is Nvidia day
Nvidia reports fiscal Q2 2027 after the close on Wednesday 26 August. Forty analysts carry revenue at $91.85bn and earnings at $2.08 per share. The company guided to approximately $91bn plus or minus 2% at the last print. Data centre is running at roughly 93% of revenue and grew 78% year over year in the most recent quarter.
Three things matter more than the headline beat, which is close to a formality at this point.
The guide, not the print. At this scale, the sell-side revenue number is well anchored and the surprise lives in the forward quarter. The question is whether Nvidia guides above roughly $105bn for FQ3, which is what the current capex commitments across the hyperscalers imply, or whether supply constrains the guide below that.
Memory and packaging language. The binding constraint on Nvidia's own shipments is not demand, it is high-bandwidth memory and advanced packaging. SpaceX's stated plan to move from about 2GW of compute at the end of 2026 to roughly 10GW at the end of 2027 implies well over a million Rubin-class GPUs, possibly more than two million. BNP Paribas has warned publicly that the commitment could trigger another Nvidia supply shortage. SpaceX put the constraint in one line: memory supply is growing about 20% a year against compute demand growing about 200%. Anything Nvidia says about HBM allocation is a sector-wide datapoint, not a company one.
The credit question. On 17 August, Nvidia agreed to guarantee up to $105bn of OpenAI's conditional lease and power obligations to SB Energy, tied to a campus in Pike County, Ohio. That is the first signed piece of an up-to-$250bn backstop that Nvidia and OpenAI were reported in late July to be discussing. A chip vendor underwriting its largest customer's power bill is a genuinely new kind of exposure on a semiconductor balance sheet, and this is the first quarter in which analysts can ask about it with a signed number in hand.
If Wednesday's PCE print is hot and Nvidia guides light, you get the bear case for the whole complex in a single session. Position sizing this week should be built around surviving that specific combination, because it is the one path that damages both the rate-sensitive and the earnings-sensitive legs of an AI-heavy book at once.
6. Jackson Hole: Warsh's first, and why the theme is a red herring
The Federal Reserve Bank of Kansas City hosts the 2026 Jackson Hole Economic Policy Symposium from 27 to 29 August. Roughly 120 central bankers, policymakers, academics and economists from more than 70 countries attend. The published theme is "Financial Innovation: Implications for Payments and Policy." Chair Kevin Warsh delivers the keynote on Friday morning, 28 August, his first as Chair.
Jackson Hole keynotes routinely ignore their own programme. The venue is where reaction functions and frameworks get revised, because it is the one setting where a Chair can talk about the medium term without it being read as a policy signal for the next meeting. A first keynote from a new Chair is the highest-variance version of that event.
What to listen for, in order of market consequence:
Any characterisation of the neutral rate. If Warsh signals that the neutral rate is structurally higher because of fiscal dynamics, the entire front end reprices and the long end gets permission to stay where it is.
Language on the balance sheet and Treasury market functioning. With the 30-year at 5.27% and the Treasury doubling long-end buybacks, the boundary between debt management and monetary policy is genuinely blurred right now. Any comment on that boundary is a first-order event for duration.
Whether he treats 3.3% core as a level problem or a path problem. A Chair who says the level is unacceptable is a hawk regardless of the adjectives around it.
Payments and financial innovation as substance rather than theme. Given the programme title, expect real content on stablecoins, tokenised settlement, and payment-system risk. That is not macro, but it is directly relevant to anyone holding digital assets or payment infrastructure exposure.
The asymmetry here is worth naming. Market pricing going into Friday embeds an assumption of continuity. A new Chair has the least incentive of anyone to defend an inherited framework and the most incentive to define his own. Hawkish surprise risk is higher than the options market is charging for.
7. Forty trillion dollars, and what actually changes
On 19 August the Treasury reported total public debt outstanding above $40.05 trillion as of the prior close. The $39 trillion mark was reached in March, so the last trillion took about five months. Debt has risen by roughly $3.8 trillion since January 2025 and has doubled since January 2017, when it stood at $19.95 trillion. Per person the figure is about $117,000, and roughly $297,000 per household. Annual debt service now runs about $1.1 trillion, slightly more than the United States spends on defence.
The trajectory, put in historical terms:
Milestone | Reached | Time from prior trillion-scale step |
|---|---|---|
$1 trillion | 1981 | Roughly two centuries |
$10 trillion | 2008 | 27 years |
$20 trillion | 2017 | 9 years |
$30 trillion | 2022 | Roughly 4 years |
$39 trillion | March 2026 | |
$40.05 trillion | 19 August 2026 | About 5 months |
Two mechanical points follow, and neither requires a crisis to matter.
Interest compounds on a larger base. The reason the trillions arrive faster is not primarily new policy, it is arithmetic. At $40 trillion outstanding and a weighted average coupon that keeps rising as old low-coupon paper rolls into a 4.7% to 5.3% curve, debt service grows even if the primary deficit is flat. That is why the interest line has passed defence.
Debt management is now a market variable. The Treasury's decision on 19 August to at least double buybacks of 10 to 30-year securities pushed long-end yields and the dollar lower on the day. By Friday, yields had rebounded to 4.73% and 5.27%, and the market's read, fairly, was that buybacks are a liquidity tool rather than a solution to a supply problem. Secretary Bessent is holding a press conference on Monday to detail further intervention plans. For a week in which the Chair speaks on Friday, having the Treasury Secretary discuss bond-market intervention on Monday is an unusual sequencing, and it deserves attention.
For asset allocation the implications are narrow and durable rather than dramatic. The term premium in long-dated Treasuries is unlikely to return to the near-zero levels of the 2010s. The opportunity cost of holding non-yielding real assets falls when real yields are capped by fiscal reality rather than by growth. And any future tightening cycle is more costly, politically and financially, than the last one, because the stock being financed is so much larger. Gold at $4,590 with a 12-month UBS target of $5,400 is not a momentum trade on this reading. It is the cleanest expression of the arithmetic above.
What the milestone does not justify is panic. The United States retains the deepest capital markets in the world and the dollar's reserve status. The correct posture is to treat fiscal risk as a permanent, priced feature of the macro process rather than as an event.
8. Cross-asset: where things actually closed
All levels are the Friday 21 August 2026 close.
Asset | Level | Day | Week | Read |
|---|---|---|---|---|
S&P 500 | 7,674.37 | +0.43% | -1.4% | Bounce inside a down week. Tech off more than 3% |
Nasdaq Composite | 26,180.46 | +0.43% | -2.0% | AI premium intact, momentum is not |
Dow Jones | 53,277.01 | +0.98% | -0.8% | Rotation toward the defensive complex |
US 10-year yield | 4.73% | rebounded | higher | Buybacks read as a liquidity fix, not a solution |
US 30-year yield | 5.27% | rebounded | higher | The fiscal premium is in the long end |
Gold (spot) | $4,590.51 | +1.65% | ~+5% | Highest since 18 May. UBS 12-month target $5,400 |
Silver (spot) | $69.63 | +2.22% | outperformed gold | Monetary and industrial demand at once |
WTI crude | $87.06 | +0.26% | firm | Iran isolation premium embedded |
EUR/USD | 1.1678 to 1.1697 | firmer | near 3-month high | ECB hike expectations firming |
USD/JPY | 158.86 | softer | softer | Carry intact, intervention risk live |
Bitcoin | $77,182.60 | -1.65% | +22% | Best week since November 2024 |
Equities and index futures. The tape is doing something specific and worth naming: the index is holding while its leadership deteriorates. Information technology fell more than 3% over the five sessions while the Dow lost only 0.8% and closed Friday up nearly 1%. That is a rotation, not a drawdown, and rotations of that shape often precede an index-level move rather than substituting for one. Friday's strength was helped by a flash PMI showing US business activity growing at its fastest pace in more than four years, which is genuinely good news that also complicates the disinflation case.
Gold. The move is clean and well-sourced: a softening dollar, the fiscal print, and safe-haven demand around the Iran campaign. Structure stays constructive while the metal holds its rising short-term averages. We maintain the position and would add on any risk-off spike rather than trimming into it. Gold is the position in this book that is supposed to be uncomfortable to hold when everything else is working.
Silver. At $69.63 silver outperformed gold on the week and the gold-silver ratio compressed, which is typical of a strong precious-metals phase and typically the noisier part of it. Silver's dual monetary and industrial character means it participates in both the fiscal-hedge trade and the AI-infrastructure trade, and it will give back more than gold in a risk-off event. Size accordingly.
Oil. WTI at $87.06 carries a geopolitical premium that is now explicit rather than latent. Secretary Bessent announced plans to economically isolate Iran, describing the intent as "the greatest coordinated economic isolation in the history of the world." The Strait of Hormuz has been effectively closed since 28 February 2026. That matters beyond the barrel price, and section 10 explains why: the Strait carries roughly 30% of the world's helium and the Gulf's sulfur exports, both of which are semiconductor inputs. Oil is a tactical position here, not a structural one, but the supply-chain read-through is structural.
FX. EUR/USD near 1.17 with the market firming its bets on ECB hikes is an underappreciated development. A hiking ECB against a Fed that cannot cut credibly at 3.3% core compresses the rate differential from the wrong side. USD/JPY at 158.86 keeps intervention risk live. A hawkish Warsh re-bids the dollar; a neutral one leaves the greenback under pressure from the fiscal side.
Bitcoin. A 22% week and the best weekly gain since November 2024, driven by genuine spot ETF inflows: $297.5m on 17 August, $186.4m on 18 August, $517m on 19 August, and $600m on 20 August. Friday itself was down 1.65%, which is the tell. This is a liquidity-and-flows move rather than a fundamental repricing, and flows reverse faster than fundamentals do. Treat strength as an opportunity to rebalance rather than to add leverage into a week with this calendar.
9. Trading strategy: taking money off the table, with the specifics
If you bought the mid-August dip in AI leadership, semiconductors and precious metals, this is a constructive week for partial profit-taking. The logic is not a view on direction. It is that reward-to-risk deteriorates when a dense event cluster sits immediately in front of price, and realised gains cannot be given back.
Implementation.
Scale out of 20% to 40% of profitable long positions in the most extended AI and semiconductor names before Wednesday's 08:30 print. The most extended, not the weakest.
Move stops on remaining core holdings to breakeven or to recent swing lows where market structure allows it.
Reduce gross leverage and short-dated options gamma into the Jackson Hole window, meaning Thursday's open through Friday's close.
Maintain or modestly add gold and silver. These have been the cleanest beneficiaries of the fiscal print and they hedge the specific risk that this week's data forces a repricing of the rate path.
Keep dry powder. The purpose of selling into Wednesday is to have something to buy on Thursday.
Treat Bitcoin as the high-beta expression of liquidity that it is. Use the 22% week to rebalance.
Three scenarios, with probabilities and the trade for each.
Scenario A: benign print, balanced Chair. Probability 35%. Core PCE comes in at 0.2% monthly or below with services decelerating, GDP is revised up modestly, Nvidia guides above $105bn, and Warsh reiterates data dependence without new framework language. Equity risk premia compress, the dollar softens, gold consolidates at elevated levels, Bitcoin resumes. The response is to redeploy a portion of the cash raised into the highest-conviction names on any residual weakness, keeping the precious-metals hedge intact.
Scenario B: sticky inflation, hawkish framing. Probability 40%. Core PCE prints 0.3% monthly with services leading, or the year-over-year rate rounds to 3.4%, and Warsh uses the keynote to talk about a structurally higher neutral rate or the risk of premature easing. Long-duration growth sells off hardest, the dollar firms, and gold dips before attracting renewed safe-haven demand. The response is to respect the stops already placed, avoid adding to the most extended names, and add to gold and short-dated Treasuries as volatility rises. Note that we place this above Scenario A, which is a change from the weekend draft. The nowcast data and the 4.3% household inflation expectation are the reason.
Scenario C: mixed data, neutral policy. Probability 25%. The print is close to consensus with mixed composition, Nvidia is fine but not spectacular, and Warsh says little that is new. Markets grind sideways with elevated intraday volatility. Historically this is the most common Jackson Hole outcome. The response is patience, selective option overlays if available, and waiting for the following week.
Across all three, the structural allocation to AI infrastructure and fiscal-hedge real assets survives the week intact. Only the tactical sleeve is being managed around the event risk. That distinction is the whole discipline.
10. The AI sector, read as a graph rather than a list
Single-stock analysis cannot see concentration risk, because concentration is a property of the relationships between names rather than of any one name. So we do not analyse the AI sector as a list of tickers. We maintain it as an ontology: every datum is a typed claim carrying a source, an as-of date, a confidence level and a basis. As of 22 August 2026 that graph holds 387 entities, 851 claims, 40 findings and 16 analyst rows, with 797 claims carrying a source link. It is public at kxco.ai/ontology-live and mirrored into Neo4j for path analysis.
The three figures below are queries against that mirror, not illustrations. The Cypher behind each is stated so the result can be reproduced rather than taken on trust.
Figure 1: one vendor is named in 9.5% of the entire sector
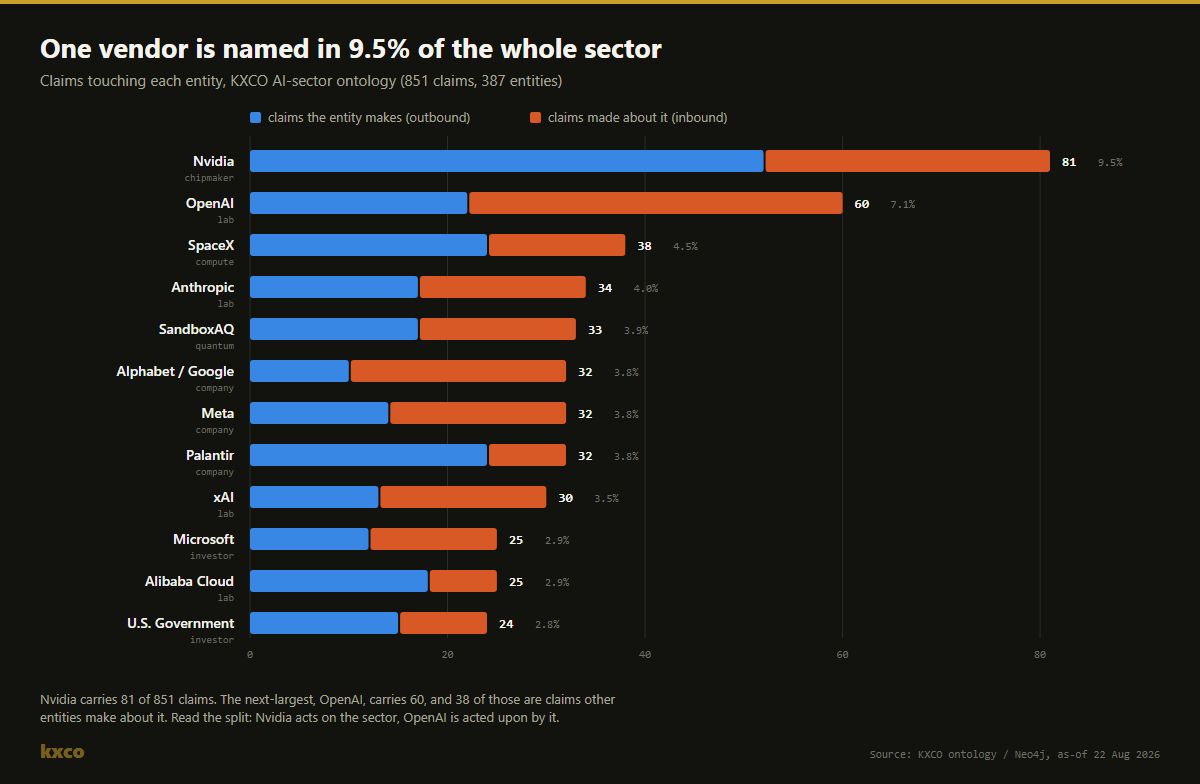
Nvidia is touched by 81 of the 851 claims in the graph, 9.5% of everything the sector asserts. It makes 52 claims outward and receives 29 inward. OpenAI is second at 60, but the split inverts: 38 of OpenAI's 60 are claims other entities make about it. Read the asymmetry rather than the totals. Nvidia acts on the sector. OpenAI is acted upon by it. That is what a supplier of a scarce input looks like next to a consumer of it.
The practical consequence for a portfolio is that Nvidia exposure is not a position, it is a factor. Any book with meaningful weight in the AI complex is long Nvidia several times over: directly, through the clouds that buy its chips, through the labs whose economics depend on chip availability, and through the memory and packaging names whose order books it sets. When we size Nvidia we are sizing the correlation of the whole sleeve.
Figure 2: the circular layer, and its change of character
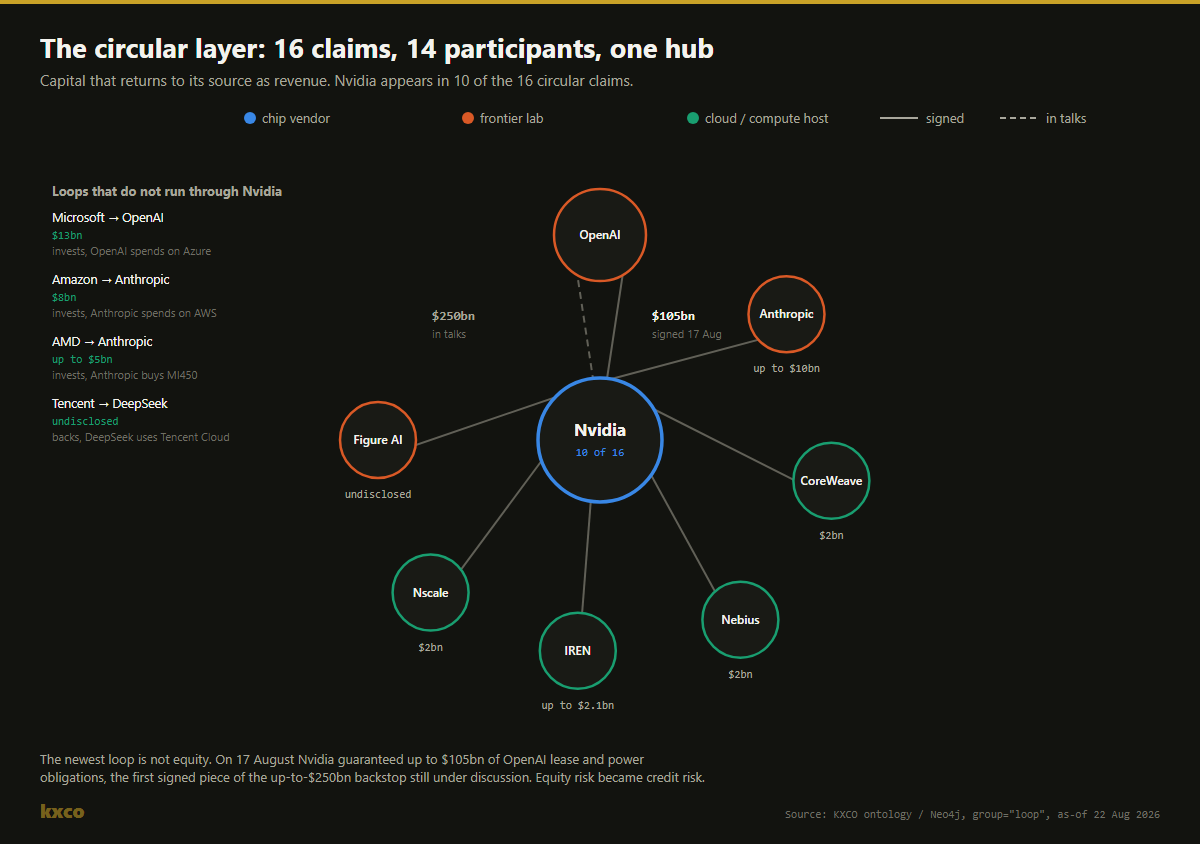
The graph isolates 16 claims as circular: capital that returns to its source as revenue. Fourteen entities participate and Nvidia appears in 10 of the 16. The pattern is straightforward. A chip vendor invests in the customers that buy its chips. Investors fund the labs that spend the money back on the investors' clouds.
The important development is not the amount, it is the instrument. Through 2025 and most of 2026 these loops were equity. In late July, Nvidia and OpenAI were reported to be discussing a backstop of up to $250bn that would let OpenAI raise debt on the strength of Nvidia's credit to fund a 10GW campus in Pike County, Ohio. On 17 August the first piece was signed: Nvidia guaranteed up to $105bn of OpenAI's conditional lease and power obligations to SB Energy.
Equity risk and credit risk behave differently under stress. An equity stake that goes to zero costs you the stake. A guarantee that is called costs you cash at precisely the moment your customer cannot pay, which is also the moment your own revenue is falling. That is a correlated exposure, and it is new to the sector's balance sheets this quarter. This is the single most important thing to have understood before Wednesday evening's call.
Four of the 16 loops do not involve Nvidia: Microsoft into OpenAI at $13bn with the spend returning through Azure, Amazon into Anthropic at roughly $8bn returning through AWS, AMD into Anthropic at up to $5bn against MI450 purchases, and Tencent behind DeepSeek with the compute running on Tencent Cloud. The pattern is structural to the industry, not specific to one vendor.
Figure 3: the chokepoints nobody quotes outrank the one everybody does
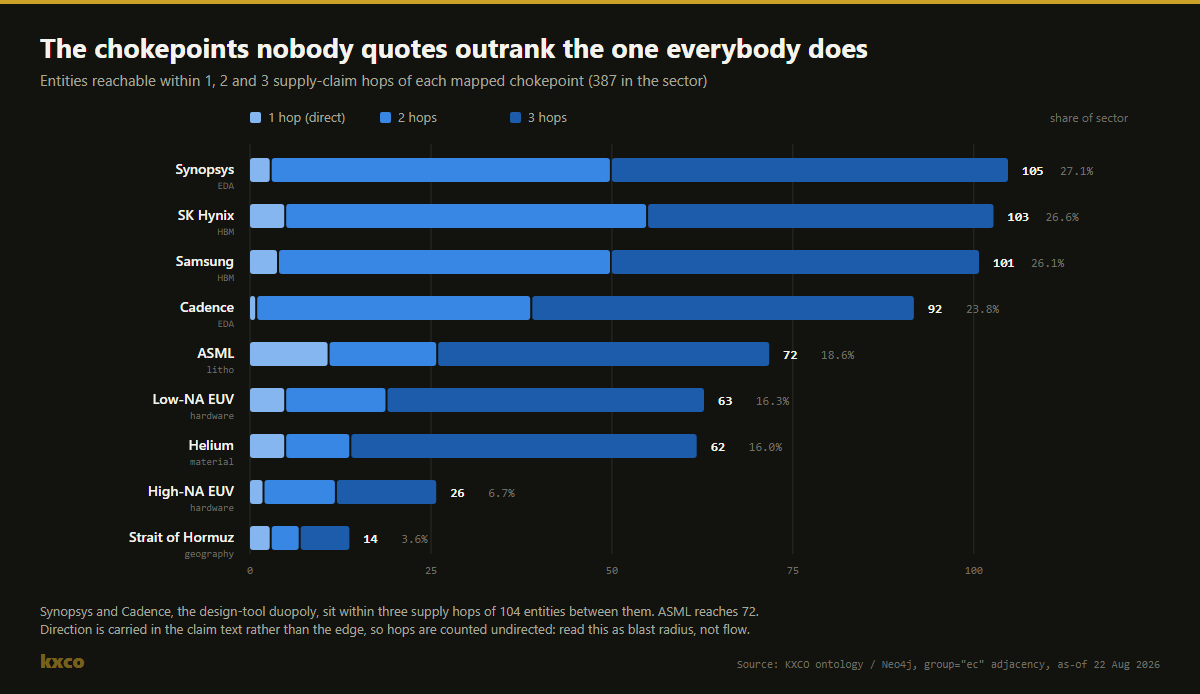
The graph flags nine entities as chokepoints. For each, we counted the entities reachable within one, two and three supply-claim hops. Because the direction of a supply relationship is carried in the claim text rather than in the edge itself, hops are counted undirected. Read the result as blast radius rather than as flow.
Chokepoint | Category | 1 hop | 2 hops | 3 hops | Share of 387 |
|---|---|---|---|---|---|
Synopsys | EDA | 3 | 50 | 105 | 27.1% |
SK Hynix | HBM | 5 | 55 | 103 | 26.6% |
Samsung Electronics | HBM | 4 | 50 | 101 | 26.1% |
Cadence | EDA | 1 | 39 | 92 | 23.8% |
ASML | Lithography | 11 | 26 | 72 | 18.6% |
Low-NA EUV (NXE) | Hardware | 5 | 19 | 63 | 16.3% |
Helium, semiconductor grade | Material | 5 | 14 | 62 | 16.0% |
High-NA EUV (EXE) | Hardware | 2 | 12 | 26 | 6.7% |
Strait of Hormuz | Geography | 3 | 7 | 14 | 3.6% |
Three findings come out of this that are not in the consensus narrative.
The design-tool duopoly is the largest single chokepoint in the sector, and nobody writes about it. Synopsys reaches 105 entities within three hops and Cadence reaches 92. Their union covers 104 distinct entities, 26.9% of the graph. No leading-edge chip gets designed without their tools, and the concentration is at least as tight as lithography. Yet the sell-side conversation about supply-chain risk is almost entirely about ASML and TSMC. If you want exposure to the AI build-out that is not already crowded, the EDA layer is where the map says to look.
Memory is the near-term constraint and the map agrees with the earnings calls. SK Hynix and Samsung reach 103 and 101 entities respectively, 102 in union, 26.4% of the graph. This aligns exactly with what the companies themselves are saying about HBM allocation and with SpaceX's framing of 20% annual memory growth against 200% demand growth. It also explains why the last week of July repriced the whole complex: more than $1 trillion came off the sector's chip names, with Nvidia down $238bn, SK Hynix down $176bn, Samsung down $173bn and Micron down $113bn, and both AMD and TSMC shedding over $100bn each. The stated cause was not weakening demand. It was a repricing of expectations.
A geographic chokepoint sits upstream of every technological one. The Strait of Hormuz shows the smallest blast radius in the table at 14 entities, which is exactly why it is dangerous. Its exposure is not captured by supply-claim adjacency, because it is an input to inputs: roughly 30% of the world's helium and the Gulf's sulfur exports move through it, and it has been effectively closed since 28 February 2026. Helium alone reaches 62 entities in the graph, 16% of the sector. A map that only counts direct relationships understates geography systematically. This is the one row in the table to read as a floor rather than an estimate.
The capex question underneath all of it
Amazon, Alphabet, Meta and Microsoft together guide to roughly $725bn of AI capital spending in 2026, up about 77% from roughly $410bn in 2025. Alphabet alone spent $44.9bn in Q2, double the prior year, and guides $195bn to $205bn for the full year. Microsoft guides FY2027 to $255bn to $260bn. Meta's free cash flow fell 91% on the capex line.
Capex is compounding faster than the revenue behind it. That is not a prediction of failure, it is a description of a duration mismatch: the spending is immediate, the revenue is deferred, and the gap is being financed. Which brings the story back to figure 2, and to the reason a chip vendor is now guaranteeing power bills.
On energy, the constraint is real and the answer is late. The hyperscalers have contracted up to 13GW of nuclear capacity, split roughly evenly between power purchase agreements on existing plants and direct partnerships funding new build. Meta leads by volume at up to 6.6GW across Constellation, Vistra, TerraPower and Oklo. Amazon holds 1.9GW at Susquehanna. Against demand projections to 2035, that 13GW is under 20% of what is needed. Data centres consumed about 4.4% of US electricity in 2023 and credible projections put them at 6.7% to 12% by 2028. The US is adding power at roughly 22% a year toward 90GW or more by 2030.
11. The buy list, with the real numbers
The full analyst layer of the ontology, restamped to the 21 August 2026 close. Sixteen public majors, average 12-month consensus upside of 34.0%, one Hold rating in the set.
Ticker | Company | Rating | Price | Target | Upside | P/E | The operating fact |
|---|---|---|---|---|---|---|---|
Oracle | Buy | $146 | $246 | +68% | 25.1x | OCI +47%. RPO $638bn, up $85bn in the quarter | |
Baidu | Buy | $93 | $151 | +62% | N/A (loss) | TTM swung to a loss on AI spend. Street split, MS at $80 | |
Alibaba | Strong Buy | $119 | $189 | +59% | 27.2x | Cloud +45%, margins compressed by capex | |
Cerebras Systems | Strong Buy | $196 | $292 | +49% | N/A (loss) | Q2 beat, FY26 guide $880m to $890m, CS-4 unveiled | |
0700.HK | Tencent | Strong Buy | HK$451 | HK$666 | +48% | 15.6x | Revenue +11%, capex +176% on the AI push |
NVIDIA | Strong Buy | $215 | $305 | +42% | 32.9x | Data centre +78% YoY. Reports 26 August | |
Meta | Strong Buy | $550 | $754 | +37% | 20.7x | Revenue +28%, free cash flow -91% on capex | |
Advanced Micro Devices | Strong Buy | $473 | $613 | +30% | 121x | Up to 2GW MI450 to Anthropic, ~6GW to OpenAI | |
Intel | Hold | $90 | $115 | +28% | N/A (loss) | $20bn raise. Socionext signs for 18A-P | |
Amazon | Strong Buy | $259 | $327 | +26% | 20.8x | AWS +37%, fastest since 2021 | |
ASML Holding | Strong Buy | $1,764 | $2,195 | +24% | 55.7x | Sole EUV and High-NA source. FY26 guide raised | |
Alphabet | Strong Buy | $345 | $428 | +24% | 17.3x | Cloud +82% to $24.8bn | |
Microsoft | Strong Buy | $483 | $570 | +18% | 26.9x | Azure +43%. Copilot at 30m seats | |
Arm Holdings | Buy | $243 | $286 | +17% | 248x | Royalties +22%, targets trimmed post-print | |
Palantir | Buy | $180 | $192 | +7% | 154x | Revenue +93%, US commercial +149%, 154x earnings | |
Apple | Buy | $309 | $326 | +5% | 35.5x | Partners on models, no frontier LLM of its own |
What we are buying, and why.
$ORCL carries the widest upside in the set and the operating story now supports it in a way the sell-side has been slow to restate. Remaining performance obligations reached $638bn at the fiscal Q4 print, having grown $85bn in a single quarter from $553bn. The funding objection to that backlog has a specific answer: Oracle has stated that most of the RPO increase relates to contracts where the customer prepaid for GPU purchases or bought and supplied the GPUs directly, so the company does not expect to raise incremental funds to service them. At 25.1x forward with OCI growing 47% and the stock down roughly 35% year to date, this is the clearest risk-reward on the list. Note the connective tissue with section 13: Oracle is also where the first commercial quantum system landed inside an AI data centre.
$AMD is the addition to this list that the weekend draft omitted, and it belongs. The up-to-2GW MI450 agreement with Anthropic plus up to $5bn of equity, and roughly 6GW to OpenAI, make AMD the first credible second source at the frontier-lab tier. That is the only genuine mitigant to the concentration risk figure 1 measures. At 121x it is priced for the transition rather than for the current book, so this is a smaller position sized against execution risk rather than a core holding.
$ASML deserves its place despite the narrowest-looking narrative. Sole source on EUV and High-NA, a raised FY26 guide, and a July capacity announcement adding 30% more Low-NA EUV and DUV immersion for 2027 with a further 30% under evaluation. Figure 3 shows ASML's blast radius is smaller than the EDA and memory chokepoints, which is a point about the map rather than about the company: ASML's exposure is depth, not breadth. It is the single hardest link to replace in the chain.
$BABA and 0700.HK are the China expression. Alibaba at 27.2x after the capex-crush selloff with cloud growing 45%, and Tencent at 15.6x, below its five-year average, while capex rises 176%. Both are constructive. Both carry policy risk that a US-listed name does not, and Tencent requires the ability to hold Hong Kong shares.
$CBRS is the only listed wafer-scale alternative to the GPU architecture. The 750MW OpenAI agreement and AWS distribution are rotating the revenue base away from the UAE concentration it listed with, where 86% of FY25 revenue originated. It remains loss-making on a GAAP basis. Small position, binary outcome, real optionality.
What we are not buying, and why that matters more.
$PLTR at +7% upside and 154x earnings is the discipline test. Revenue grew 93% and US commercial grew 149%, which is the fastest growth on this list by a wide margin. It is also priced for all of it. A name can be an excellent business and a poor position at the same time, and conflating the two is the most common error in thematic investing.
$AAPL at +5% and $ARM at 248x are in the same category for different reasons. Apple partners on models rather than building a frontier one, which may prove wise and is not currently a growth driver. Arm's royalty growth is real and its multiple has no room for a miss.
$INTC is the single Hold in the set. The $20bn raise and the Socionext signing for 18A-P foundry are genuine progress, and 28% upside on a Hold rating tells you the Street does not believe the execution yet. We do not either.
12. The scorecard, because a screen without one is a marketing document
We ran this table as a screen on 24 July and measured it to the 21 August close. Every name with 35% or more consensus upside was a pick. The results:
Cohort | 30-day return |
|---|---|
The screen (upside ≥ 35%) | +14.2% |
The full 16-name table | +7.1% |
The names the screen excluded | +1.1% |
Five of the six picks were positive, with Palantir the strongest at +36.3%. The worst performer in the whole table was Meta at -19.3%, and Meta was rated Strong Buy but excluded by the upside threshold, which is the single most instructive result in the set: the threshold did the work, not the rating.
Two honest caveats. One month is not a track record, it is a datapoint. And the same screen run today produces a different portfolio, because Palantir has run to +7% upside and Meta has fallen to +37%. The screen rotates by construction, which is the point of it, and it means the 30-day result is a property of the method rather than of the names.
13. Quantum: the week it became a line item in a cloud bill
Quantum computing remains earlier in the commercial curve than AI and belongs in most portfolios as a longer-duration thematic allocation rather than a core position. The developments in the last two weeks are worth reading anyway, because one of them changes the distribution channel.
Quantinuum and Oracle put Helios inside an AI data centre. Helios is a 98-qubit trapped-ion system providing 48 logical qubits at 99.921% two-qubit fidelity, and it is being deployed inside an Oracle AI data centre as a managed OCI service. That is the structural news. Quantum stops being a lab visit and becomes a line on a cloud invoice, sold through the same channel and to the same buyer as GPU capacity. It is also a second reason to hold $ORCL.
D-Wave and NTT DOCOMO moved a second application into production. Announced 18 August, the application cut peak location-registration signalling by 65.3% and paging signals by 7.0% across DOCOMO's mobile network. This is among the clearest commercial deployments of annealing-based quantum computing anywhere, and it is production traffic rather than a pilot.
Pasqal trapped individual atoms on a photonic chip. On 10 August, using photonic integrated circuits from its Aeponyx subsidiary, Pasqal held individual rubidium atoms with lifetimes matching bulk optics, replacing bulk optical assemblies with silicon nitride photonics. The significance is footprint: this is the path to the company's stated target of 10,000 physical atoms and 100 logical qubits.
The error-correction and scaling picture. Q-CTRL executed a 100-qubit Quantum Fourier Transform on IBM Heron hardware using convolutional compilation, reaching 11.4% process fidelity at 50 qubits with the correct frequency still distinguishable at 100. Yonsei University will install IBM's Nighthawk processor, only the second such deployment worldwide. On the two-stack picture, the US leads on error correction with Google's 105-qubit Willow demonstrating below-threshold correction and IBM's 120-qubit Nighthawk targeting fault tolerance by 2029, while China leads on scale and commercial deployment with USTC's 105-qubit Zuchongzhi 3.0 advantage claim and Origin Quantum's 180-qubit Wukong-180.
Commercial traction is showing up in revenue. Infleqtion posted Q2 revenue of $12.6m, up 116% year over year, raised full-year guidance to roughly $43m, and secured a letter of intent for up to $100m of proposed Commerce Department funding. State and sovereign money keeps arriving: Utah launched a Quantum Initiative by executive order, Canada established a C$20.3m quantum defence hub, and Quantum Australia reported $83.1m of economic impact across fifteen companies.
Post-quantum cryptography is moving from standard to silicon. Google announced that Tensor G6 and Titan M3 will integrate post-quantum cryptography in Pixel 11 silicon. QuSecure's post-quantum platform is now available on Carahsoft's GSA schedule for federal procurement. BTQ and Taiwan's ITRI validated a QCIM core meeting NIST post-quantum standards. The investable observation from our own graph is a concentration one: SandboxAQ now sits at the single intersection of the US and allied post-quantum transition, spanning Department of War CIO cryptographic migration, DIU quantum navigation, a $500m Commerce materials award, NATO DIANA and White House PQC executive-order implementation. In the ontology it carries 33 claims, ranking fifth in the entire sector, ahead of Microsoft. A single private company being that central to allied cryptographic readiness is itself a systemic finding.
14. What would change our mind
A research note that cannot be falsified is an opinion. Here is what would break the positions above.
The AI thesis breaks if Nvidia guides FQ3 below roughly $95bn on demand rather than supply, or if memory allocation commentary implies the constraint is binding through 2027. Either would mean the capex cycle is being rationed by physics rather than by choice, and the second-derivative trade on the whole complex turns.
The gold thesis breaks if core PCE prints 0.1% monthly two months running and the 30-year yield falls back through 5%. That combination would mean the fiscal premium is compressing on genuine disinflation, which is the one environment where real assets underperform financial ones.
The rotation thesis breaks if the payrolls benchmark revision on Friday is large and negative. A labour market that has been materially weaker than reported all year changes the Fed's reaction function faster than any inflation print, and it would make duration the trade rather than equities.
The concentration risk is overstated if AMD's MI450 ramp with Anthropic and OpenAI delivers on schedule. Figure 1 measures the sector as it is claimed today. A genuine second frontier source would redraw it, and that is the single most consequential thing that could happen to this map in the next twelve months.
15. Operational checklist
Check the calendar and live updates each morning at livetradingnews.com/trading, and again before the 08:30 releases.
Take partial profits on the most extended AI and semiconductor longs before Wednesday's 08:30 print. Tighten stops on what remains.
Read the services component of core PCE before trading the headline.
Do not carry oversized AI exposure into Wednesday's close. Nvidia reports that evening.
Maintain or modestly increase gold and silver as structural hedges against fiscal and geopolitical risk.
Reduce gamma and gross leverage from Thursday's open through Friday's close.
Watch the payrolls benchmark revision at 08:30 on Friday, 90 minutes before the Chair speaks.
Monitor the sector map continuously at kxco.ai/ontology-live rather than reacting to single-name headlines.
Respect Bitcoin's high-beta character. Use the 22% week to rebalance, not to lever.
Size every position so that no single print or comment can force liquidation of the broader thesis.
The noise across the next five sessions will be high. The signal, that AI infrastructure demand is real and that the fiscal arithmetic has changed the discount rate permanently, is unchanged by any single print. Manage the week with process rather than with opinion.
Stocks mentioned in this article: $NVDA, $ORCL, $AMD, $ASML, $META, $MSFT, $GOOGL, $AMZN, $BABA, $BIDU, $CBRS, $PLTR, $INTC, $AAPL, $ARM, $MU, $TSM, $SPCX, $QBTS and $CRM.
Shayne Heffernan, Ph.D., is the founder of Live Trading News, the KnightsBridge Group, Knightsbridge Law and the KXCO.ai ecosystem spanning post-quantum cryptography, identity, attestation and enterprise ontology.
This research is for informational purposes only and does not constitute investment advice. Markets can and do gap through levels. Past performance is not indicative of future results. Conduct your own due diligence and consult a qualified adviser before making investment decisions. All figures are as of the 21 August 2026 close unless stated otherwise. Graph analysis is derived from the KXCO AI-sector ontology as of 22 August 2026.
Sources
US Treasury, total public debt outstanding above $40.05 trillion, reported 19 August 2026. Coverage: CNBC, NPR, Al Jazeera.
Federal Reserve Bank of Kansas City, 2026 Jackson Hole Economic Policy Symposium, 27 to 29 August, theme "Financial Innovation: Implications for Payments and Policy", Chair Warsh keynote Friday 28 August.
Newsquawk weekly economic calendar, 24 to 28 August 2026 and FinancialJuice week ahead, US indicators.
Core PCE at 3.3% in June 2026, Advisor Perspectives; July nowcast and market pricing, Polymarket core PCE YoY July 2026.
Closing levels and weekly performance, 21 August 2026, Yahoo Finance market live blog.
Gold $4,590.51 and silver $69.63, USAGOLD daily market report, 21 August 2026.
Nvidia FQ2 FY2027 consensus and guidance, Finance Calendar and REX Shares Nvidia earnings preview.
Oracle remaining performance obligations, Oracle Q4 and FY2026 results.
Bitcoin spot ETF flows, CoinDesk, 20 August 2026.
D-Wave and NTT DOCOMO second production application, D-Wave newsroom, 18 August 2026.
Quantum milestones for the week ending 15 August 2026, The Qubit Report.
Nvidia and OpenAI backstop discussions, CNBC, 27 July 2026; the July chip repricing, CNBC, 29 July 2026.
AMD and Anthropic MI450 partnership, AMD investor relations.
Hyperscaler nuclear commitments against US energy realities, Carnegie Endowment, June 2026.
Helium, Hormuz and the chip supply chain, Gowling WLG, 2026.
KXCO AI-sector ontology, 387 entities and 851 claims as of 22 August 2026, kxco.ai/ontology-live. Figures 1 to 3 are Cypher queries against the Neo4j mirror of that graph.
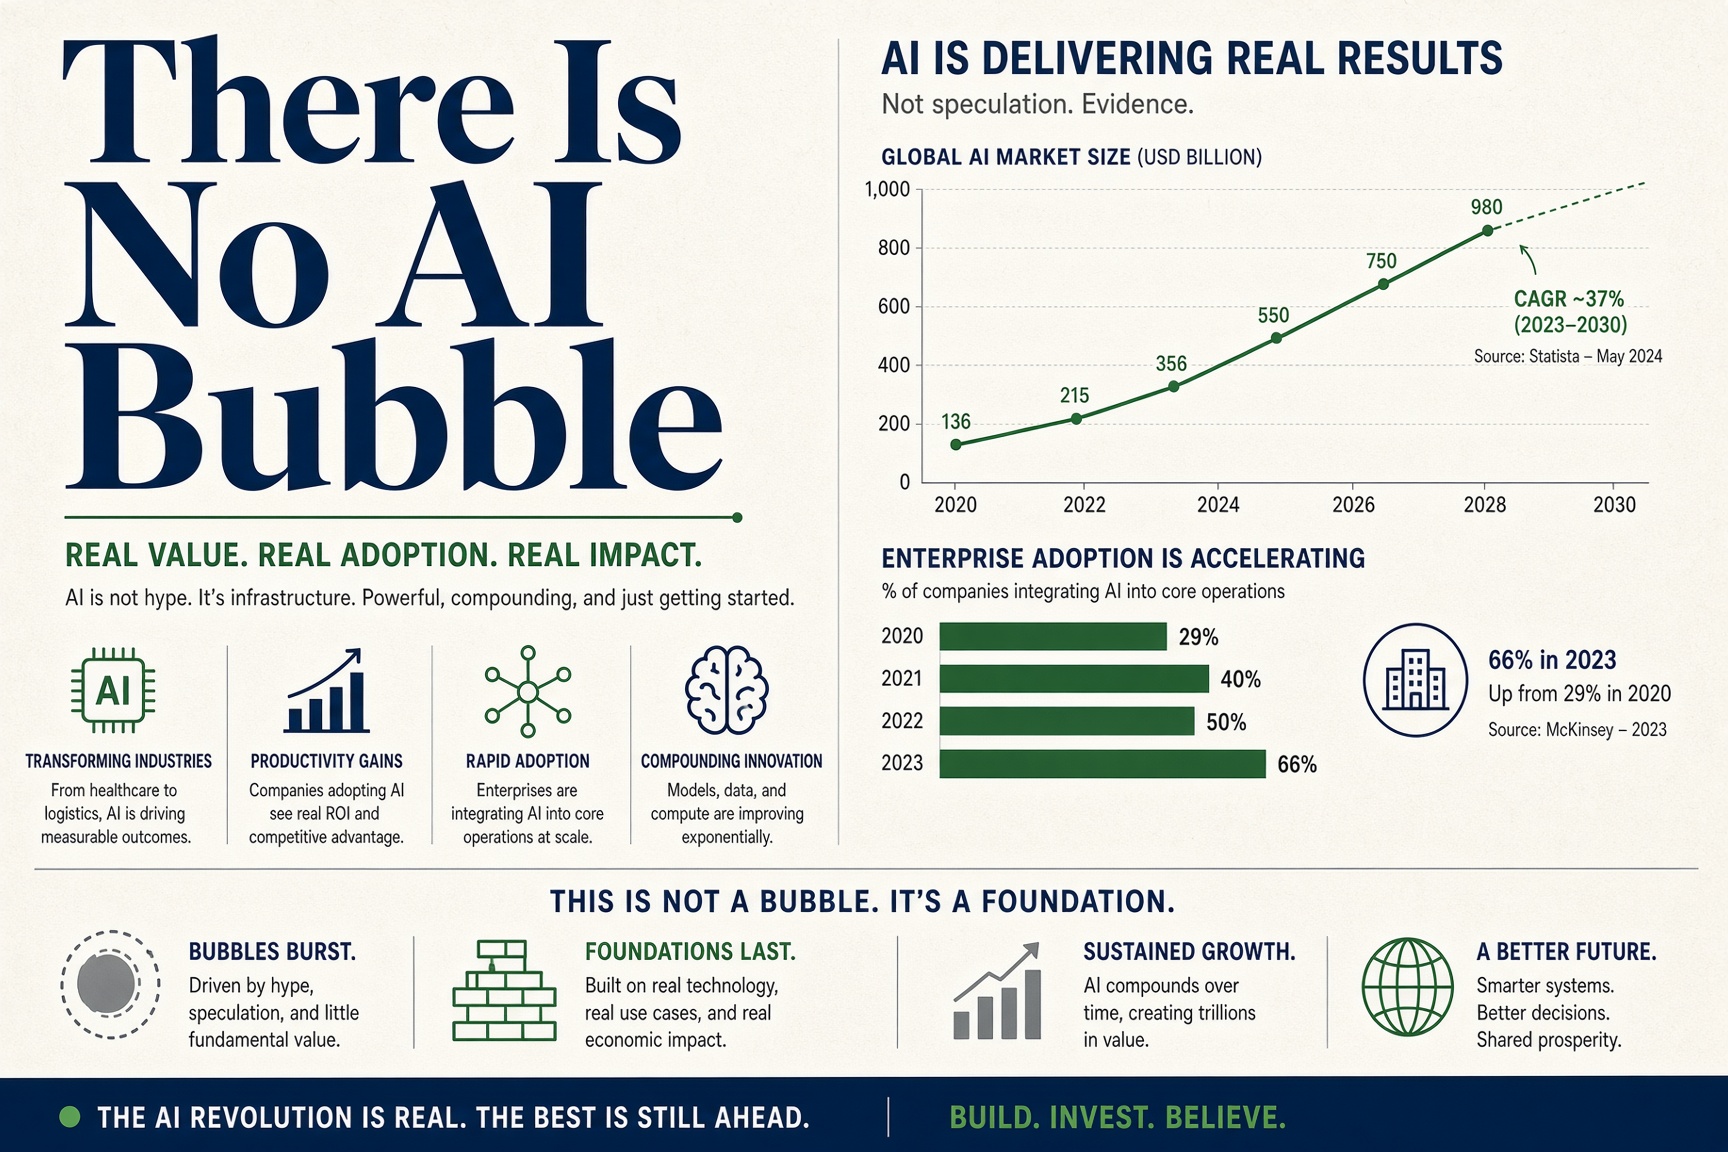
There Is No AI Bubble
There is no AI bubble. A bubble is capacity nobody uses, demand nobody signs for and a glut when the building stops. KXCO's AI sector ontology, refreshed on 7 October 2026, finds the reverse: adoption rising on six independent measures, about $2.35tn of contracted backlog at the four largest sellers of compute per their own reports, and supply rationed at every layer. It keeps the bear case in the same record, 20 circular capital claims, and answers it.

Weekly Market Outlook: Fed Minutes, Anthropic and OpenAI IPOs, Gold, Bitcoin, FX
The Fed raised rates in September and payrolls rose 29,000, per the Labor Department. This week the FOMC minutes, three Treasury auctions and a 10-year near 5.3 percent test that gap. Anthropic's IPO clock runs toward a 14 October investor day while OpenAI's chief executive says not 2026. Gold sits 26 percent below its record, bitcoin near $85,500, the dollar up three weeks running. Two knowledge graphs from KXCO's records map the IPO backers and the FDA board.
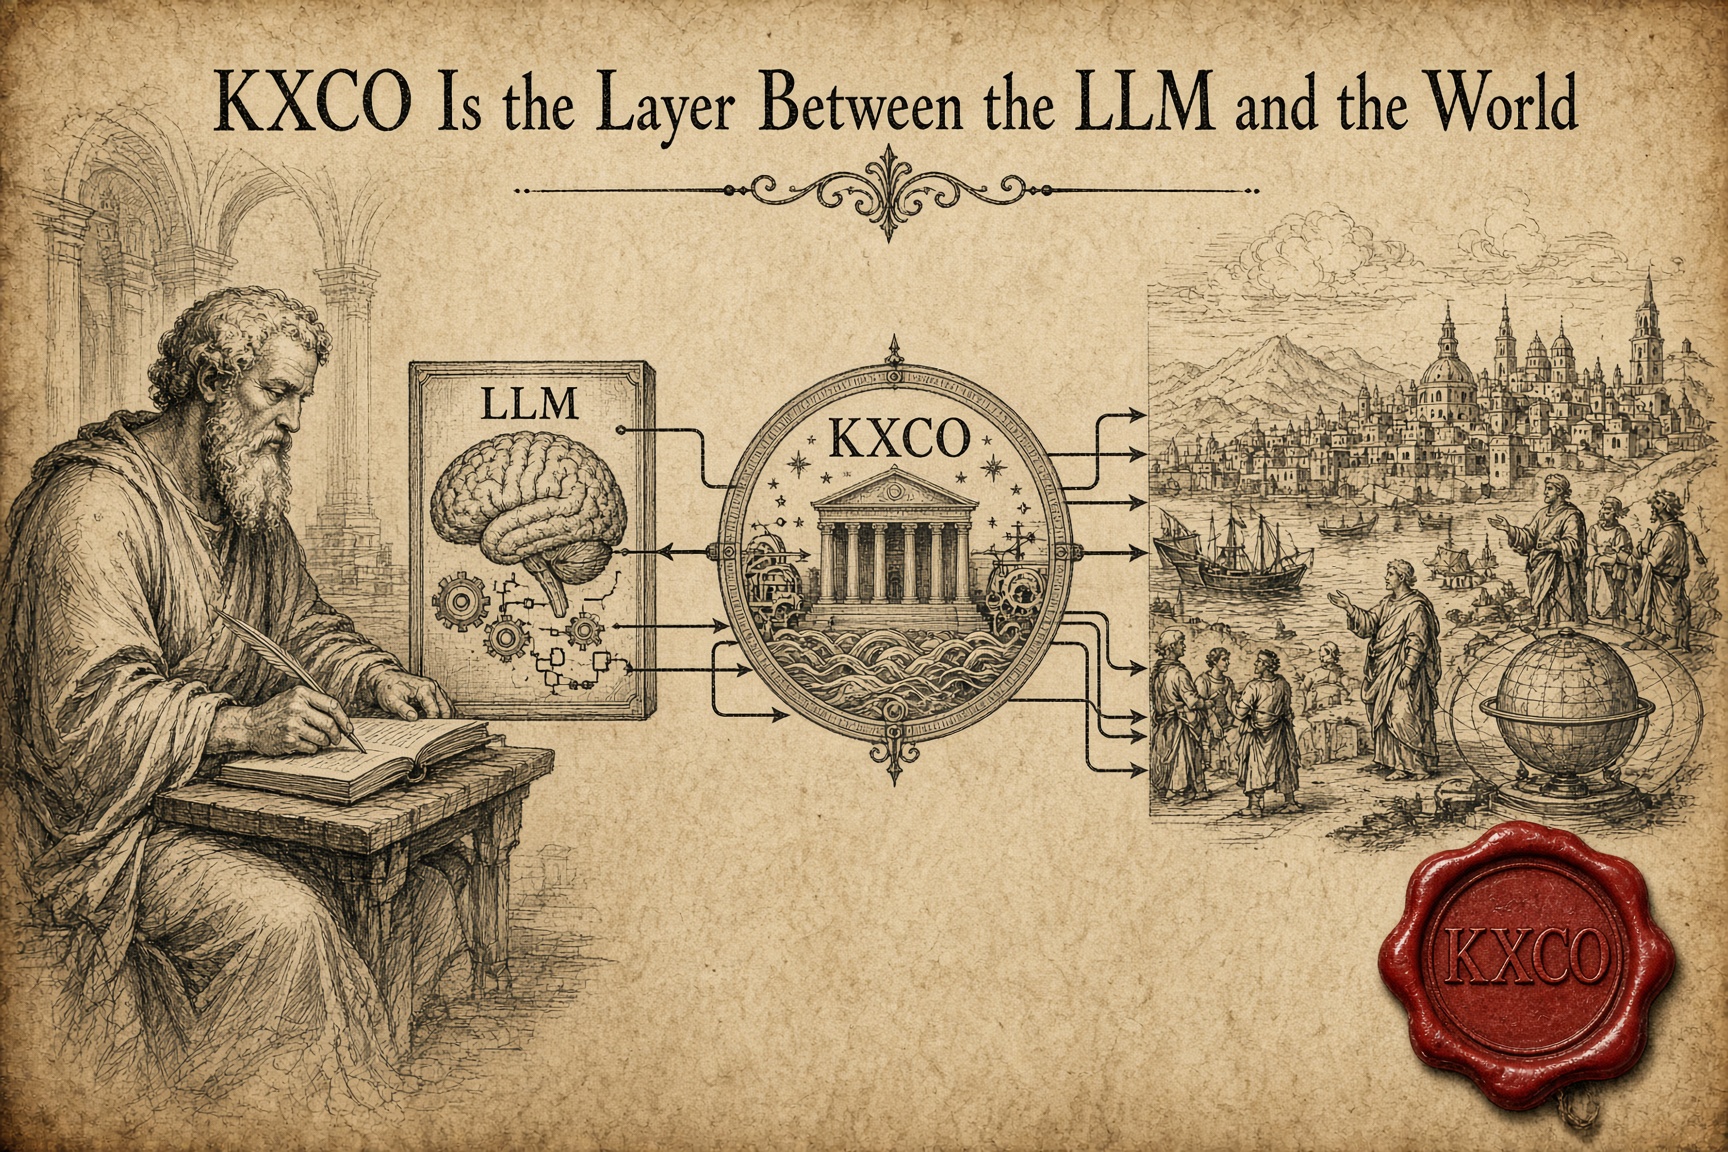
KXCO Is the Layer Between the LLM and the World
Give a hundred people the same book and very few will act on it. AI is that book: it distributes access, not understanding, and an institution cannot act on a paragraph. KXCO does not build another model or another agent. It builds the layer between the model and the world: who is speaking, what they are allowed to do, what they committed, and a post-quantum signature a stranger can check without asking us.
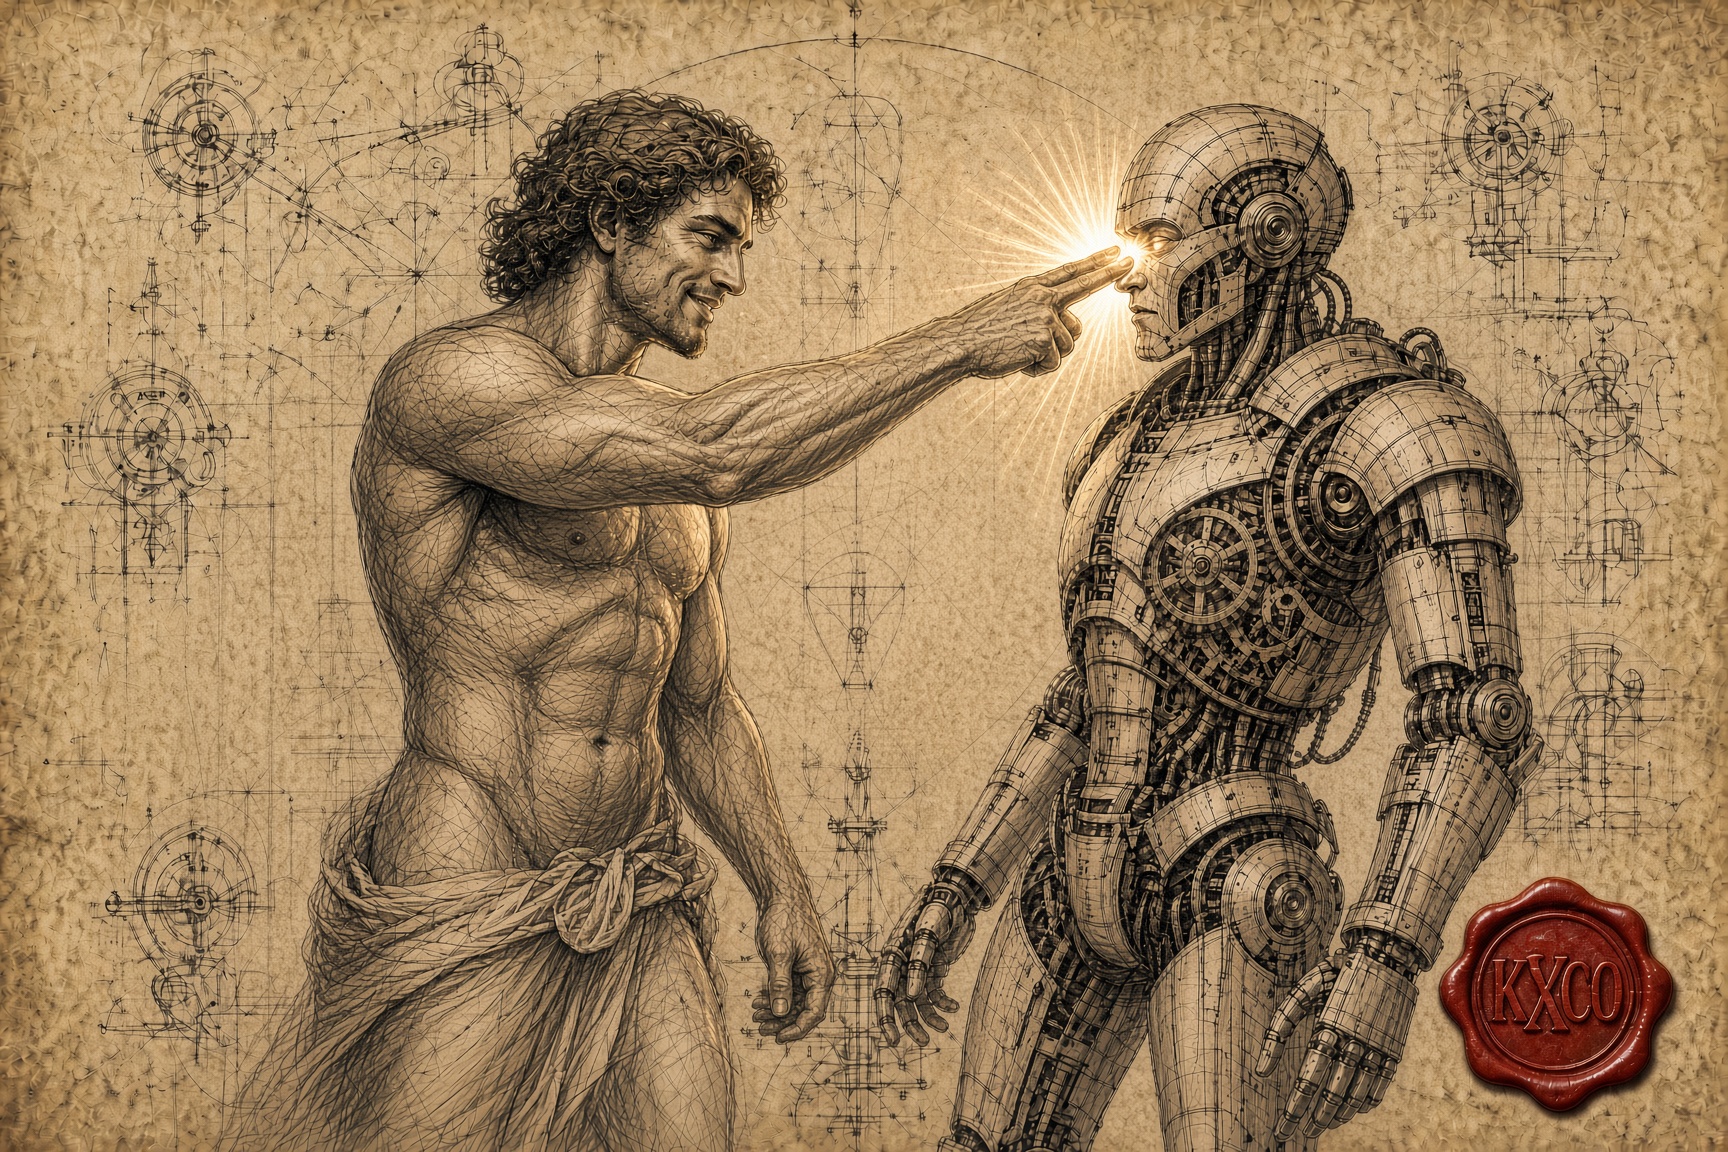
Thoughts on Thinking in an AI World
A model will write an answer about anything in seconds. What an AI world makes scarce is everything around the answer: what you believed last month and why you changed it, the link between fields nobody reads together, and a decision a named person can stand behind. Three knowledge-graph exhibits from the KXCO record show each one, from a reported Nvidia deal that became a signed 8-K to a war five links from a data centre.
Every story, signed and delivered.
Subscribe to the kxco channel and get the headline, the AI-written key takeaways, and the chain-anchor link the moment we publish. Audio versions and per-ticker subscriptions arrive in the next iteration.