
Bitcoin is a Buy based on Momentum, Momentum is a general term used to describe the speed at which prices move over a given time period.
Generally, changes in momentum tend to lead to changes in prices. This shows the current values of four popular momentum indicators and they indicate a buy.
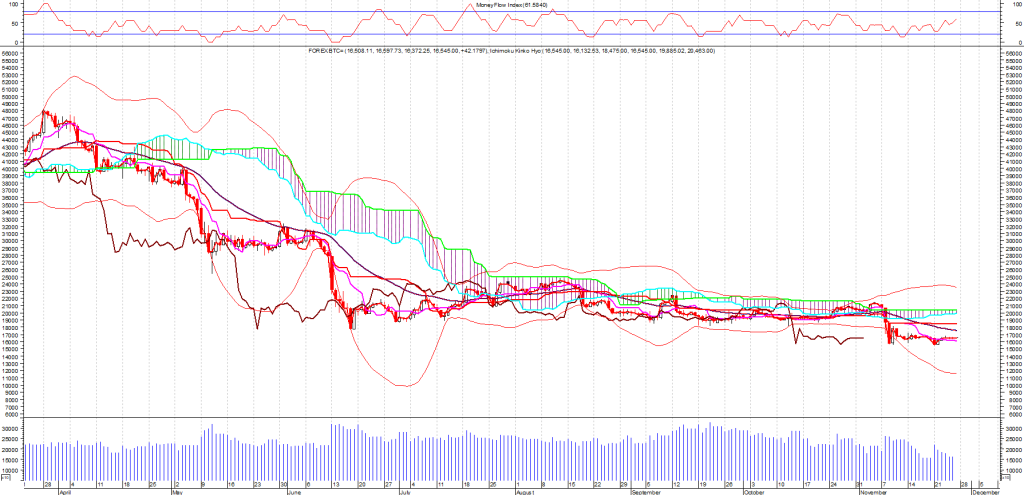
Bitcoin is currently 24.3% below its 200-period moving average and is in an downward trend. Volatility is high as compared to the average volatility over the last 10 periods.
Our volume indicators reflect volume flowing into and out of Bitcoin at a relatively equal pace (neutral). Our trend forecasting oscillators are currently bearish on Bitcoin and have had this outlook for the last 18 periods.
Our momentum oscillator has set a new 14-period high while the security price has not. This is a bullish divergence.
Pivot Point Resistance and Support
The first weekly resistance level is at 17,045.95 while the second resistance level at 17,843.91. The first weekly support level is at 15,618.52 while the second support level is at 14,989.05.
. An important indicator for Elliott waves, the Elliott oscillator is at -1,145.38, in negative territory; this is a bearish sign. An equally important indicator, the STORSI is at 97.85. This value is in the overbought territory.
Stochastic Oscillator
One method of interpreting the Stochastic Oscillator is looking for overbought areas (above 80) and oversold areas (below 20). The Stochastic Oscillator is 74.7696. This is not an overbought or oversold reading. The last signal was a buy 5 period(s) ago.
Relative Strength Index (RSI)
The RSI shows overbought (above 70) and oversold (below 30) areas. The current value of the RSI is 41.17. This is not a topping or bottoming area. A buy or sell signal is generated when the RSI moves out of an overbought/oversold area. The last signal was a buy 17 period(s) ago.
Commodity Channel Index (CCI)
The CCI shows overbought (above 100) and oversold (below -100) areas. The current value of the CCI is 14. This is not a topping or bottoming area. The last signal was a buy 4 period(s) ago.
MACD
The Moving Average Convergence/Divergence indicator (MACD) gives signals when it crosses its 9 period signal line. The last signal was a buy 4 period(s) ago.
Candlesticks
A white body occurred (because prices closed higher than they opened).
During the past 10 bars, there have been 5 white candles and 5 black candles. During the past 50 bars, there have been 23 white candles and 27 black candles for a net of 4 black candles.
A spinning top occurred (a spinning top is a candle with a small real body).
Spinning tops identify a session in which there is little price action (as defined by the difference between the open and the close). During a rally or near new highs, a spinning top can be a sign that prices are losing momentum and the bulls may be in trouble.