
KXCO and the Nvidia Rally
Round Table performance, measured in the open against the KXCO ontology: the picks, the print, and the misses
Part of theAI Stocks Center
On the evening of 26 August 2026 Nvidia reported revenue of $96.2 billion for a single quarter. The next day the stock rose 8.74% to $227.98 and added about $442 billion of market value, the second-largest one-day gain by any company in the history of the stock market. That is the headline everyone has now read.
This article is about something narrower and, I think, more useful. Five weeks earlier, on 24 July, Live Trading News and the KXCO live ontology of the AI sector put a table on the public internet with Nvidia at $203, rated Strong Buy, with consensus upside near 49%, and a one-line reason. We then held that view through the worst month for chip stocks since 2008, restated it four times as the price moved, and wrote on the record, three days before the print, that the 26 August report was "the sector's single largest scheduled datapoint."
Anyone can say they called a rally after it happens. The point of publishing the table, the reasoning and the dates in advance, in a machine-readable graph that anyone can download, is that the claim can be checked. So here is the check: what the ontology said before, what the market did after, the full scorecard of every name on the table including the ones that went the wrong way, and what changed in the graph today as a result.
The live map is at kxco.ai/ontology-live. Every figure in this piece that comes from the graph was produced by a Cypher query against it, and the queries are printed here so you can run them yourself against the downloadable export.
What the graph said before the print
The KXCO ontology is not a stock-picking model. It is a typed record of who depends on whom in the AI sector: which company supplies which, who invested in whom, who guarantees whose debt, who sits on whose board, what is a chokepoint and what merely looks like one. As of this morning it holds 392 entities and 866 sourced claims, each carrying a source URL, a confidence grade, a source class, and two dates: when the fact held in the world and when we recorded it.
Sitting beside that graph is an Analyst Outlook table. It is deliberately modest in what it claims. It carries the Street's consensus rating and 12-month price target for the public names the graph maps, restamped from source at each update, together with one sentence explaining why the company matters to the structure. It also carries a mechanical screen: names rated better than Hold with consensus upside of 35% or more. That is the whole apparatus. There is no proprietary model, no black box, and the numbers in the table are the Street's targets held to account, not ours.
What the graph adds is the reason. On 24 July the Nvidia row said, in full: "AI-GPU monopoly: 93% of revenue is data-center and still compounding at scale." That sentence was not written by looking at a chart. It was written by looking at the graph, where Nvidia was already the most connected entity by a wide margin, and asking what the income statement of the most connected entity in a sector spending $725 billion a year on capex must look like.
By 25 August, the last restamp before the print, the row had been updated three times as prices moved. It read: "FQ2 on 26 August is the sector's single largest scheduled datapoint." The segment note recorded that Nvidia's own guide was about $91 billion against a Street looking for $93 to $95 billion, and that the stock had sold off 2.9% into the report, to $208. Consensus upside on the row that day was +46%.
We did not know the number. Nobody outside the company did. What the graph did know, structurally, was that the number could not be small, because the customers were already on the record in the graph committing to volumes that had to show up somewhere.
The structure that pointed at the answer
Here is the first query, run against the live graph this morning. It counts Nvidia's relationships and splits them by direction.
MATCH (n:Entity {id:'nvidia'})-[r:CLAIM]-(m:Entity)
RETURN count(r) AS claims, count(DISTINCT m) AS counterparties,
       sum(CASE WHEN startNode(r)=n THEN 1 ELSE 0 END) AS outbound,
       sum(CASE WHEN endNode(r)=n THEN 1 ELSE 0 END) AS inbound
Result: 84 claims to 64 distinct counterparties, 54 outbound and 30 inbound. The next most connected entity in the graph is OpenAI at 60, then SpaceX at 39, Anthropic at 34, SandboxAQ at 33, and Alphabet, Palantir and Meta at 32 each. Nvidia is not first by a little. It is first by the width of the second-place company.
Split those 84 by the kind of relationship and the picture sharpens:
MATCH (n:Entity {id:'nvidia'})-[r:CLAIM]-(m:Entity)
RETURN r.group AS kind, count(*) AS n ORDER BY n DESC
Forty-five are economic supply relationships, 17 are capital, 10 are circular-capital loops, four are rivalries, and the remainder are control, government, talent, data and legal. Forty-five supply edges is the important number. Each one is a customer, a supplier or a co-designer that has publicly committed to a quantity of Nvidia hardware or to building on it: SpaceX's roughly 555,000 GPUs and its 4 August commitment to build exclusively on Vera Rubin; Japan's national physical-AI factory at 13,750 Vera CPUs and 27,500 Rubin GPUs; Oracle's GB200 racks; CoreWeave as primary GPU supplier; Microsoft as primary Azure partner; and AWS, which on 24 July was in the graph for a commitment of more than one million Blackwell and Rubin GPUs.
Now widen the lens by two hops:
MATCH (n:Entity {id:'nvidia'})-[rs:CLAIM*1..2]-(x:Entity)
WHERE all(e IN rs WHERE e.group IN ['ec','cap'])
RETURN count(DISTINCT x) AS reach
Result: 154 of 392 entities, or 39.3% of the mapped sector, sit within two supply-or-capital steps of Nvidia. That is the definition of the finding the graph has carried since July under the title "Single point of failure: Nvidia." A risk finding and a revenue forecast turn out to be the same fact read from opposite sides. If two-fifths of the sector is committed to buying from one vendor, and the sector is spending at the rate the hyperscalers disclosed in their late-July prints, the vendor's revenue is a consequence, not a surprise.
The last piece is the circular layer. The graph tags 16 claims as circular capital: cases where a vendor invests in a customer, or guarantees a customer's obligations, and the money comes back as orders.
MATCH (a:Entity)-[r:CLAIM {group:'loop'}]->(b:Entity)
RETURN count(r) AS loops, sum(coalesce(r.mag,0)) AS disclosed,
       sum(CASE WHEN a.id='nvidia' OR b.id='nvidia' THEN 1 ELSE 0 END) AS via_nvidia
Sixteen loops, $383 billion of disclosed magnitude where a figure was published, and 10 of the 16 run through Nvidia: the $30 billion into OpenAI, up to $10 billion into Anthropic, $2 billion each into CoreWeave, Nebius and Nscale, up to $2.1 billion into IREN, and, since 17 August, a guarantee of up to $105 billion of OpenAI's lease and power obligations at the Ohio campus, the first signed instrument of the $250 billion backstop the graph had recorded as talks in July.
A vendor that guarantees its customer's borrowing has a very strong view about that customer's ability to keep buying. The graph recorded the guarantee nine days before the print. It was, in retrospect, the loudest possible signal about the guide.
What Nvidia actually reported
For the quarter ended 26 July 2026, per the company's release and 8-K:
Revenue $96.2 billion, up 106% year over year and 18% quarter over quarter.
Data Center revenue $89.0 billion, up 117% year over year.
Gross margin 75.0%, GAAP and non-GAAP.
GAAP diluted EPS $2.46; non-GAAP $2.22.
$26.0 billion returned to shareholders in the quarter; $99 billion of buyback authorisation remaining.
Third-quarter guide $108.0 billion, plus or minus 2%, with gross margin of 74%. The Street had been near $104.8 billion.
Explicitly: "NVIDIA is not assuming any Data Center compute revenue from China in its outlook."
Jensen Huang's line was "Now, compute is revenue." On the call, management pointed to roughly 70% revenue growth in fiscal 2028, nearly twice what analysts had pencilled in for calendar 2027. That, rather than the beat itself, is what moved the stock: a $96 billion quarter was priced as a possibility; a $108 billion guide with China at zero and 70% growth on top of it was not.
The same day, two things happened that the graph cares about more than the print. AWS and Nvidia announced that AWS will deploy two million additional Blackwell Ultra, Rubin and Rubin Ultra GPUs in 2027 and 2028, on top of the one million-plus announced at GTC, because demand ran through the first commitment early. And The Information reported, carried by CNBC and TechCrunch on 27 August, that Nvidia has agreed to acquire Hugging Face, the hub through which nearly every open-weight model is distributed, for $12.9 billion. The agreement is not yet signed and could still fall apart; the graph records it at medium confidence for that reason.
On 27 August the stock closed at $227.98, up 8.74%. Market capitalisation ended near $5.5 trillion. Broadcom rose 4.5%, Intel 4%, SK Hynix 2%; AMD, interestingly, fell 0.9%. The Nasdaq rose 1.57% and the S&P 500 0.72%.
Measured against the table: from the 24 July row at $203, Nvidia is up 12.3%. From the 25 August restamp at $208, up 9.6%. Consensus target has moved up to about $323, so on the new price the row still carries +42% upside. It remains in the buy screen.
The scorecard, all thirteen names
A single good call proves nothing. The honest measure is every name on the table, including the ones the screen excluded and the ones that went the wrong way. The 24 July table had thirteen public names. Here is each one, using the price as published on the page that day and the 27 August US close (Tencent at the 28 August Hong Kong quote).
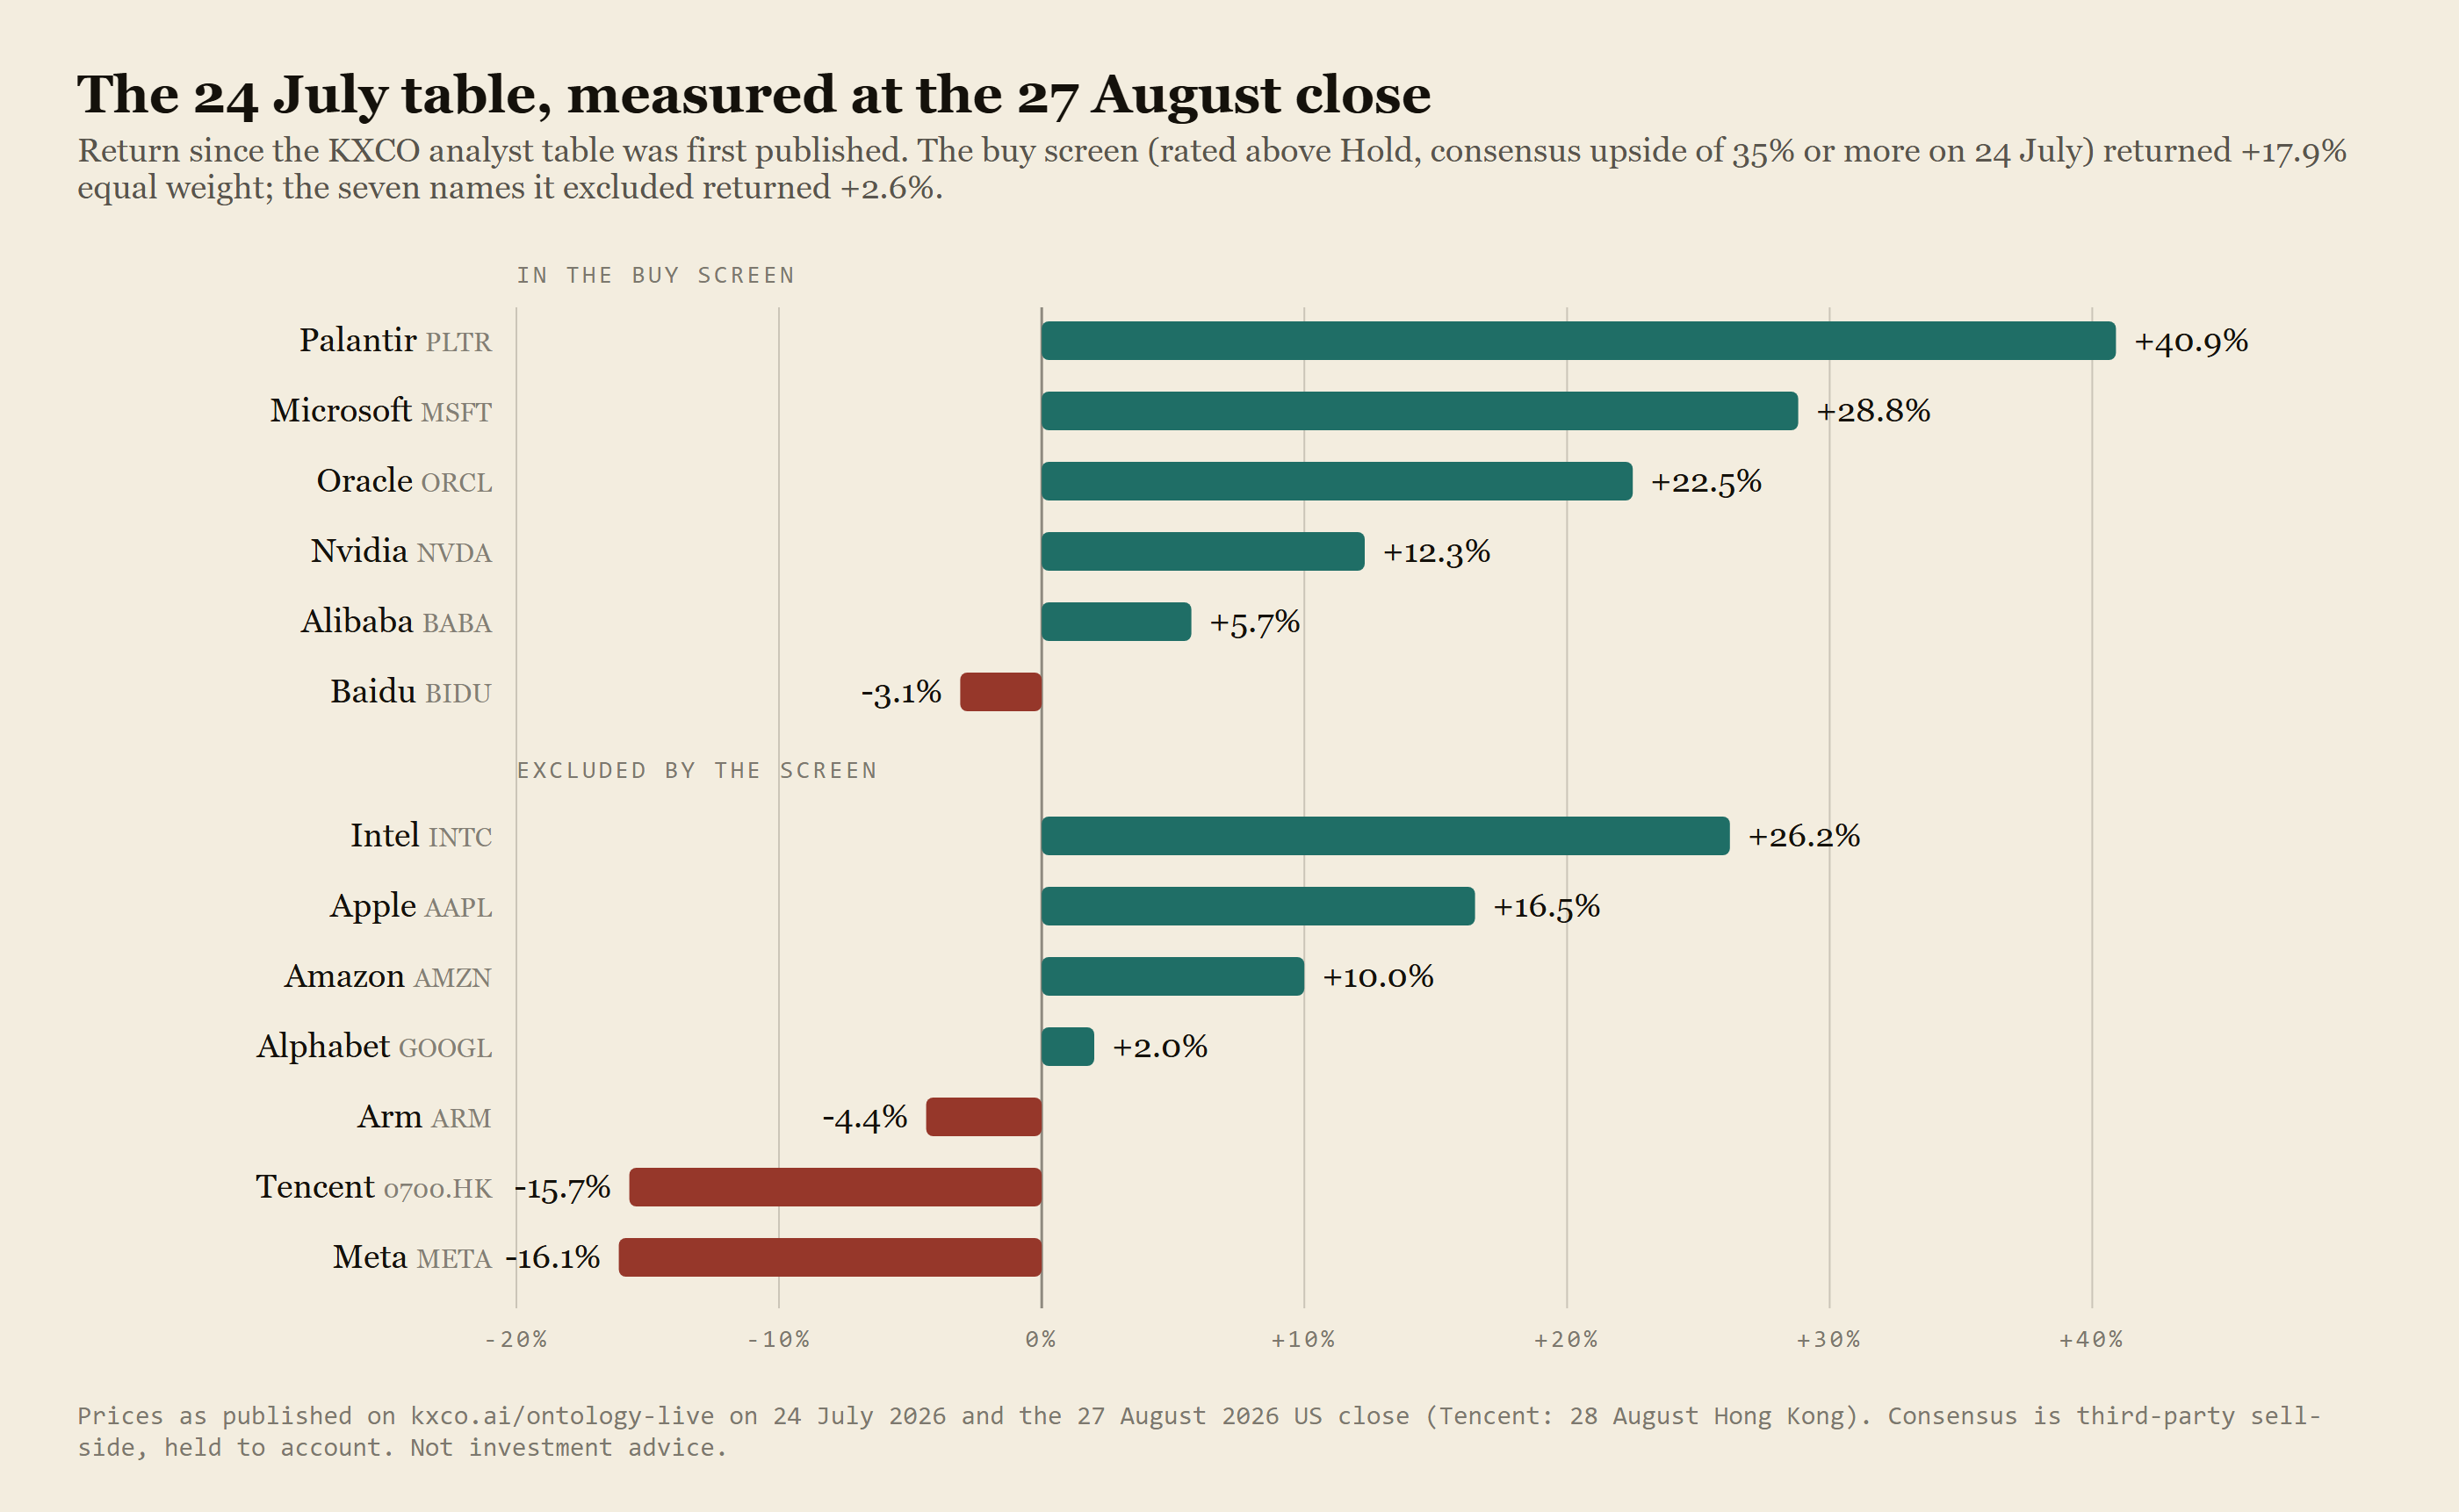
Figure 1. Return of every name on the 24 July analyst table to the 27 August close. Teal is positive, brick is negative. The upper block is the six names the buy screen selected; the lower block is the seven it excluded.
Name | In screen | 24 Jul price | 27 Aug close | Return |
|---|---|---|---|---|
Palantir | Yes | $132 | $185.93 | +40.9% |
Microsoft | Yes | $392 | $505.06 | +28.8% |
Oracle | Yes | $124 | $151.94 | +22.5% |
Nvidia | Yes | $203 | $227.98 | +12.3% |
Alibaba | Yes | $110 | $116.31 | +5.7% |
Baidu | Yes | $100 | $96.94 | -3.1% |
Intel | No | $73 | $92.09 | +26.2% |
Apple | No | $270 | $314.58 | +16.5% |
Amazon | No | $233 | $256.26 | +10.0% |
Alphabet | No | $334 | $340.65 | +2.0% |
Arm | No | $267 | $255.21 | -4.4% |
Tencent | No | HK$540 | HK$455.20 | -15.7% |
Meta | No | $681 | $571.10 | -16.1% |
Equal-weighted, the six names in the buy screen returned +17.9%. The seven names it excluded returned +2.6%. The full table of thirteen returned +9.7%. The spread between the screen and its complement is 15.3 percentage points over five weeks.
Five of the six picks were positive. The best was Palantir at +40.9%, the worst Baidu at -3.1%. On the other side of the line, the two worst names on the whole table, Meta at -16.1% and Tencent at -15.7%, were both names the screen excluded. Meta was rated Strong Buy on 24 July, but with only +21% consensus upside; the 35% threshold kept it out. Tencent sat at +20% upside and was also excluded. The threshold did the job it exists to do in both directions, keeping out the two names that fell hardest while keeping in the one that rose most.
This is the second time we have measured it. At the 21 August close, a week before the print, the same screen was +14.2% against +1.1% for the excluded names and +7.1% for the full table. The Nvidia print widened the spread by three points; it did not create it. The screen was ahead before the catalyst and further ahead after it.
Two caveats belong here rather than in a footnote. First, the window contains both the July repricing, when more than a trillion dollars came off chip names in a week, and its full reversal, the best August for the SOX in over two decades. Absolute returns over such a window say less than the spread between the screen and its complement, which is why I keep quoting the spread. Second, the table's 24 July edition carried two wrong market caps, Alphabet and Intel, which were corrected in public on 5 August. Prices, which drive the returns above, were correct throughout.
What we got wrong, and what we still might
Measuring in the open means listing the misses with the same care as the hits.
Baidu. The one losing pick. On 24 July the row said cheap AI exposure; by 21 August the company had swung to a trailing loss on AI spend and the multiple the thesis rested on ceased to exist. The row now says so. Consensus still has it at +54% upside with a wide split among analysts, so it remains in the screen, but the original reason for it was wrong and has been rewritten.
Palantir. The best performer has run through its own consensus target. At $185.93 against a $191.68 average target, the row now shows +3% upside on 159 times earnings. Either the Street is behind the price or the price is ahead of the Street; the table cannot tell you which, and I will not pretend it can.
The dual-IPO finding. The graph carried a finding in July that OpenAI and Anthropic would both file into the same quarter. OpenAI slipped to 2027. Rather than delete the finding, we rewrote it on the live page under the title "The dual-IPO quarter has split," naming the original claim, the evidence against it, and what still stands. An ontology that silently retires its misses is indistinguishable from one that never made them.
The framing of the guide. The Nvidia row on 25 August recorded the company's own guide at about $91 billion against a Street of $93 to $95 billion. The actual number was $96.2 billion, above both. The row was right about the shape of the event and conservative on the magnitude. That is the direction I would rather be wrong in, but it is still a miss on the number.
What we might still be wrong about. The Hugging Face acquisition is unsigned. The AWS two-million-GPU figure is a plan for 2027 and 2028, not a delivery. The 70% fiscal 2028 growth remark is management's framing, not a guide. Each is recorded in the graph with the confidence grade it deserves, and each will be re-graded when the record moves.
What changed in the ontology today
Every update to the graph is a dated delta with a script that anyone can read. Today's, recorded 28 August 2026:
Three claims added or closed. The AWS "1M+ GPUs" edge was closed with a valid-to date of 26 August and superseded by a new claim for two million additional GPUs in 2027-28, so the history is kept rather than overwritten. A new capital claim records Nvidia's reported agreement to acquire Hugging Face for $12.9 billion at medium confidence, unsigned. Nvidia's entity note now carries the full FQ2 print.
Three findings revised. "Single point of failure: Nvidia" now carries the degree figures above and the $96.2 billion quarter as the other side of the same fact. "The chip vendor is buying the layers it sells into," written on 25 August about the $6 billion Poolside licence and the Perplexity talks, now includes the Hugging Face agreement: models, applications and distribution, the three layers Nvidia did not occupy at the start of the month. "Open weights have one front door" records that the front door's prospective owner is the GPU vendor.
All seventeen analyst rows restamped to the 27 August close, each re-read from source rather than carried forward. Nvidia at $228 with a $323 target, +42%. Oracle and Alibaba lead the table on consensus upside at +61% each; Cerebras and SpaceX at +56%; Palantir and Apple trail at +3%. The average price-target upside across the seventeen is +34%.
The graph now stands at 392 entities, 866 claims, 812 of them carrying a source URL, 44 findings. The machine-readable data.json and the Cypher export were regenerated and are live. The chat on the page answers from the new claims; ask it what Nvidia reported and it will tell you $96.2 billion and cite the source.
Why this is the right way to measure a publication
Most financial commentary is unfalsifiable by design. A view is expressed, the market moves, and the next piece is written as if the last one never existed. Readers have learned to discount it accordingly.
The alternative is not to be right more often. Nobody is right often enough for that to work. The alternative is to publish in a form where being wrong is visible: dated claims, stated reasons, named sources, and a record that closes a claim when it stops being true instead of overwriting it. That is what a graph with two time axes gives you. Every claim in the KXCO ontology knows when it held in the world and when we asserted it. When the world moves, the old claim gets a valid-to date and the new one gets a supersedes pointer. You can scrub back to 24 July on the live page and see exactly what we believed that day, with no ability on our side to improve it after the fact.
This is the same discipline the KXCO Round Table applies to a thesis inside an enterprise: the record supports it, the record contradicts it, or the record is silent, and the finding says which. Applied to a public analyst table it produces the scorecard above, misses included. Applied to a live sector map it produces a graph that pointed at a $96 billion quarter five weeks before it was reported, for reasons you can read and queries you can run.
The scarce thing in this market is not another forecast. It is a shared, verifiable account of what is true and when we knew it. That is what the ontology is for, and the Nvidia print is simply the week it was easiest to see.
What to watch
The next scheduled datapoints the graph is pointed at, in order:
Whether the Hugging Face agreement is signed at or near $12.9 billion. If it closes, the open-weight distribution finding converts from prospect to fact and the graph gains its first case of a silicon vendor owning the model shelf.
Anthropic's October window. A listing converts its filed-status claims and cap-table finding to public marks, and the analyst table gains a row.
Nvidia's third quarter, guided at $108 billion with China at zero. The row will say what the Street expects the week before, as it did this time.
The AWS schedule. Two million GPUs across 2027-28 is the largest single-customer commitment in the graph; the first delivery evidence is what turns it from plan to supply.
The screen itself, re-measured at each restamp. Today's version, with the 35% threshold applied to the fresh table, holds Oracle, Alibaba, Cerebras, SpaceX, Baidu, Tencent and Nvidia. We will publish how it did.
Stocks mentioned in this article: $NVDA, $PLTR, $MSFT, $ORCL, $BABA, $BIDU, $INTC, $AAPL, $AMZN, $GOOGL, $ARM, $META, $AMD, $AVGO, $ASML, $CBRS, $SPCX and $TCEHY.
Shayne Heffernan, Ph.D., is the founder of Live Trading News, the KnightsBridge Group, Knightsbridge Law and the KXCO.ai ecosystem spanning post-quantum cryptography, identity, attestation and enterprise ontology. He is an economist and excogitator, and writes at Live Trading News and shayneheffernan.com.
This is analysis, not investment advice. Ratings and price targets are third-party sell-side consensus as published by S&P Global via StockAnalysis, collected and dated, not KXCO forecasts. Prices are point-in-time closes. Past performance of a screen over five weeks is not evidence of anything except what happened over those five weeks.
The China Chip Shock
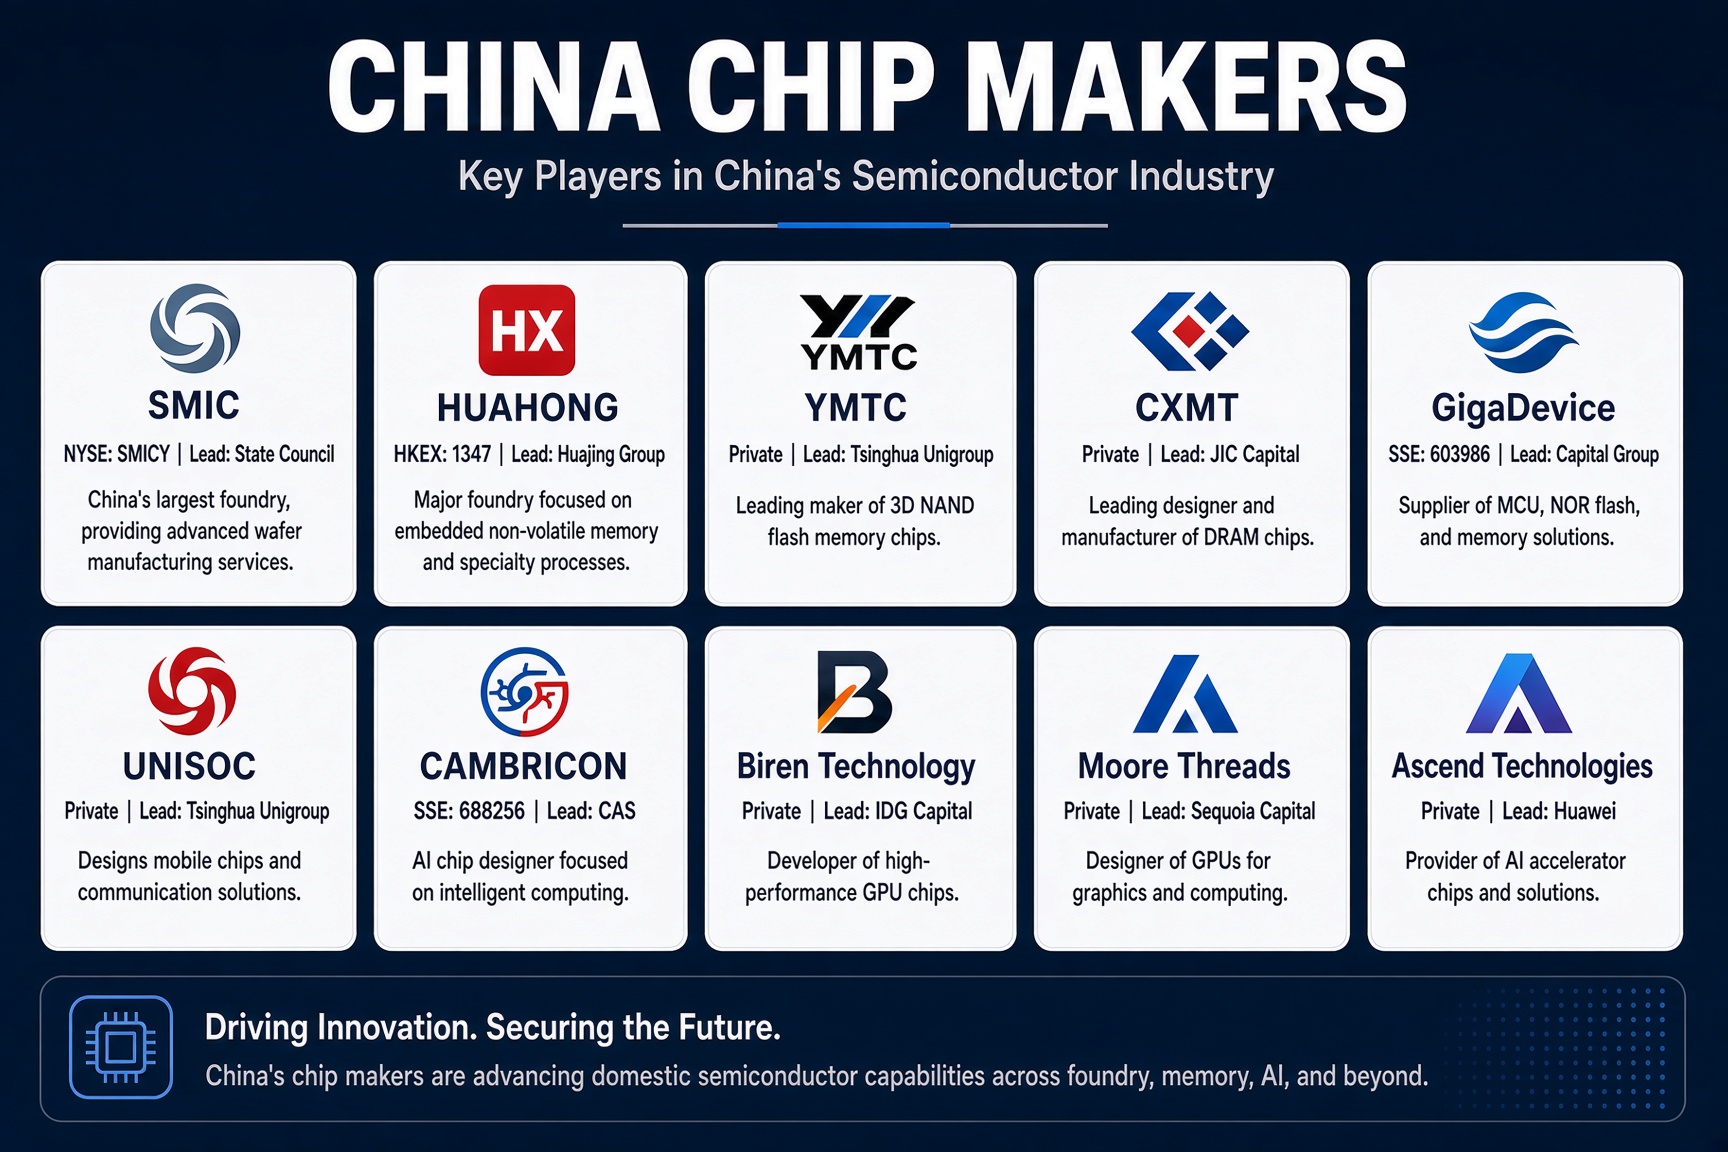
On 10 October CXMT said it will ship DDR5 server modules on a 4F2 cell by year-end. Micron, SK Hynix, Samsung and Sandisk sold off for two sessions and Elon Musk said China scales faster than the rest of the world combined. This piece sets out China's memory makers, foundries, AI chip designers and toolmakers, with two knowledge graphs drawn from the KXCO AI Sector Ontology, and says what the sell-off prices and what it does not.
China's Coordinated Push in AI, Quantum Computing and Blockchain
On 9 October 2026 Beijing called for a nationally integrated computing-power network and a national blockchain network. DeepSeek is scaling on Huawei Ascend chips, China's intelligent computing reached 2,185 EFLOPS by June, per the industry ministry, and quantum communications remain a strength. This analysis explains the strategy and sets out the Hong Kong and US listed companies with exposure, from Tencent and Alibaba to China Mobile, HashKey and Nvidia.

Week Ahead on Wall Street: CPI, Banks and Oil
September CPI lands on Wednesday after a Fed hike and a 10-year yield at its highest since 2002. JPMorgan, Goldman and Citi open bank earnings on Tuesday, ASML and TSMC report midweek, and Saudi pipeline attacks kept Brent at $104.72 on 9 October 2026, per CNBC. The KXCO AI Sector Ontology still shows contracted demand. This week ahead sets out the calendar, the three facts that would change the call, and why dips in the AI leaders remain buying opportunities.
AI Is Being Powered by Tech That Looks Almost Alien
Every frontier AI model runs on chips printed by one Dutch machine. ASML's extreme-ultraviolet scanner fires a laser at up to 50,000 droplets of molten tin a second, per ASML, and bounces the light off mirrors whose deviations are tens of picometres. Veritasium called it the closest thing we have to alien technology. This piece takes the film as the brief and checks it: the machine, High-NA, and the wafer-scale chips and liquid-cooled racks downstream of it.
Every story, signed and delivered.
Subscribe to the kxco channel and get the headline, the AI-written key takeaways, and the chain-anchor link the moment we publish. Audio versions and per-ticker subscriptions arrive in the next iteration.