
Economic Calendar and Trading Strategies
Week of June 29 – July 3, 2026
Economic Calendar and Trading Strategies
by Shayne Heffernan
Week of June 29 – July 3, 2026
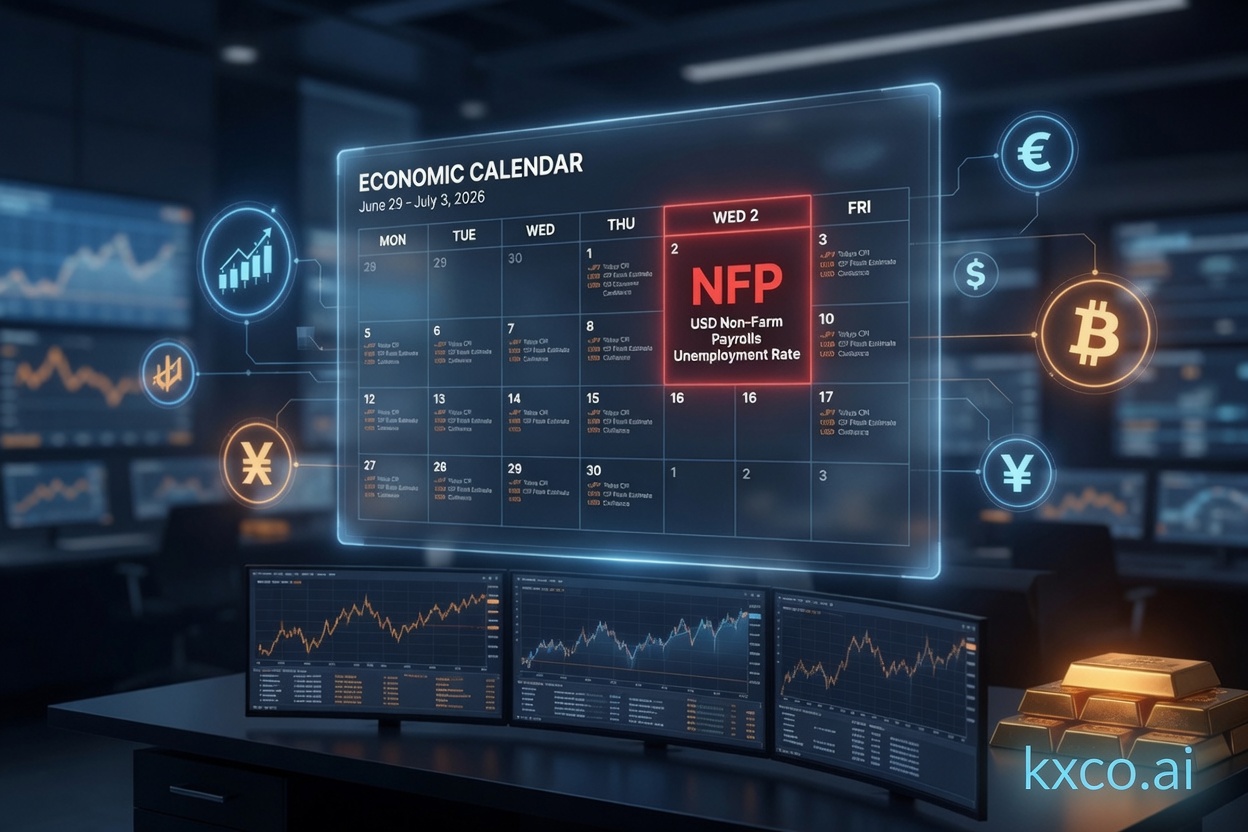
LiveTradingNews.com/trading is an excellent resource for traders and investors looking to stay ahead of market-moving developments. The site features a comprehensive and easy-to-navigate economic calendar that highlights all major upcoming events, including central bank decisions, employment reports, inflation data, and other high-impact releases. With real-time updates, clear importance ratings, and supporting news analysis, it allows users to effectively prepare for volatility and make more informed trading decisions throughout the week.
(Times in Eastern Time • Focus on high/medium-impact events)
Date | Indicator | Expected (Consensus) | Previous | Market Impact if BETTER than expected | Market Impact if WORSE than expected |
Tue Jun 30 | S&P Case-Shiller Home Price Index (20-city, Apr) | — (slowing trend expected) | +0.8% | Mildly bullish for financials & housing-related stocks | Mildly bearish for housing & banks |
Tue Jun 30 | Chicago PMI (June) | 55.0 | 62.7 | Bearish for stocks, bullish for bonds | |
Tue Jun 30 | Conference Board Consumer Confidence (June) | 94.6 | 93.1 | Bullish for equities & consumer stocks | Bearish for stocks, supportive for bonds |
Tue Jun 30 | JOLTS Job Openings (May) | 7.3 million | 7.62 million | Bearish for USD, supportive for rate-cut bets | |
Tue Jun 30 | China Manufacturing & Non-Manufacturing PMI | Above 50 (expansion) | Mixed | Bullish for global stocks, commodities, AUD | Bearish for risk assets & China-related plays |
Wed Jul 1 | ADP Private Employment (June) | ~110k – 118k | 122k | Bearish for stocks, bullish for bonds & rate cuts | |
Wed Jul 1 | ISM Manufacturing PMI (June) | 53.7 – 53.8 | 54.0 | Bullish for equities & cyclical stocks | Bearish for stocks, supportive for bonds |
Wed Jul 1 | Eurozone HICP Inflation Flash (June) | ~3.1% headline / 2.6% core | 3.0% / 2.6% | Hawkish → Stronger EUR, higher yields, pressure on stocks | Dovish → Weaker EUR, lower yields, bullish for bonds |
Wed Jul 1 | Construction Spending (May) | +0.2% | +0.4% | Mildly bullish for housing & materials | Mildly bearish |
Thu Jul 2 | US Nonfarm Payrolls (June) | ~110k – 118k | 172k | Strongly Bullish equities & USD Bearish bonds | Strongly Bearish equities Bullish bonds & rate-cut expectations |
Thu Jul 2 | US Unemployment Rate (June) | 4.3% | 4.3% | Higher = Bearish for stocks, bullish for bonds | |
Thu Jul 2 | Average Hourly Earnings (MoM / YoY) | +0.3% / +3.5% | +0.3% / +3.4% | Higher wages = Hawkish (stronger USD, higher yields) | Lower wages = Dovish (bullish bonds, weaker USD) |
Thu Jul 2 | Initial Jobless Claims | ~221k | 215k | Higher claims = Bearish for stocks | |
Fri Jul 3 | China Services PMI | Above 50 | — | Bullish for global risk assets | Bearish for risk assets |
Quick Reference: How Markets Usually React
Stronger-than-expected data | Weaker-than-expected data | Notes |
Stocks ↑ | Stocks ↓ | Especially growth & cyclical sectors |
US Dollar ↑ | US Dollar ↓ | Strong economy = less rate cuts |
Treasury Yields ↑ | Treasury Yields ↓ | Higher growth/inflation = higher yields |
Gold ↓ | Gold ↑ | Safe-haven flows on weakness |
Rate Cut Expectations ↓ | Rate Cut Expectations ↑ | Key for bonds & USD |
Most Important Event This Week
Thursday, July 2 – U.S. Employment Report (Nonfarm Payrolls)
This is by far the highest-impact release. Big deviations from the ~110k–118k consensus can cause significant volatility across stocks, bonds, and currencies.
Friday, July 3 → U.S. markets closed (Independence Day holiday) → Expect low volume and muted reactions.
NFP Volatility Scenarios Analysis
US Nonfarm Payrolls – Thursday, July 2, 2026 (8:30 AM ET)
Consensus Expectations
Nonfarm Payrolls: +110k to +118k (midpoint ~114k)
Unemployment Rate: 4.3%
Average Hourly Earnings: +0.3% MoM / ~+3.5% YoY
The headline jobs number is important, but markets react most to the combination of jobs + unemployment rate + wage growth. Wage growth is especially critical because it directly affects inflation and Fed rate expectations.
NFP Volatility Scenarios
Scenario | Jobs Number | Unemployment | Wages | Immediate Market Reaction | Volatility Level | Key Drivers & Notes |
1. Strong Beat | +180k+ | 4.2% or lower | Hot (> +0.4% MoM) | Very High | Strong growth + wage pressure = "higher for longer" rates. Classic risk-off in bonds & gold. Stocks may initially rise then sell off. | |
2. Moderate Beat | +140k – 160k | 4.2–4.3% | In-line or slightly hot | High | Solid but not overheating economy. Supports "soft landing" narrative. Positive for risk assets overall. | |
3. In-Line / Slight Miss | +90k – 130k | 4.3% | In-line | Muted / Range-bound initially, then direction depends on wages | Medium-High | Most common outcome. Market waits for full details (especially wages & revisions). Low surprise = lower volatility after first 30 mins. |
4. Big Miss | +70k or lower (or big downward revisions) | 4.4%+ | Cool (< +0.3% MoM) | Very High | Recession fears rise → dovish Fed bets surge. Bonds rally hard. Gold benefits from lower yields + safe-haven demand. |
Detailed Breakdown of Each Scenario
Scenario 1: Strong Beat (+180k+ with hot wages)
Why it moves markets: Signals very strong economy → reduces odds of Fed rate cuts in 2026.
Typical moves:
Risk: "Higher for longer" narrative dominates.
Scenario 2: Moderate Beat
Balanced reaction.
Usually the least volatile of the surprise scenarios.
Markets tend to like this outcome (Goldilocks jobs data).
Scenario 3: In-Line with Consensus
Lowest volatility scenario if wages are also in-line.
The report is often "priced in" — big moves are less likely unless revisions are large or wages surprise.
Many traders stay on the sidelines or take small positions.
Scenario 4: Big Miss (Weak Jobs)
Triggers strongest dovish reaction.
Markets price in more aggressive Fed rate cuts.
Classic "bad news is good news" for stocks and bonds in the short term.
Gold usually performs best in this scenario.
Important Additional Factors That Amplify Moves
Factor | How It Affects Reaction | Impact on Volatility |
Wage Growth | Hot wages = more hawkish than headline jobs | Very High |
Prior Month Revisions | Big upward revisions = effectively stronger data | High |
Unemployment Rate | Rising unemployment = dovish even if jobs beat | High |
Labor Force Participation | Falling participation can make jobs number look better | Medium |
Historical Context on NFP Volatility
NFP is consistently one of the highest volatility events of the month.
First 15–30 minutes after release usually see the biggest moves (knee-jerk reaction).
A significant reversal in the opposite direction within 1–2 hours is very common.
Average move in major forex pairs on NFP days: 60–120 pips.
Equities and gold often see 0.8–2%+ moves on big surprises.
Summary Table – Expected Behavior
Asset | Strong Jobs | Weak Jobs | In-Line |
US Dollar | Strongly Bullish | Strongly Bearish | Neutral |
10Y Yields | Higher | Lower | Little change |
S&P 500 | Mixed | Mixed (often higher short-term) | Low reaction |
Bearish | Bullish | Neutral | |
Volatility | Very High | Very High | Medium |
Bottom line:
The July 2 NFP has high volatility potential because it is the last major jobs report before the July 4 holiday and comes at a time when markets are sensitive to Fed policy direction.
Would you like me to expand on specific trading strategies for each scenario (e.g., how to position in forex, options, or indices)?
Specific Trading Strategies for Each NFP Scenario
US Nonfarm Payrolls – Thursday, July 2, 2026 (8:30 AM ET)
Important Trading Notes Before Strategies:
NFP creates extreme volatility in the first 15–60 minutes.
Many professional traders wait 15–30 minutes after the release before entering (to avoid whipsaws).
Focus on the full report (headline + wages + unemployment + revisions), not just the jobs number.
Use tight risk management — position size smaller than usual.
Since July 3 is a holiday, liquidity will drop sharply after Thursday’s session.
Scenario 1: Strong Beat
(Jobs +180k+ AND hot wages)Market Bias: USD bullish, Yields higher, Risk assets mixed-to-bearish
Asset | Direction | Strategy Type | Entry Approach | Target | Stop Loss | Notes / Risk Management |
USD/JPY | Long | Breakout / Momentum | Buy on 15-min close above recent high after release | +80 to +150 pips | Below 15-min low | Strongest USD pair in this scenario |
EUR/USD | Short | Fade initial spike | Sell after first 15–30 min pullback | 80–120 pips | Above recent swing high | Very clean short setups |
S&P 500 | Short | Reversal trade | Short after initial rally fails (30–60 min) | 0.8–1.5% down | Above high of day | Growth stocks suffer most |
Gold (XAU) | Short | Trend continuation | Sell on any bounce above $20–30 | $40–80 lower | Above recent high | One of the cleanest shorts |
10Y Yield | Long (higher yields) | Yield futures | Buy on pullback | +8 to +15 bps | Below key support | Strongest in hot wages scenario |
Best Strategy:
“Wait & Fade” — Let the initial spike happen, then fade risk assets and buy USD strength once direction confirms.
Scenario 2: Moderate Beat(+140k – 160k jobs)Market Bias: Mildly bullish USD & risk assets (Goldilocks outcome)
Asset | Direction | Strategy Type | Entry Approach | Target | Stop Loss | Notes |
S&P 500 / Nasdaq | Long | Momentum | Buy dips in first 30–60 min | +0.6% to +1.2% | Below pre-NFP low | Best risk/reward here |
USD/JPY | Long | Breakout | Buy above pre-NFP high | +60–100 pips | Below 15-min low | Moderate strength |
Short | Range fade | Sell rallies | $25–50 lower | Above $30–40 | Mild downside | |
EUR/USD | Short | Range trade | Sell strength | 50–80 pips | Above recent high | Cleaner than big beat |
Best Strategy:
“Buy the Dip” on indices after any initial volatility. This is often the cleanest bullish setup for stocks.
Scenario 3: In-Line / Slight Miss
(+90k – 130k jobs, wages in-line)Market Bias: Low conviction / Range-bound initially
Asset | Direction | Strategy Type | Entry Approach | Target | Stop Loss | Notes |
All Assets | Neutral | Volatility Play | Long Straddle or Strangle (options) | Depends on breakout | — | Best approach when unsure |
S&P 500 | Range | Mean reversion | Buy support / Sell resistance | Small scalps | Tight stops | Lowest directional edge |
USD pairs | Range | Fade extremes | Trade both sides of range | 30–60 pips | Beyond range | Wait for clear break |
Range | Mean reversion | Buy dips / Sell rallies | Small targets | Tight | Often the calmest asset |
Best Strategy:
Options Volatility Play (Long Straddle/Strangle) before the release if you expect a move but are unsure of direction.
Or stay flat and only trade clear breakouts after 30–45 minutes.
Scenario 4: Big Miss
(+70k or lower + rising unemployment)Market Bias: Dovish → USD weak, Bonds strong, Gold strong, Stocks mixed-to-bullish short-term
Asset | Direction | Strategy Type | Entry Approach | Target | Stop Loss | Notes |
EUR/USD | Long | Momentum | Buy after first 15–30 min pullback | +80 to +150 pips | Below 15-min low | Strongest long setup |
Long | Breakout | Buy on any dip or breakout | $50–120 higher | Below recent low | Excellent in this scenario | |
S&P 500 | Long | “Bad news = Good news” | Buy dips after initial fear selling | +1% to +2% | Below pre-NFP low | Rate cut hopes dominate |
USD/JPY | Short | Trend continuation | Sell strength | 80–150 pips | Above recent high | Very clean short |
TLT (Bonds) | Long | Yield compression | Buy on any weakness | Strong upside | Below key support | One of the best performers |
Best Strategy:
“Buy the Dip” on stocks and gold after the initial panic selling.
This scenario often produces the largest moves in the opposite direction of what many expect.
Fed Rate Cut Odds Review
As of June 28, 2026Current Market-Implied Probabilities (CME FedWatch Tool)
The Federal Funds target rate currently sits at 3.50% – 3.75%.Here are the latest probabilities for upcoming FOMC meetings:
FOMC Meeting | Date | Hold (3.50–3.75%) | Hike to 3.75–4.00% | Hike to 4.00–4.25% | Key Takeaway |
July 2026 | July 29 | 69% | 31% | — | Hold most likely |
September 2026 | Sep 16 | 40.5% | 46.7% | 12.8% | Hike favored |
October 2026 | Oct 28 | Lower | Higher | Possible | Further tightening priced in |
Sources: CME FedWatch Tool + Investing.com Fed Rate Monitor (data as of June 27, 2026)
Summary of Current Market Expectations
No rate cuts are being priced in for the rest of 2026.
Markets are instead assigning a meaningful chance of rate hikes starting as early as July 29.
The biggest shift in recent weeks has been away from cuts and toward hikes, driven by sticky inflation and relatively resilient economic data.
By September, the market sees roughly a 60%+ chance of at least one 25 bps hike.
What This Means Right Now
Outlook | Probability | Implication for Markets |
Rate Cut in 2026 | Very Low | Almost no pricing for easing |
Hold through July | High (69%) | Base case for next meeting |
Hike by September | High (~60%) | Markets expect tightening |
Multiple Hikes in 2026 | Moderate | Possible if data stays strong |
How the July 2 NFP Could Move These Odds
The Nonfarm Payrolls report on Thursday is one of the last major data points before the July 29 FOMC meeting. Here’s how different outcomes could shift probabilities:
NFP Outcome | Likely Impact on July Odds | Likely Impact on September Odds | Overall Effect |
Strong Beat (+180k+) | Increases hike odds in July | Strongly increases hike odds | Hawkish |
Moderate Beat | Mild increase in hike odds | Increases hike probability | Mildly Hawkish |
In-Line | Little change | Limited impact | Neutral |
Big Miss (<70k) | Reduces hike odds significantly | Could bring cut odds back into play | Dovish |
A hot NFP + strong wages would likely push July hike odds above 40–50% and September hike odds even higher.
A weak NFP would be one of the few things that could quickly bring rate cut expectations back into the conversation for later in 2026.
Bottom Line (June 28, 2026)
The market has shifted hawkish in recent weeks.
A rate cut in 2026 is currently not the base case.
The path of least resistance is currently higher rates, especially if the labor market remains resilient.
The July 2 NFP is now a critical data point that could either reinforce the hawkish tilt or start bringing easing bets back.
The economic calendar at https://www.livetradingnews.com/trading is a vital tool for traders across multiple asset classes, including stocks, forex, Bitcoin, and gold. Major economic releases such as Nonfarm Payrolls, inflation data, and central bank decisions often trigger significant volatility in these markets, and having access to a clear, well-organized calendar helps traders anticipate potential moves and manage risk effectively. Whether you're trading currency pairs, equity indices, cryptocurrencies, or precious metals, staying informed about upcoming high-impact events allows for better timing, more strategic positioning, and improved overall trading decisions.


US Vs China The AI Arms Race
AI has become the defining strategic technology of the 21st century, driving a new economic and geopolitical competition between the United States and China. This report examines the companies, infrastructure, government policies and investment opportunities shaping the global AI arms race.

Is the Iran War Back?
US Central Command struck Iran on June 26, nine days after a peace memorandum, after an alleged drone attack on shipping in the Strait of Hormuz. What it means for gold, Bitcoin, the defense complex — Palantir, Lockheed, RTX — and why the return of QE matters more than the bombs.

Palantir Stock (PLTR): BUY Rating, $250 Price Target — The 40% Dislocation
Palantir is down ~40% in 2026 even as Q1 revenue grew 85% and management guided FY2026 to $7.66B. Shayne Heffernan issues a BUY on PLTR with a $250 price target — full breakdown of the business, customers, five-year revenue, every major Wall Street bank target and the corporate outlook.
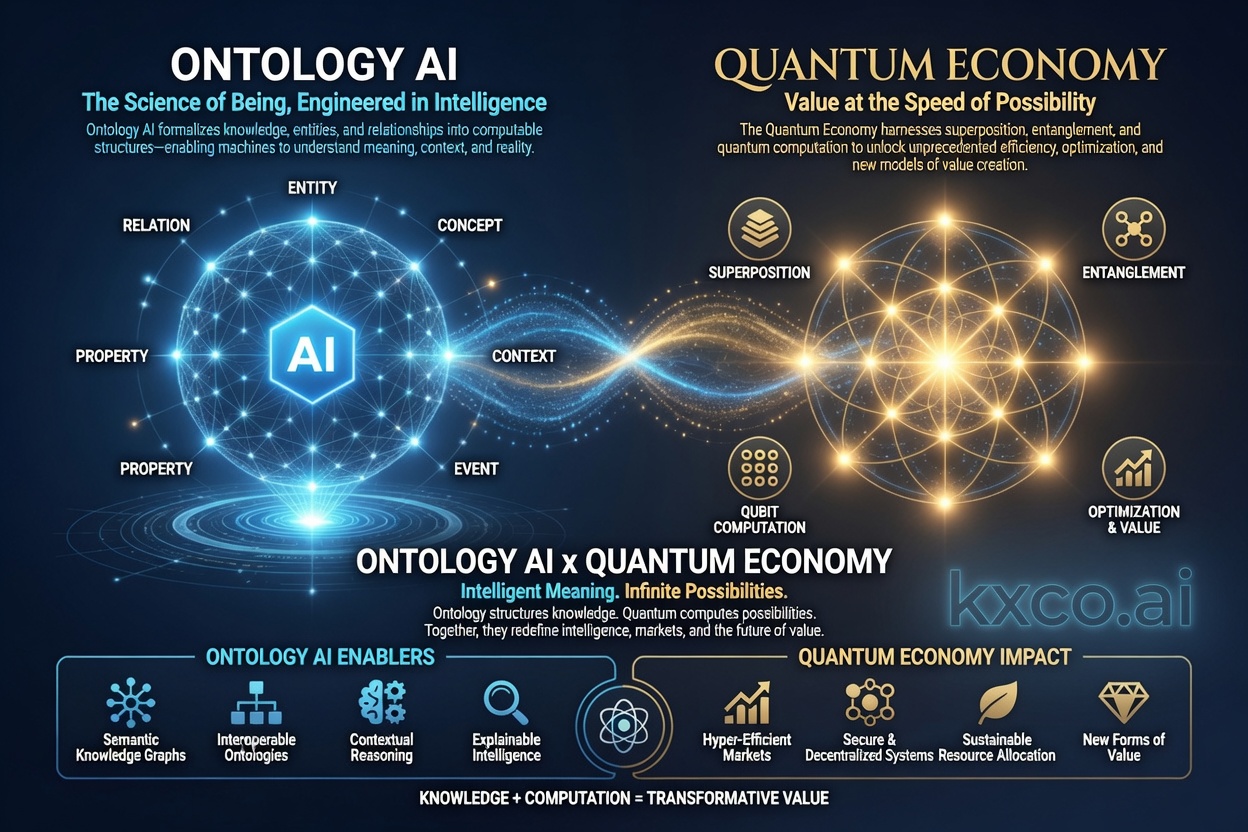
Ontology: The Operating System of the AI and Quantum Economy
Shayne Heffernan explains ontology in plain English — what it is, why it matters, how Palantir uses it to ground AI, and how KXCO models financial and business flows as verifiable, post-quantum knowledge graphs for the AI and quantum era.
Every story, signed and delivered.
Subscribe to the kxco channel and get the headline, the AI-written key takeaways, and the chain-anchor link the moment we publish. Audio versions and per-ticker subscriptions arrive in the next iteration.