
Crypto: Bitcoin is flashing a “textbook” Adam and Eve Double Bottom Pattern
#crypto #bitcoin #bullish
"This chart pattern is formed when one sharp V-shaped first bottom low is made on high volume. This is the first ‘Adam’ bottom. Then the price bounces back higher but later goes lower a second time to create a second cup shape as a second bottom that is the ‘Eve’ on decreasing volatility and a tighter price range"--Paul Ebeling
So, no matter how hard it feels right now, make it your goal and give it your best shot and buy.
A closely tracked crypto strategist who continues to build his following with timely Bitcoin calls says the leading digital asset could be gearing up for a significant rally.
Crypto analyst Kevin Svenson tells his 110,200 Twitter followers that he’s looking at Bitcoin’s moving average convergence divergence (MACD) indicator on the 3-day chart which suggests that Bitcoin is likely setting up for a sustained bounce.
Traders rely on the MACD to spot either trend reversals or continuations.
“Bitcoin three-day MACD cross will likely lead to continuation up. The three-day candle closes tonight. We’re very likely going to confirm the cross soon.”
Looking at lower timeframes, Mr. Svenson says that Bitcoin might be trading within a bullish pennant pattern with support around $21,400.
“BTC testing the bottom of the formation. Needs to hold this area to maintain structure.”
Although Svenson appears bullish on BTC, he reminds his followers that Bitcoin is still in a long-term bear market.
“‘The trend is your friend until the end of the trend.’
The short term trend is up with some momentum.
The long-term trend is down. Deep in bear territory
In the short to medium term, I’m playing this bullish but being cautious about a macro lower high dump later on.”
At time of writing, Bitcoin is changing hands at $20,828.21
A tip of the hat to sovereign individuals with satoshis and Bitcoin in cold storage with our firm. Click here
Have a prosperous week, Keep the Faith!
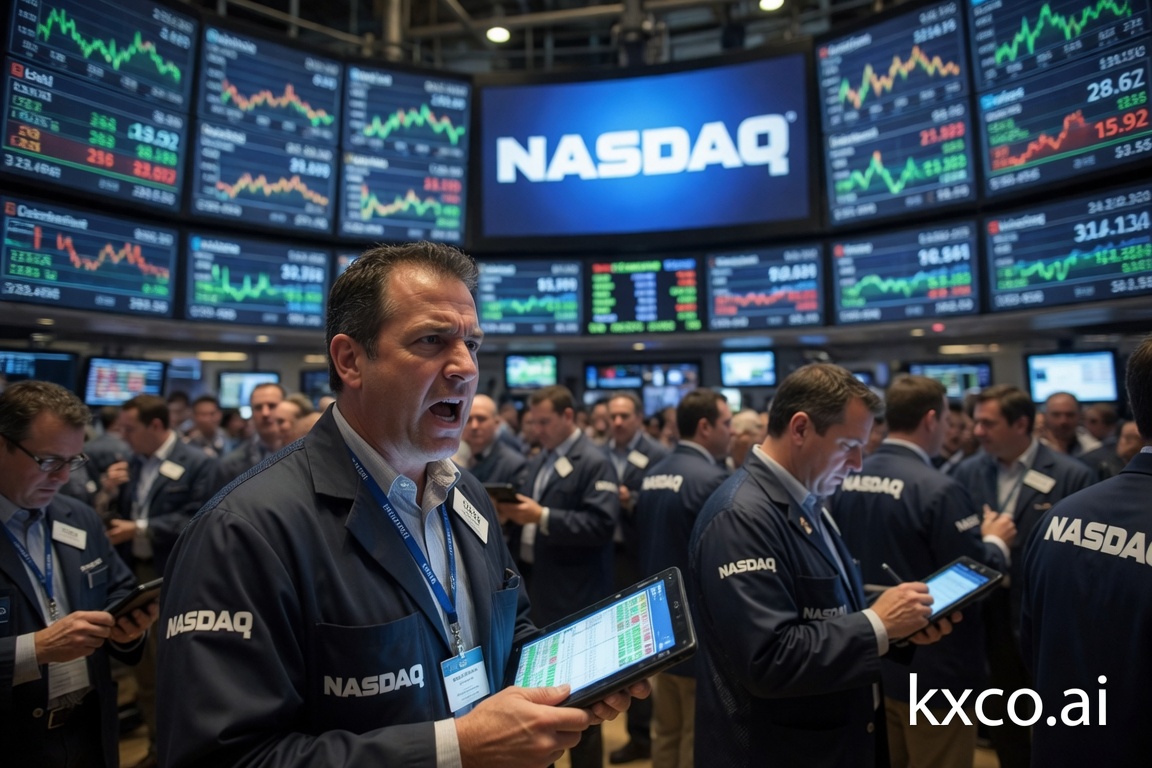
Economic Calendar and Trading Strategies for the Week Ahead: July 20–24, 2026
A pivotal week for markets: Iran's closure of the Strait of Hormuz sends crude above $86 and gasoline over $5, while Alphabet, Tesla and Intel earnings test the AI trade. Full economic calendar plus trading strategies across oil, gold, Bitcoin, FX and AI chip stocks.
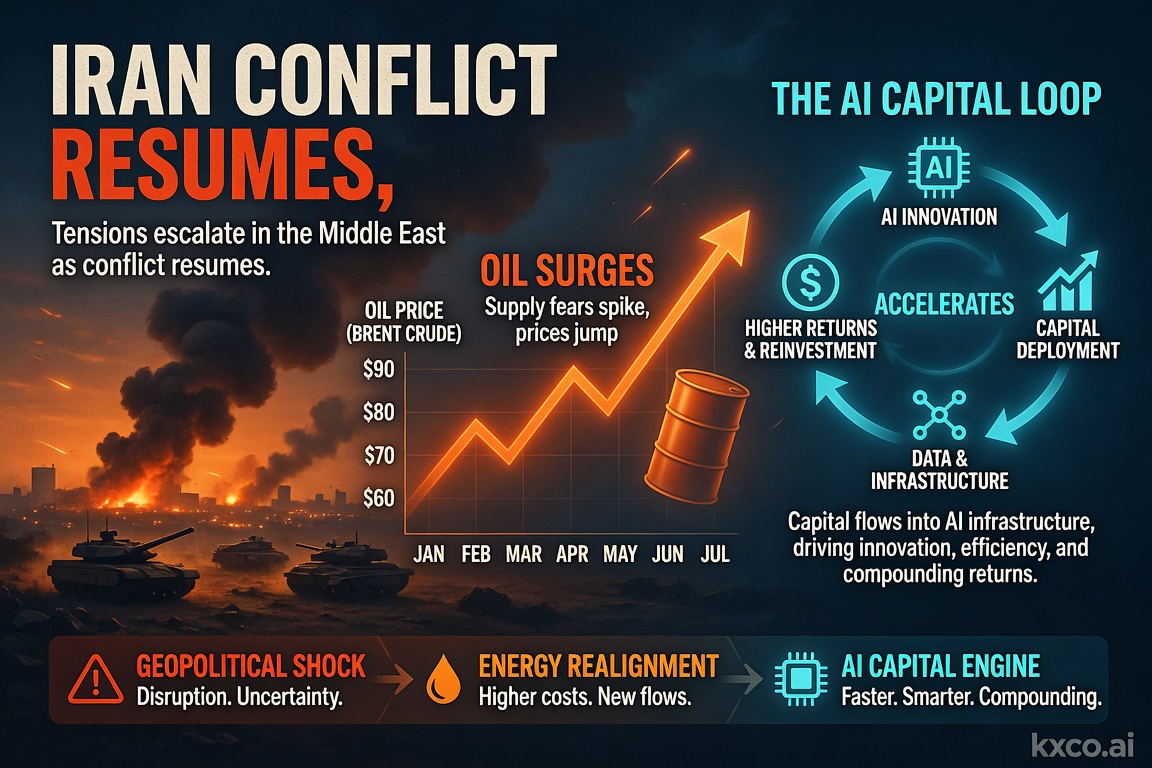
Economic Calendar and Trading Strategies for the Week Ahead: July 14–18, 2026
A pivotal week for markets: US strikes on Iran reignite the oil risk premium, June CPI and retail sales test the Fed's rate-cut path, and the $1 trillion AI capital loop keeps driving the tech trade. Full economic calendar plus trading strategies across oil, gold, Bitcoin, FX and AI stocks.

Quantum Computing Just Became an Institutional Risk
Shayne Heffernan on BlackRock's quantum-computing warning for Bitcoin and Ethereum, Google's cryptanalysis research, the two on-chain risk vectors, and how KXCO's Armature L1 — post-quantum from genesis, coordinated by its ontology — answers a threat that just went institutional.
Economic Calendar and Trading Strategies for July 7–11, 2026
A trader's guide to the week of July 7–11, 2026: the US and China economic calendar, the Fed-pivot test after a soft jobs report, and how to trade Nvidia, SpaceX, Bitcoin, the dollar, gold, silver, AI and quantum. Track every release on Live Trading News.
Every story, signed and delivered.
Subscribe to the kxco channel and get the headline, the AI-written key takeaways, and the chain-anchor link the moment we publish. Audio versions and per-ticker subscriptions arrive in the next iteration.