
What are Price fields?
Price fields are a crucial aspect of technical analysis in stock trading and are used to create charts and perform various technical analysis techniques. In metastock, there are various price fields available that can be utilized to determine trends, identify buying and selling opportunities, and assess market conditions.
Close Price: The close price is the price at which the security is traded at the end of the trading day. It is widely used as a key indicator of market sentiment and is a crucial factor in determining trend lines and chart patterns.
Open Price: The open price is the price at which the security is traded at the beginning of the trading day. This price field is useful in identifying gap-up or gap-down moves in the market and can provide important insights into market trends.
High Price: The high price is the highest price at which the security was traded during the day. It is used to determine resistance levels and can help traders identify key price points where selling may occur.
Low Price: The low price is the lowest price at which the security was traded during the day. It is used to determine support levels and can help traders identify key price points where buying may occur.
Adjusted Close Price: The adjusted close price takes into account corporate actions such as stock splits, dividends, and rights offerings. It is used to provide a more accurate reflection of the security's performance over time.
Median Price: The median price is the middle price between the high and low prices. It is used as a simple trend indicator and is often used in moving average calculations.
The following are some of the key reasons why price fields are important:
Trend Analysis: Price fields such as the close, open, high, and low prices are used to create trend lines and identify chart patterns. These trends and patterns can provide insights into market sentiment and help traders make informed decisions.
Resistance and Support Levels: The high and low prices of a security can be used to determine resistance and support levels, which are key price points where selling and buying may occur, respectively.
Corporate Actions: Corporate actions such as stock splits, dividends, and rights offerings can have a significant impact on a security's price. The adjusted close price takes these actions into account, providing a more accurate reflection of the security's performance over time.
Moving Averages: Moving averages are widely used technical indicators that can be calculated using price fields such as the close and median prices. They provide important information about the trend and momentum of a security.
Gap Analysis: The open and close prices of a security can be used to identify gap-up or gap-down moves in the market, providing important insights into market trends and conditions.
In summary, price fields are important in trading and technical analysis because they provide valuable information about a security's performance and market conditions. They are essential tools for informed trading decisions and should be thoroughly understood and utilized by traders. There are various price fields that MetaStock provide traders with valuable insights into market trends, conditions, and potential buying and selling opportunities.
This research was given by KXCO By Knightsbridge
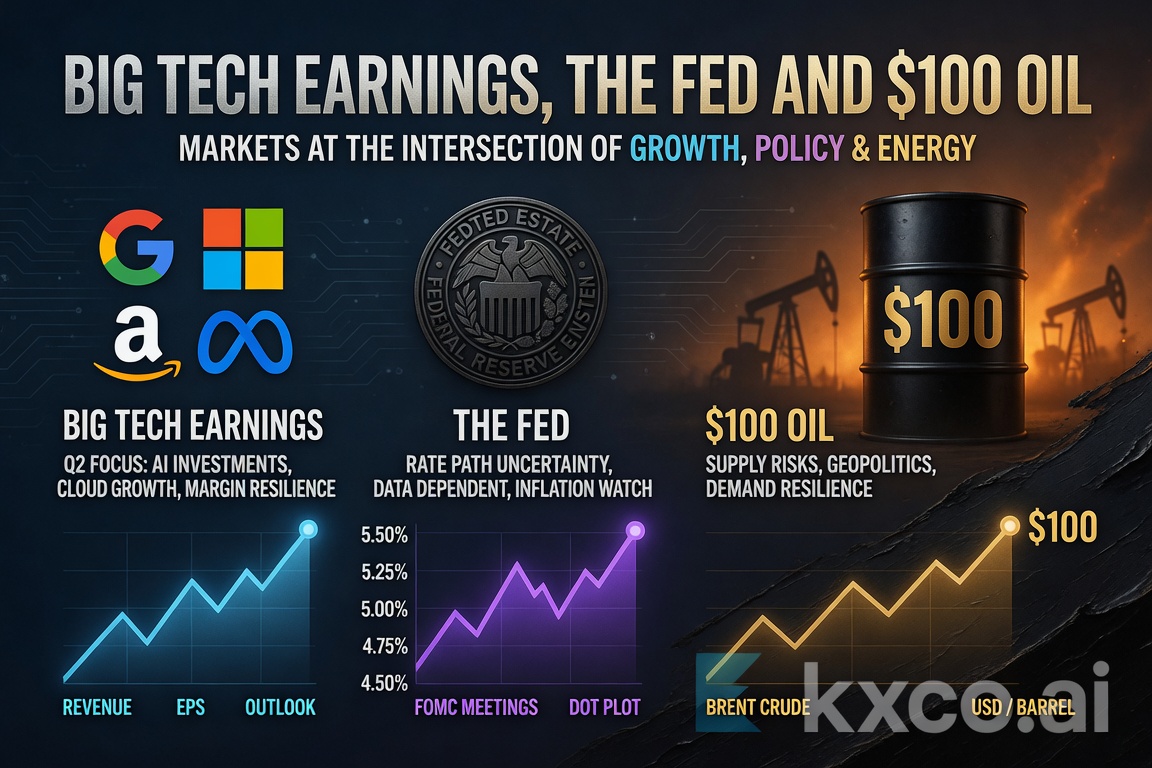
Big Tech Earnings, the Fed and $100 Oil. Trading Strategies for Every Sector
Microsoft, Meta, Apple and Amazon report, the Fed decides, and oil sits above $100. Shayne Heffernan on the week ahead, with the full economic calendar and a trading strategy for big tech, AI, quantum, gold, silver, FX and Bitcoin.
Economic Calendar and Trading Strategies for the Week Ahead: July 20–24, 2026
A pivotal week for markets: Iran's closure of the Strait of Hormuz sends crude above $86 and gasoline over $5, while Alphabet, Tesla and Intel earnings test the AI trade. Full economic calendar plus trading strategies across oil, gold, Bitcoin, FX and AI chip stocks.
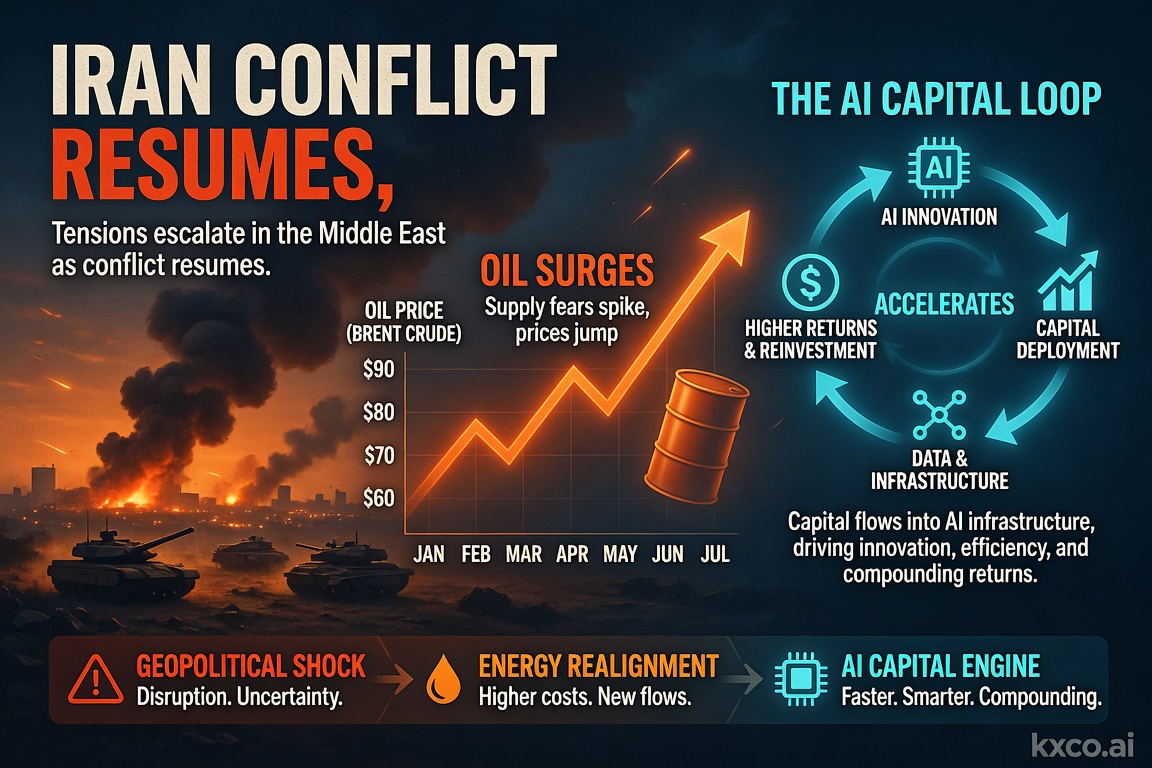
Economic Calendar and Trading Strategies for the Week Ahead: July 14–18, 2026
A pivotal week for markets: US strikes on Iran reignite the oil risk premium, June CPI and retail sales test the Fed's rate-cut path, and the $1 trillion AI capital loop keeps driving the tech trade. Full economic calendar plus trading strategies across oil, gold, Bitcoin, FX and AI stocks.

Quantum Computing Just Became an Institutional Risk
Shayne Heffernan on BlackRock's quantum-computing warning for Bitcoin and Ethereum, Google's cryptanalysis research, the two on-chain risk vectors, and how KXCO's Armature L1 — post-quantum from genesis, coordinated by its ontology — answers a threat that just went institutional.
Every story, signed and delivered.
Subscribe to the kxco channel and get the headline, the AI-written key takeaways, and the chain-anchor link the moment we publish. Audio versions and per-ticker subscriptions arrive in the next iteration.