
US Real Estate Falls Again
According to the Black Knight Home Price Index (HPI), median home prices fell 0.98% in August, only marginally better than July's upwardly revised 1.05% monthly decline
July and August 2022 mark the largest single-month price declines seen since January 2009 and rank among the eight largest on record
The monthly rate of home price decline is now rivaling that seen during the Great Recession – the question is how long it will continue to do so, and how far off peaks prices will fall
After rising sharply from May through July, for-sale inventory levels stalled in August, growing at just 1/10th the rate of recent months, as sellers appeared to take a step back from the market
The national inventory deficit held relatively steady at -44%, with the market remaining more than 600K listings short as compared to pre-pandemic levels
Sellers are likely being deterred by both falling demand and prices, along with a growing disincentive to give up historically low interest rate mortgages in a sharply rising rate environment
Today, the Data & Analytics division of Black Knight, Inc. (NYSE:BKI) released its latest Mortgage Monitor Report, based upon the company's industry-leading mortgage, real estate and public records datasets. With all eyes on the housing market, the most recent data from the Black Knight Home Price Index showed that home prices declined for a second consecutive month in August. As Black Knight Data & Analytics President Ben Graboske explains, July and August's month-over-month declines mark the sharpest contractions seen in more than 13 years.
"The Black Knight HPI for August marked the second consecutive month that prices pulled back at the national level, with the median home price now 2% off of its June peak," said Graboske. "Only marginally better than July's revised 1.05% monthly decline, home prices were down an additional 0.98% in August. Either one of them would have been the largest single-month price decline since January 2009 – together they represent two straight months of significant pullbacks after more than two years of record-breaking growth. The only months with materially higher single-month price declines than we've seen in July and August were in the winter of 2008, following the Lehman Brothers bankruptcy and subsequent financial crisis.
"Historically low inventory – along with record low interest rates – was one of the key drivers behind U.S. home prices seeing essentially a decade's worth of appreciation in just two-and-a-half years. Inventory levels had been improving though, with our Collateral Analytics data showing both overall inventory and months of supply rising sharply from May through July. We'd climbed from 1.7 months of for-sale inventory to 3.1 months before improvement stalled in August as sellers appeared to take a step back from the market. Inventory grew at just one-tenth the rate it had been, with the market still some 600K listings short of 'normal,' pre-pandemic levels. It will be worth watching inventory levels closely in coming months for any sign of a shift in seller sentiment. Right now, prospective sellers are not only coming to grips with falling demand and declining prices due to sharply higher interest rates, but they also have a growing disincentive to give up their own historically low-rate mortgages in this environment. Some may be waiting out the market to see if demand – and prices – return in the spring."
Though prices have pulled back from recent historic peaks, housing remains historically unaffordable. After improving slightly in July and early August, surging 30-year rates have pushed home affordability to its worst point in 38 years, easily surpassing June's – at the time – record-setting 34.3% payment-to-income ratio. With rates at 6.7% as of Sept. 29, 38.2% of the median household income is needed to make the principal and interest (P&I) payment on the median-priced home purchase, the largest share since December 1984, when mortgage rates were at 13.2%. The monthly P&I payment on the median home is up $930 from the same time last year – a 73% increase. The situation is geographically widespread as well, with 84 of the 100 largest U.S. markets now at more than three-decade lows in terms of home affordability.
Much more information on these and other topics can be found in this month's Mortgage Monitor.
About the Mortgage Monitor
The Data & Analytics division of Black Knight manages the nation's leading repository of loan-level residential mortgage data and performance information covering the majority of the overall market, including tens of millions of loans across the spectrum of credit products and more than 160 million historical records. The combined insight of the Black Knight HPI and Collateral Analytics' home price and real estate data provides one of the most complete, accurate and timely measures of home prices available, covering 95% of U.S. residential properties down to the ZIP-code level. In addition, the company maintains one of the most robust public property records databases available, covering 99.9% of the U.S. population and households from more than 3,100 counties.
Black Knight's research experts carefully analyze this data to produce a summary supplemented by dozens of charts and graphs that reflect trend and point-in-time observations for the monthly Mortgage Monitor Report. To review the full report, visit: https://www.blackknightinc.com/data-reports/
About Black Knight
Black Knight, Inc. (NYSE:BKI) is an award-winning software, data and analytics company that drives innovation in the mortgage lending and servicing and real estate industries, as well as the capital and secondary markets. Businesses leverage our robust, integrated solutions across the entire homeownership life cycle to help retain existing customers, gain new customers, mitigate risk and operate more effectively.
Our clients rely on our proven, comprehensive, scalable products and our unwavering commitment to delivering superior client support to achieve their strategic goals and better serving their customers. For more information on Black Knight, please visit www.blackknightinc.com/.


Ontology: Agentic AI and Infrastructure
The AI trade so far has been a compute trade. The next leg is a meaning trade — and ontology, secured and settled, is the layer almost everyone is skipping. Shayne Heffernan on why ontology is the missing layer in agentic AI, and the infrastructure it needs.

Quantum Computing Just Became an Institutional Risk
Shayne Heffernan on BlackRock's quantum-computing warning for Bitcoin and Ethereum, Google's cryptanalysis research, the two on-chain risk vectors, and how KXCO's Armature L1 — post-quantum from genesis, coordinated by its ontology — answers a threat that just went institutional.
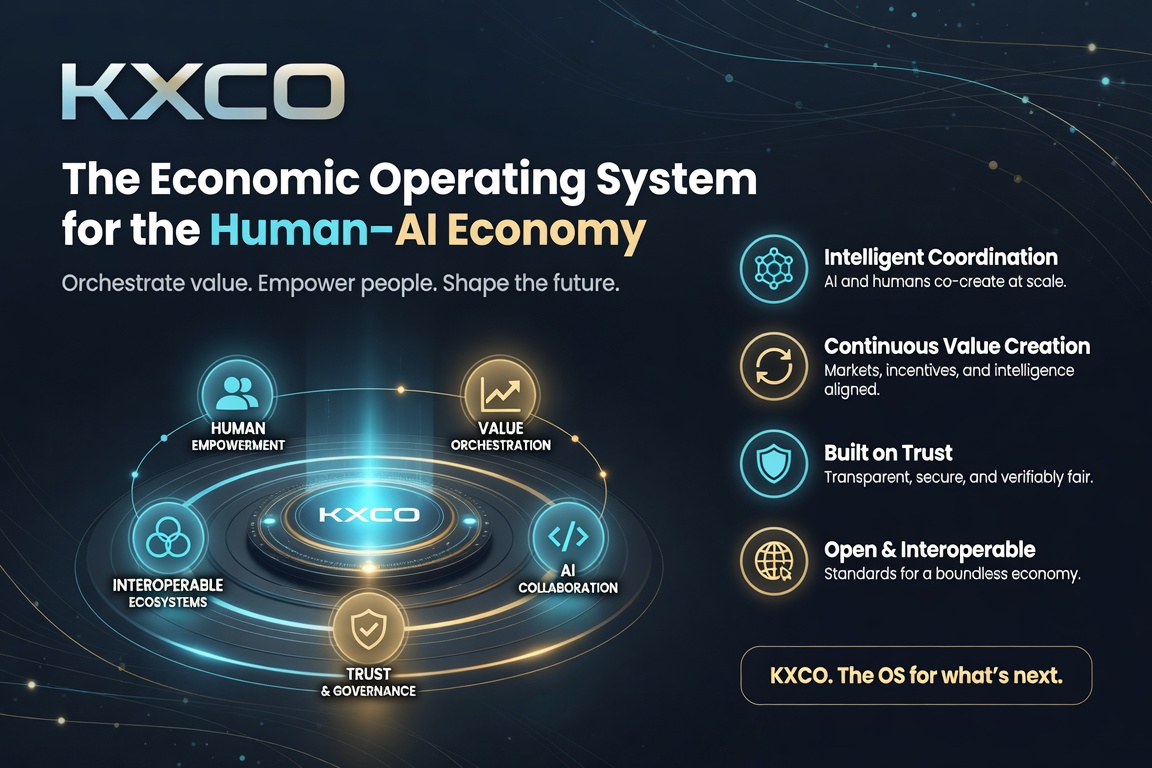
KXCO: The Economic Operating System for the Human–AI Economy
Shayne Heffernan on KXCO: a post-quantum Economic Operating System for the Human–AI Economy, where people, institutions and AI agents can prove what is real without trusting anyone's word for it — and why quantum-safe AI infrastructure is the foundation, not a feature.

AI and Quantum Computing Latest News
AI and quantum computing are converging into a single US-China contest. A fact-checked, investor-focused map of the model gap, the quantum milestones, the security imperative, and the stocks positioned across both — NVDA, GOOGL, MSFT, IBM, IONQ, TSM. By Shayne Heffernan.
Every story, signed and delivered.
Subscribe to the kxco channel and get the headline, the AI-written key takeaways, and the chain-anchor link the moment we publish. Audio versions and per-ticker subscriptions arrive in the next iteration.