
The World is Set for a Strong Economic Recovery
#economic #recovery #VirusCasedemic #Japan #machine #tools
Japan’s exports accelerated in January, led by a rise in Chinese demand, and manufacturers’ sentiment turned positive for the 1st time since Y 2019 signaling a recovery from last year’s VirusCasedemic deep dive.
Core machinery orders, a Key leading indicator of capital spending, rose in December, an encouraging sign for a private sector-led recovery, even as renewed curbs to contain the virus weighed on business activity.
The Key indicators followed Q-4 GDP data Monday that showed Japan’s economy grew more than expected
Japanese stocks rose to a 30-year high Tuesday as progress in the distribution of virus vaccines boosted expectations that the global economy is set for a strong recovery.
The Nikkei 225 Index ended up 1.28% at 30,467.75, closing at its highest since August 1990.
The broader TOPIX rose 0.57% to 1,965.08 and marked its highest since June 1991.
Tuesday, the benchmark US stock market indexes finished at: DJIA +64.35 at 31522.75, NAS Comp -47.97 at 14047.52, S&P 500 -2.24 at 3932.59
Volume: Trade on the NYSE came in at 1.0-B/shares exchanged
HeffX-LTN's overall technical outlook of the US major stock market indexes is Bullish with a Very Bullish bias in here.
Russell 2000 +15.1% YTD
NAS Comp +9.0% YTD
S&P 500 +4.7% YTD
DJIA +3.0% YTD
Looking Ahead: Wednesday investors will receive Retail Sales for January, the Producer Price Index for January, Industrial Production and Capacity Utilization for January, the FOMC Minutes, the NAHB Housing Index for February, Business Inventories for December, and the wkly MBA Mortgage Applications Index.
Have a healthy day, Keep the Faith!
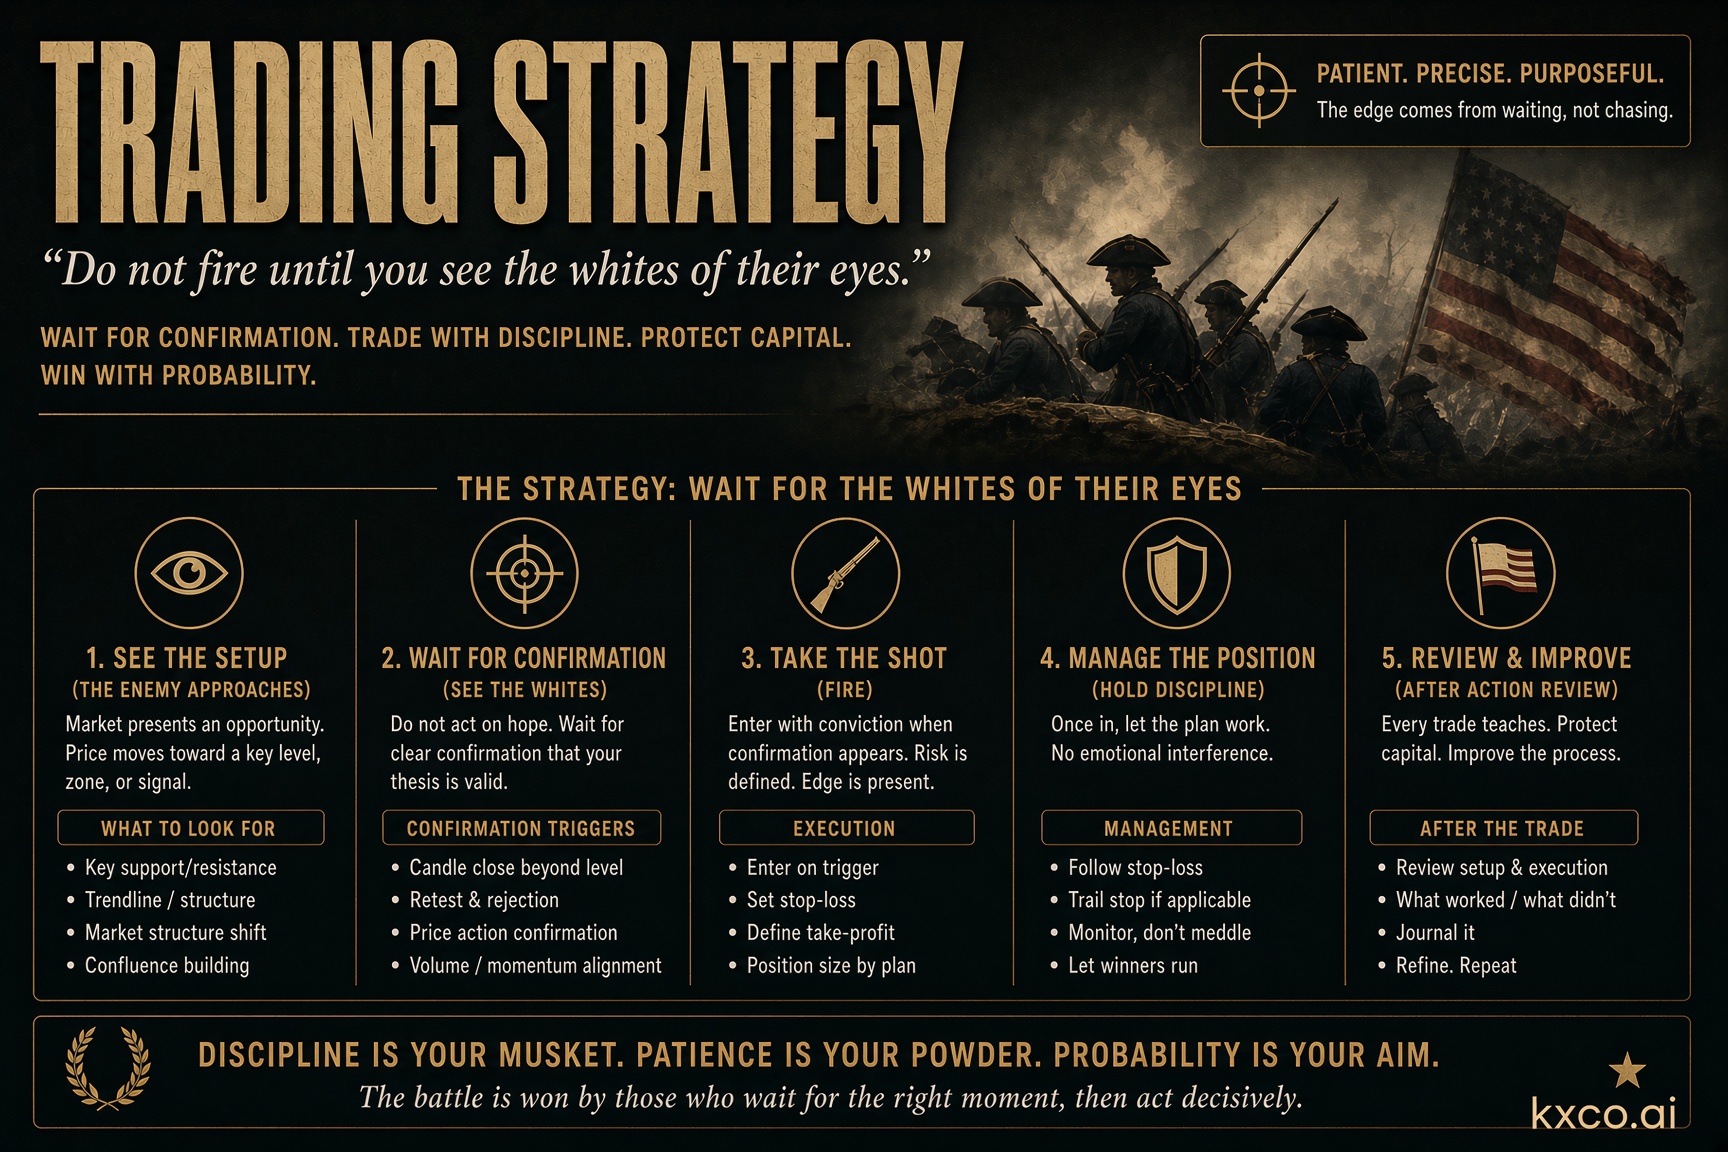
Economic Calendar and Trading Strategy This Week
The S&P 500 closed at a record on Friday and the tape is bullish, so the job this week is choosing, not chasing. Palantir is up 28.6 per cent from the KXCO ontology's recorded 15 July snapshot and SpaceX is up 15.6 per cent since we published on 22 July. Here is the full economic calendar for 10 to 14 August, what each print means for positioning, and the fourteen value gaps the ontology's Analyst Outlook layer is pointing at, from Oracle at 70 per cent down to Arm at 2 per cent.

Understanding the US China AI and Quantum Landscape
AI and quantum are usually reported as a US–China race. The more useful story is two different systems — frontier capital versus open-source scale — entangled through shared chokepoints. Shayne Heffernan maps the landscape with the KXCO AI Sector Ontology, with comparison graphics and the investable names.
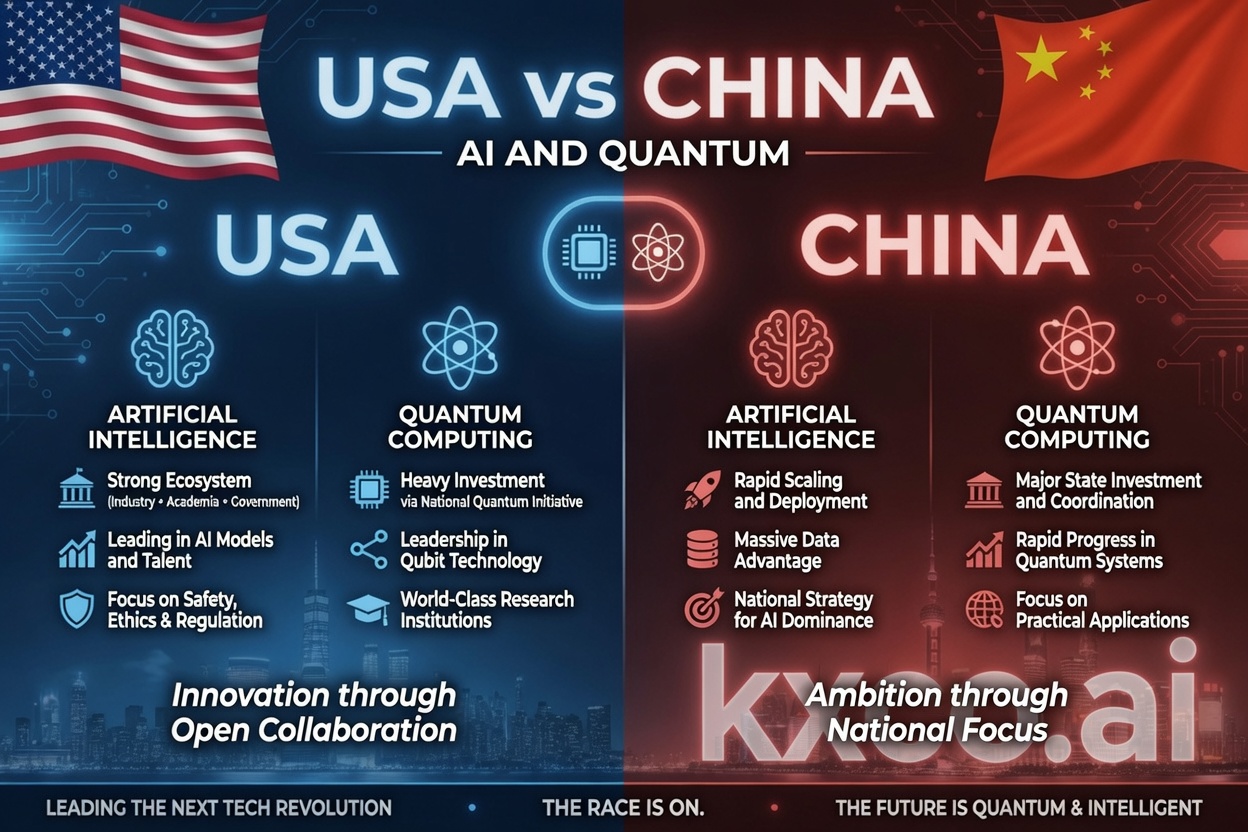
USA vs China: The AI and Quantum Scorecard
The US still leads AI models and chips by a whisker; China leads power and open-weight models outright. Shayne Heffernan scores the four races that will decide the decade.
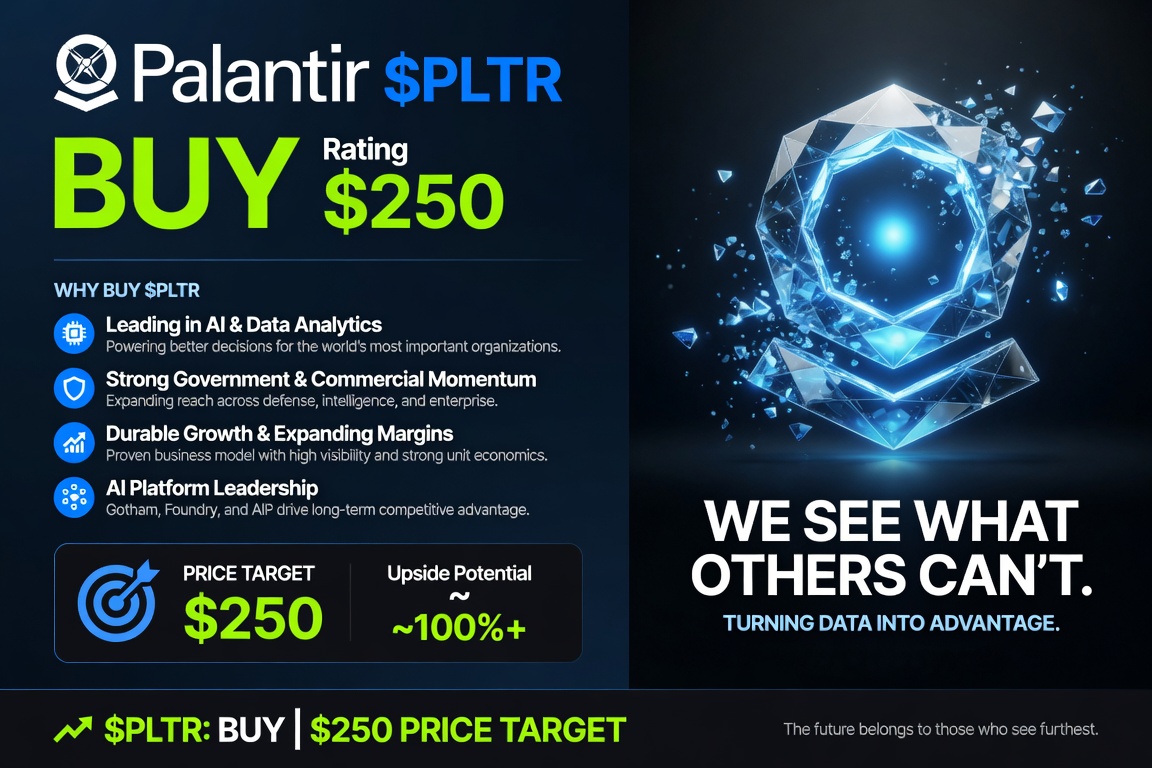
Palantir Stock (PLTR): BUY Rating, $250 Price Target — The 40% Dislocation
Palantir is down ~40% in 2026 even as Q1 revenue grew 85% and management guided FY2026 to $7.66B. Shayne Heffernan issues a BUY on PLTR with a $250 price target — full breakdown of the business, customers, five-year revenue, every major Wall Street bank target and the corporate outlook.
Every story, signed and delivered.
Subscribe to the kxco channel and get the headline, the AI-written key takeaways, and the chain-anchor link the moment we publish. Audio versions and per-ticker subscriptions arrive in the next iteration.