
Intel Share Price Jumps On New CEO
A big black candle occurred. This is bearish, as prices closed significantly lower than they opened. If the candle appears when prices are "high," it may be the first sign of a top. If it occurs when prices are confronting an overhead resistance area (e.g., a moving average, trendline, or price resistance level), the long black candle adds credibility to the resistance. Similarly, if the candle appears as prices break below a support area, the long black candle confirms the failure of the support area.
During the past 10 bars, there have been 6 white candles and 4 black candles for a net of 2 white candles. During the past 50 bars, there have been 30 white candles and 20 black candles for a net of 10 white candles.
A rising window occurred (where the top of the previous shadow is below the bottom of the current shadow). This usually implies a continuation of a bullish trend. There have been 4 rising windows in the last 50 candles--this makes the current rising window even more bullish.
#Intel are surging Wednesday after the company said it would be replacing Swan with VMware Inc. Chief Executive Pat Gelsinger. Intel’s stock INTC is up nearly 8% in morning trading, while VMware shares are off 4%.
Intel said in a release that the announcement “is unrelated to Intel’s 2020 financial performance” and that the company expects to exceed its fourth-quarter revenue and earnings guidance.
Intel closed up 3.945 at 57.185. Volume was 129% above average (neutral) and Bollinger Bands were 46% wider than normal.

Short-term traders should pay closer attention to buy/sell arrows while intermediate/long-term traders should place greater emphasis on the bullish or bearish trend reflected in the lower ribbon.
Summary
Intel gapped up today (bullish) on normal volume.
Possibility of a Runaway Gap which usually signifies a continuation of the trend.
Four types of price gaps exist - Common, Breakaway, Runaway, and Exhaustion. Gaps acts as support/resistance.
Intel is currently 7.0% above its 200-period moving average and is in an upward trend.
Volatility is extremely high when compared to the average volatility over the last 10 periods.
There is a good possibility that volatility will decrease and prices will stabilize in the near term.
Our volume indicators reflect volume flowing into and out of Intel at a relatively equal pace (neutral).
Our trend forecasting oscillators are currently bullish on Intel and have had this outlook for the last 6 periods.
Our momentum oscillator is currently indicating that Intel is currently in an overbought condition.
Overall, the bias in prices is: Upwards.
A big black candle occurred.
This is bearish, as prices closed significantly lower than they opened.
If the candle appears when prices are "high," it may be the first sign of a top.
If it occurs when prices are confronting an overhead resistance area (e.g., a moving average, trendline, or price resistance level), the long black candle adds credibility to the resistance.
Similarly, if the candle appears as prices break below a support area, the long black candle confirms the failure of the support area.
During the past 10 bars, there have been 6 white candles and 4 black candles for a net of 2 white candles.
During the past 50 bars, there have been 30 white candles and 20 black candles for a net of 10 white candles.
A rising window occurred (where the top of the previous shadow is below the bottom of the current shadow).
This usually implies a continuation of a bullish trend.
There have been 4 rising windows in the last 50 candles--this makes the current rising window even more bullish.
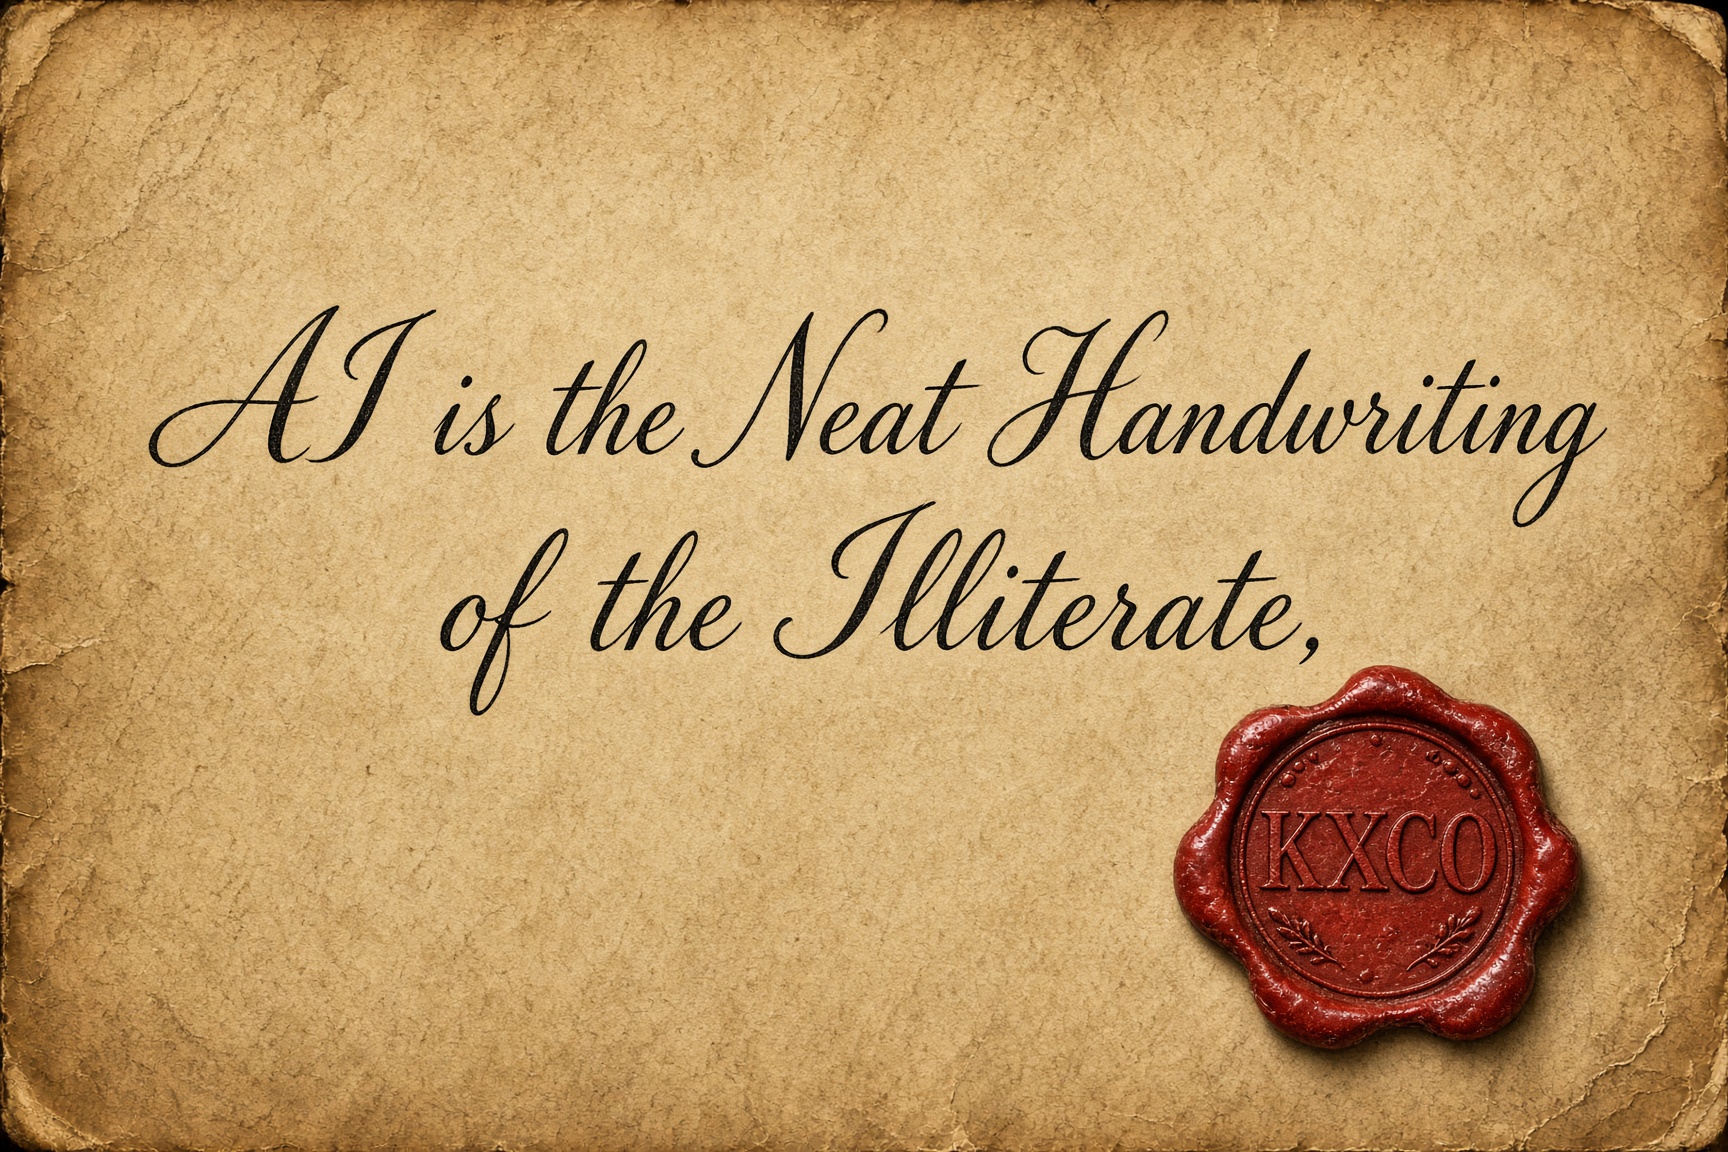
AI is the Neat Handwriting of the Illiterate
A model in the hands of someone who has read the filing and walked the plant is a clerk. The same model, speaking for someone who has done neither, is a disguise. On AI slop, phantom citations and factslop, why finish stopped being evidence of work, and the containment layer KXCO built so a machine cannot speak as the institution until a source is attached.
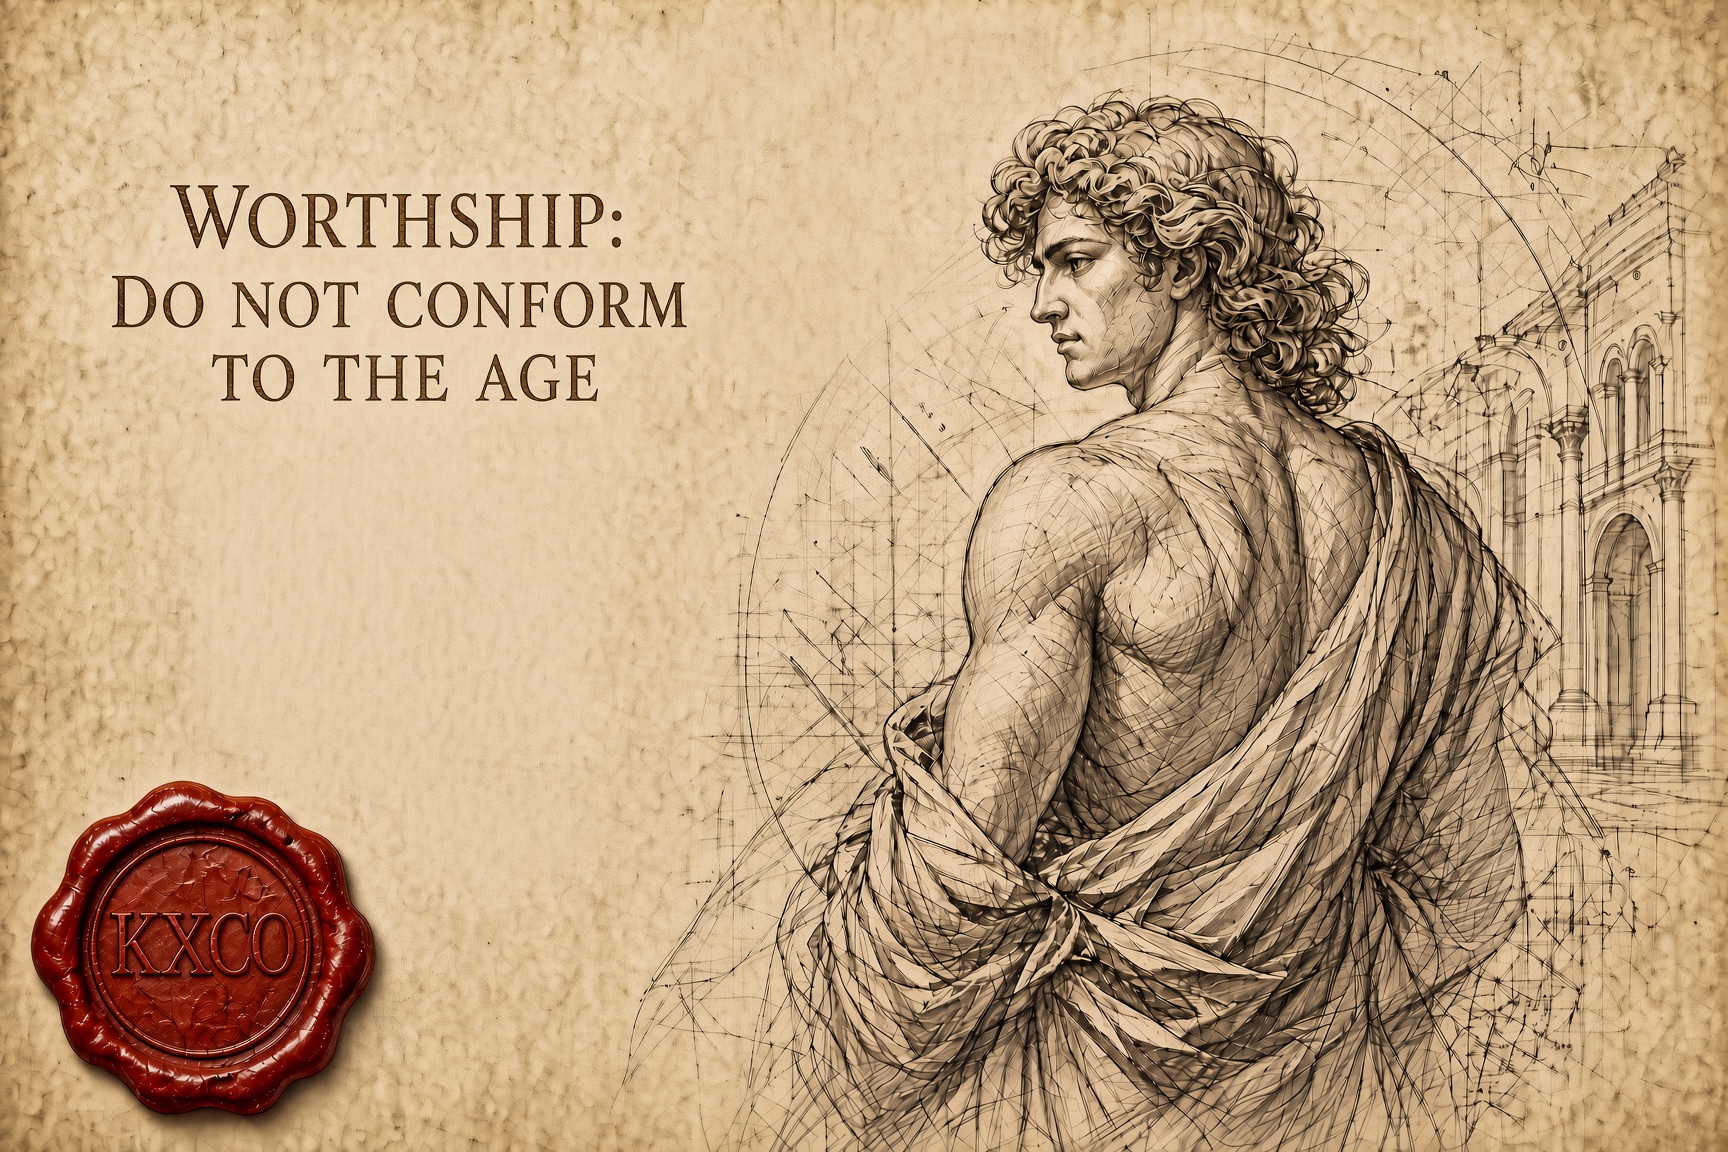
Worthship: Do Not Conform to the Age
Worthship is the older English word for worship, and it means to ascribe worth. Bishop Robert Barron preached Romans 12 on 30 August. This essay follows the text into the prison letters, and puts two questions to a graph: do the four readings of that Sunday agree, and was Paul free or in chains when he wrote about despair?
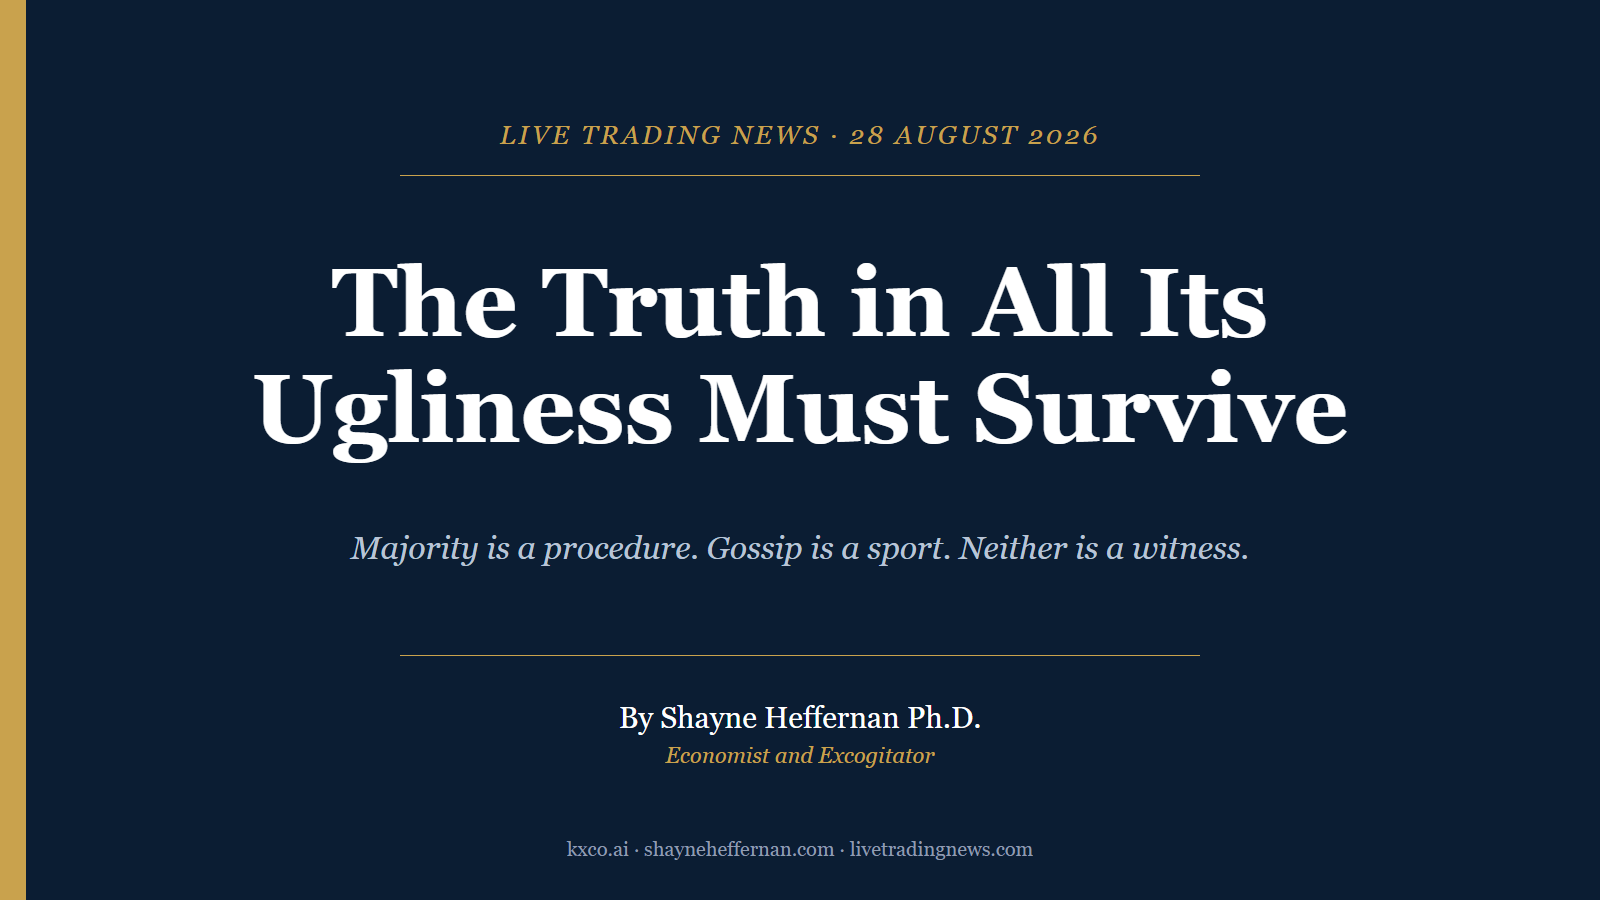
The Truth in All Its Ugliness Must Survive
A majority vote does not determine the truth. Consensus is a mood, gossip is a sport, and a model will write the pretty version for free. Why the ugly number has to survive, why a record beats a dashboard, and what KXCO was built to keep standing when the room changes its mind.
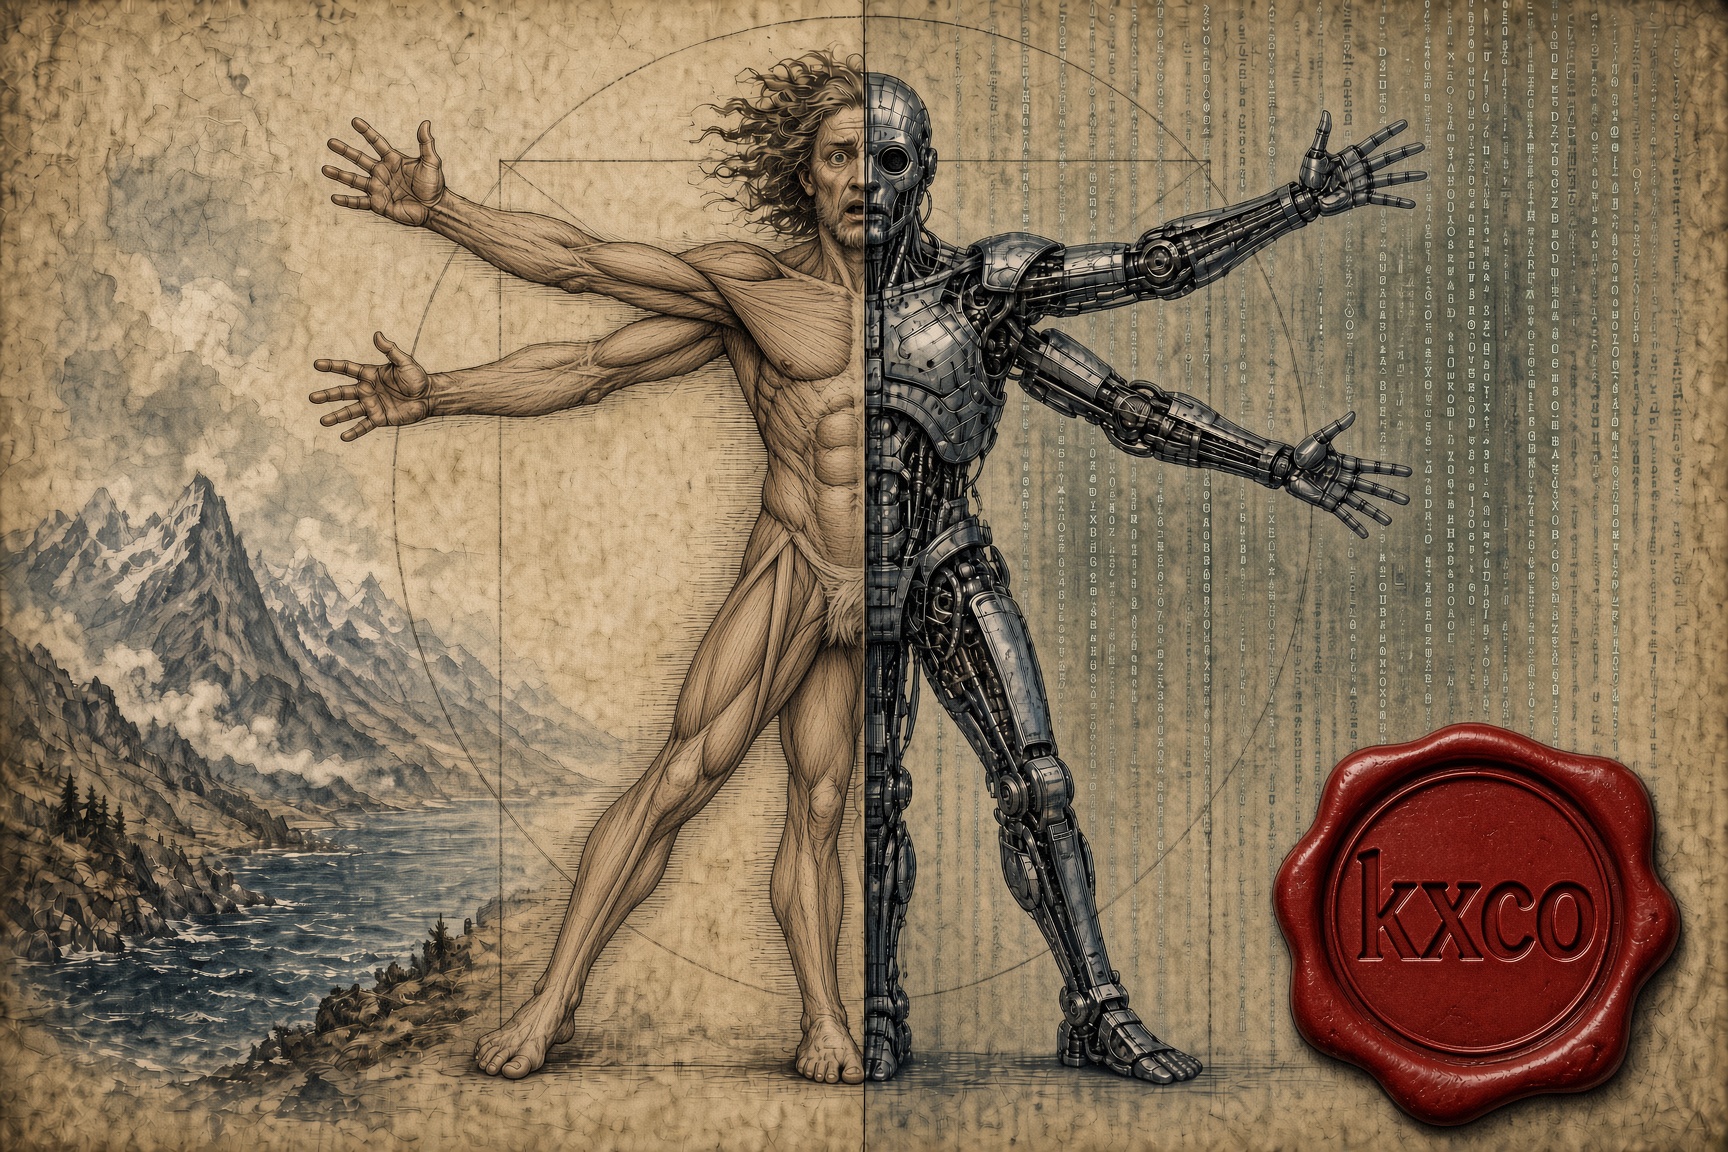
Don't Be the Best, Be the Only: Winning in an AI World
AI is repricing competence downward. What it cannot reproduce is a life. The case for remaining non-fungible, why friction still produces the best ideas, and what it means to build AI systems that keep the human intellect in them.
Every story, signed and delivered.
Subscribe to the kxco channel and get the headline, the AI-written key takeaways, and the chain-anchor link the moment we publish. Audio versions and per-ticker subscriptions arrive in the next iteration.