
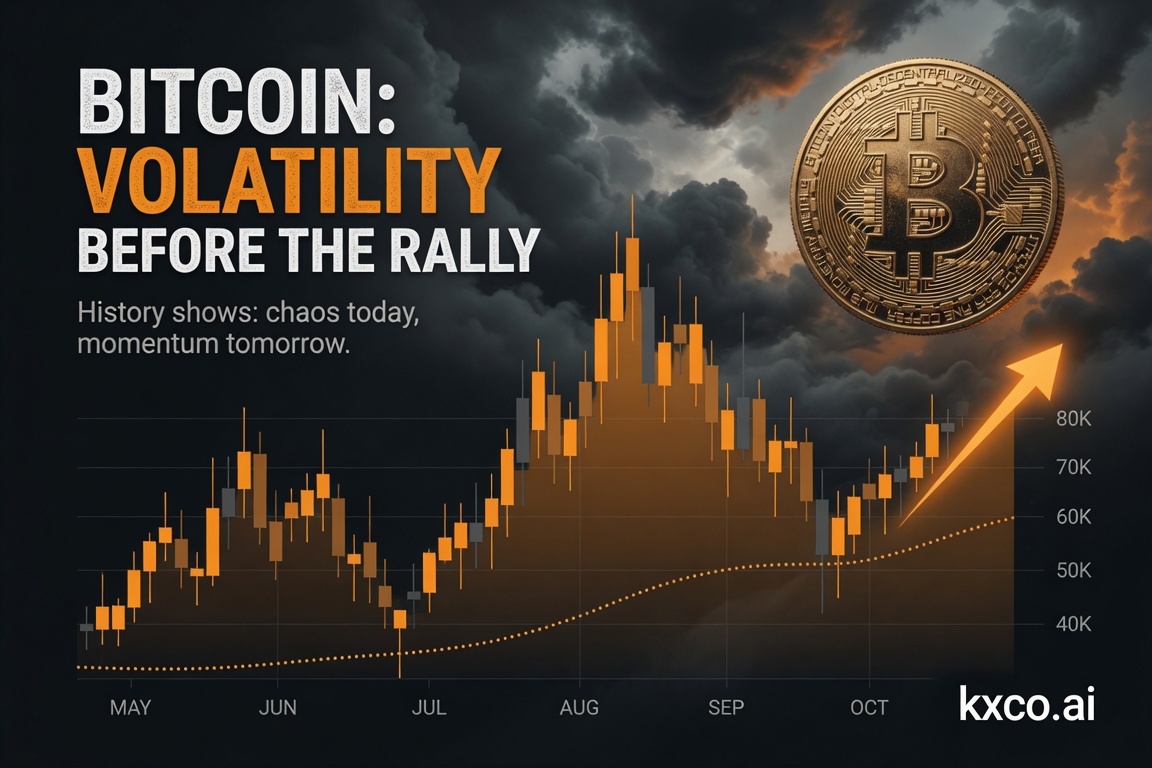
Bitcoin: Volatility Before the Rally
The candles are coiling beneath a thinning Ichimoku cloud while the spendable float vanishes into treasuries, ETFs and sovereign reserves. A second, reflexive supply shock is forming under the derivatives market.
by Shayne Heffernan
Bitcoin closed Friday's session at roughly $63,900, sitting almost exactly where it has spent the better part of two weeks — chopping in a tightening range between the low-$61,000s and the mid-$66,000s after sliding from the mid-$70,000s at the start of June. To a casual observer the tape looks tired, even bearish. To anyone who has watched enough cycles, this is the shape of a market storing energy: a contraction in price volatility sitting directly on top of an expansion in structural scarcity. The two cannot coexist forever.
This is a read of two things at once — what the candlesticks and the Ichimoku cloud are saying on the chart, and what the on-chain and balance-sheet data are saying about who actually owns the coins. When those two pictures disagree as sharply as they do today, the chart loses the argument almost every time, because price is a lagging shadow of supply and demand, not the other way round. My read is unambiguous: this is a coiled, late-stage accumulation setup, and the asymmetry is heavily skewed to the upside. Let me show you why.
1. The Chart: Compression Under a Thinning Cloud

Start with the candles. From the 20 May high near $77,600, Bitcoin printed a series of lower highs and rolled over hard through the first ten days of June, bottoming at $60,888 on 6 June. Since then the candle bodies have shrunk dramatically. We have gone from $3,000–$5,000 daily ranges during the sell-off to $700–$1,300 ranges over the last week. The wicks have stopped reaching. That is the classic signature of a market that has finished distributing and started accumulating — the sellers who needed to sell have largely sold, and the price is now being passed back and forth in an increasingly narrow band.
Now overlay the Ichimoku Kinko Hyo, because that is the lens this chart is being read through. Three things stand out, and they tell a deliberately mixed story.
One — price is below the cloud (the Kumo), and that is the opportunity, not the warning. Yes, in textbook Ichimoku a below-cloud reading is corrective — trend-followers wait for a reclaim. But every major bitcoin advance of the last decade began with price below the cloud, in exactly this kind of disbelief. The conversion line (Tenkan-sen) and base line (Kijun-sen) sit just overhead, which means the reclaim trigger is close, not distant. Buying confirmation above the cloud is comfortable; buying the coil beneath it, while the float disappears, is where the real asymmetry has always lived.
Two — the cloud ahead is thinning and flattening. This is the part most people miss. The forward Kumo, projected 26 periods out, has lost most of its thickness and is twisting toward a flat ceiling. A thin, flat cloud is a weak cloud. It means the cushion of resistance above price is structurally fragile — the kind of barrier that holds until the day it suddenly doesn't. When price compresses into a flat, thin cloud, a breakout through it tends to be fast and disorderly, precisely because there is so little volume memory inside the cloud to slow it down.
Three — the lagging span (Chikou) is curling back toward price. The Chikou is simply today's close plotted 26 periods back. As price flattens and the historical comparison rolls into the recent consolidation, the lagging span is being squeezed against the candles rather than hanging freely below them. That compression of the Chikou against price is one of the subtler tells that a directional resolution is getting closer, not further away.
"A quiet chart sitting under a thin cloud is not a sleepy chart. It is a chart that has run out of room to stay quiet."
Put the pieces together and the tape is showing one thing: volatility compression below a resistance lid that is rapidly losing its strength. Bollinger Bands tell the same story from another angle — the bands have pinched into one of their tightest readings of the quarter, and a squeeze of this degree has reliably preceded an expansion move within days to a couple of weeks. A squeeze loads energy; it does not, on its own, name the direction. But you do not read the chart in a vacuum. The moment you overlay who is buying the float being compressed, the direction stops being a coin flip and starts looking like a foregone conclusion. For that, you leave the chart and look at the coins.
2. Who Actually Owns the Coins: Spot BTC by the Major Players
Here is where the bullish asymmetry lives, and it has nothing to do with a moving average. The single most important development of this cycle is that a handful of identifiable, disclosed, slow-moving holders have absorbed an enormous share of the liquid supply — and they are structurally disinclined to sell. Let me put hard numbers on "the major players."

Strategy (the company formerly known as MicroStrategy) reported 846,842 BTC as of 15 June 2026, acquired at an average price of $66,385 for a total outlay of about $33.1 billion. Its most recent disclosed purchase was 1,587 BTC for roughly $100 million on 15 June. Strategy is now the largest corporate holder of bitcoin on earth by an order of magnitude, and crucially it has publicly stated it has no intention of selling — its entire capital-markets machine exists to acquire more.
The US spot ETF complex has become the other gravitational mass. BlackRock's IBIT alone pushed past 800,000 BTC this year — it crossed that threshold in April with bitcoin near $78,000 — and commands roughly half of all US spot-ETF assets. Across all the US spot vehicles, the combined holding now sits near 1.64 million BTC. These are not trading hands; the overwhelming majority of ETF flow has been one-directional accumulation by advisors, pensions and wealth platforms allocating a strategic single-digit-percent sleeve.
Public companies in aggregate crossed 1.16 million BTC — more than 5% of all bitcoin that will ever exist — with Strategy the giant and a long tail behind it: Twenty One Capital (~43,500 BTC), Metaplanet (~40,200 BTC), MARA Holdings (~35,300 BTC), Bullish (~24,300 BTC) and dozens more. And the US Government holds roughly 328,372 BTC in the Strategic Bitcoin Reserve established by executive order in March 2025 — coins that, as policy currently stands, are to be held and not sold.
Stack it up. Between US spot ETFs, Strategy, the rest of the corporate treasuries, and the US Government, you are looking at well over 3 million BTC — north of 14% of the entire fixed supply — sitting in wallets whose owners are, by mandate or by stated strategy, holders rather than sellers. Every one of those coins is a coin that is no longer available to the marginal seller on an exchange. That is the backdrop the thin Ichimoku cloud is sitting on top of.
3. Institutional Adoption Is Still Accelerating, Not Plateauing
The bearish read on a $63,900 print is "the ETF trade is over, the institutions are done." The data says the opposite. BlackRock's IBIT recorded net inflows on 48 of 62 trading days in the first quarter of 2026, pulling in an estimated $8.4 billion over the quarter — and that is one fund. The spot-ETF wrapper did something no prior cycle had: it turned bitcoin into a line item a fiduciary can buy without career risk, settled through the same rails as every other ETF in a client's account.
That changes the character of demand. Retail buys with sentiment and sells with fear. Model portfolios and treasury-strategy corporates buy on a schedule, rebalance on a calendar, and add on weakness because their thesis is denominated in years, not candles. When you replace a flighty marginal buyer with a programmatic one, you compress the supply available for sale and you change who is left holding when sentiment turns. The float that remains liquid is increasingly the float held by the most price-insensitive participants in the history of the asset.
The adoption tell that matters: it is no longer about whether institutions will allocate — it is about how much float is left to allocate into. Each new mandate competes for a shrinking pool of freely-traded coins against issuance that was already cut in half in 2024.
4. The Money-Printing Backdrop: A $130 Trillion Tide
None of the demand story happens in a vacuum. It happens against the largest pool of money in human history, and that pool is growing again. Global M2 — the broad measure of cash, deposits and near-money across the major economies — has pushed to record territory near $130 trillion, a fresh all-time high. After the disinflation fight of 2023–24, 2026 has seen money-supply growth re-accelerate to a multi-year high as the Federal Reserve has leaned back toward balance-sheet expansion, with the other major central banks easing in parallel.

This matters for bitcoin in the most mechanical way possible. Bitcoin's supply schedule is fixed and shrinking; the supply of the currency it is priced in is variable and growing. When the denominator (dollars, broadly defined) expands while the numerator (spendable BTC) contracts, the exchange rate between them does not need a narrative to drift higher — it only needs time. Global liquidity has been the single most reliable macro companion to bitcoin's multi-year trend, and that tide is rising again, not receding.
5. The Math That Should Worry the Shorts: Mining vs. Strategy Alone
Now the centerpiece. After the April 2024 halving, the network issues 3.125 BTC per block. At roughly 144 blocks a day that is about 450 new BTC per day — call it 164,250 coins across a full year. That is the entire planet's fresh supply: every miner, every pool, every rig from Texas to Kazakhstan, combined. At ~$64,000, the network mints about $29 million of new bitcoin daily.
Set that against a single corporate buyer. Strategy's 15 June purchase was 1,587 BTC — that one transaction swallowed roughly three and a half days of the entire global mining output. Earlier purchases this cycle have been larger still; a 3,273-BTC buy is more than a week of worldwide issuance absorbed by one company in one print. And zoom out to the full year: in 2024 alone Strategy added about 258,000 BTC — more than 1.5 times every coin the network produced that year.

That is one company. Layer in the ETF complex pulling billions of dollars of net inflows in a single quarter, the rest of the corporate treasury cohort, and a US Government that is mandated to hold rather than sell, and the arithmetic becomes almost absurd: structural demand from disclosed long-term holders has been running at a multiple of new issuance. Markets clear by price. When persistent demand exceeds new supply against a backdrop of holders who refuse to part with inventory, the only variable left to move is the price required to coax a coin loose. Today, that price is being negotiated inside a very quiet, very tight range. That quiet is the anomaly, not the resolution.
| Supply / demand metric | Figure | |---|---| | New BTC per block (post-2024 halving) | 3.125 | | New BTC per day (≈144 blocks) | ~450 | | New BTC per year | ~164,250 | | BTC left to mine (of 21M cap) | ~971,400 | | Strategy single purchase, 15 Jun 2026 | 1,587 | | Strategy net additions, full-year 2024 | ~258,000 | | Next halving (issuance → ~225/day) | ~Apr 2028 |
6. The Tidal Wave of Derivatives — and the Second Supply Shock
Here is the part that ties the chart back to the plumbing, and it is where I think the genuinely interesting risk is building. Sitting on top of this thin spot market is an enormous and fast-growing derivatives complex. Aggregate bitcoin options open interest has run around $65 billion in notional, with futures open interest near $60 billion; options open interest has actually exceeded futures since mid-2025, a structural shift toward leverage and optionality as the dominant way large players express a view. The CME alone carries multiple billions in regulated futures open interest.
Most of the time, the derivatives market is where price discovery happens cheaply — you can get bitcoin exposure without touching a coin. But that very feature is what makes it dangerous in a thin spot market. A derivatives stack this large is built on a spot float this small. The notional value of paper bitcoin changing hands dwarfs the value of actual coins available to settle against it. As long as everything stays orderly, the paper market simply absorbs the volatility. The problem is what happens when it stops being orderly.
Consider the mechanics of an upside break. Dealers who have sold call options are short gamma; as price rises through strike clusters, they are forced to buy spot or futures to stay hedged. In a deep market, that hedging is a ripple. In a market where 450 coins a day are minted and the largest buyers won't sell at any reasonable price, that hedging demand has to chase a float that is already being vacuumed up by ETFs and treasuries. The derivatives that were supposed to substitute for spot suddenly demand spot — all at once, on the way up. That is the textbook setup for a gamma squeeze, and it is the second supply shock I think is quietly assembling beneath the surface.
"The first supply shock was the halving — programmed, expected, priced. The second one is reflexive: a derivatives complex so large it can be forced to bid for coins that simply are not there."
The first supply shock is the one everyone knows: the halving cut new issuance from 900 to 450 coins a day in 2024, and it will halve again toward 225 a day in 2028. That is the mechanical, scheduled shock. The second shock is reflexive rather than scheduled. It is the moment a leveraged, options-heavy market is forced to source physical bitcoin to cover hedges, in a float that disclosed long-term holders have already cornered. You cannot settle a gamma squeeze with an IOU forever; eventually someone has to deliver coins, and the coins are the one thing in genuinely short supply. That is the mechanism by which a quiet, range-bound chart can become a vertical one in a handful of sessions.
7. The Breakout Roadmap — and the One Line That Would Change My Mind
I want to be clear about where I stand: I think the path of least resistance from here is up, and I think the resolution is closer than the sleepy tape suggests. The setup is the most lopsided this market has offered in over a year — a vanishing float, expanding global money, relentless ETF accumulation and a derivatives stack primed to force-bid coins. That is not a "maybe higher someday" thesis; it is a market being wound tighter by the week. I owe you one honest caveat and then a roadmap. The caveat: the trend signal has not technically flipped until BTC reclaims the cloud, and leverage cuts both ways — a break of the early-June floor on heavy volume would put the thesis on ice and could accelerate a flush lower. I respect that risk. I just think the weight of evidence sits firmly on the other side.
So here is the roadmap I am watching for confirmation, in order — each box that ticks raises my conviction further:
The cloud reclaim. A daily close back inside, then above, the Ichimoku cloud — with the Tenkan crossing up through the Kijun — is the technical green light. Until then, this is a coil, not a confirmed bottom.
The range edges. The $60,800–$61,000 floor from early June is the line in the sand. Hold it and the compression-into-thin-cloud thesis stays alive. Lose it on volume and the path of least resistance flips down toward the next liquidity shelf.
ETF flow direction. Continued net inflows confirm the demand side is still vacuuming float. A multi-week reversal to net outflows would be the single most important warning that the supply-shock thesis is on hold.
Open-interest build with rising price. If price breaks up and futures/options open interest climbs alongside it, that is the gamma-squeeze fuel lighting. Rising price on falling OI is far less explosive.
Strategy's next 8-K. Another nine-figure purchase disclosure is, in effect, another few days of global issuance removed from the market in a single line item.
Step back and the tension resolves in one direction. On the chart, Bitcoin looks indecisive — pinned below a thinning cloud in the tightest range of the quarter. In the plumbing, the spendable float is being absorbed by the most price-insensitive holders the asset has ever had, against issuance that was already halved, against a $130 trillion wall of money that is expanding again, and beneath a derivatives market large enough to force-bid coins that do not exist. Those two pictures cannot both be right for long, and they almost never resolve in favour of the quiet one. Volatility compression is not a destination; it is the inhale before the move. When the pause ends in a market where the supply has quietly disappeared, the resolution tends to be violent, fast, and to the upside — the kind people remember and wish they had front-run.
I am not in the business of dates and price targets. I am in the business of asymmetry — and I have rarely seen it this skewed. Quiet chart, vanishing float, expanding money, leveraged paper stacked on a paper-thin spot base: every one of those vectors points the same way. The candles are whispering. The supply data is shouting. I know which one I trust, and I am positioned for the shout.
Shayne Heffernan is a markets analyst and the founder of KXCO. This article is market analysis and commentary for educational purposes only. It is not investment advice, a recommendation, or an offer to buy or sell any asset. Bitcoin is volatile and you can lose money. Figures are drawn from public sources as of 22 June 2026 — Crypto.com Exchange (price), Strategy company disclosures and bitcoin-treasury trackers, BlackRock/iShares and US spot-ETF reporting, the U.S. Treasury Strategic Bitcoin Reserve, central-bank M2 data, and public derivatives venues. Always do your own research. Charts and analysis: KXCO.ai.

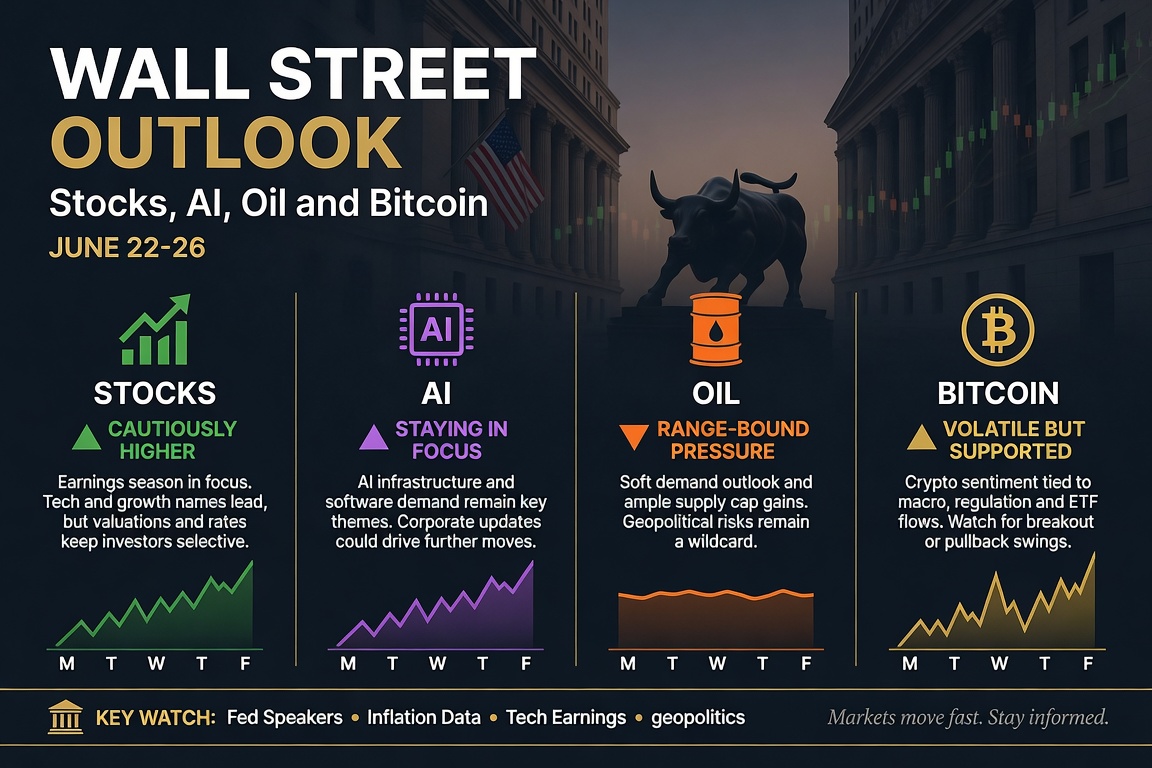
Wall Street Outlook: Stocks, AI, Oil and Bitcoin (June 22-26)
Our Wall Street outlook for the week ahead: a thin macro calendar puts Micron's earnings and the May PCE inflation print centre stage, against AI capital spending, the SpaceX debut, the Iran-driven oil round trip, a firm dollar and a sliding Bitcoin.
Knightsbridge Digital Asset: Expanding Use Cases in a Dynamic Financial Ecosystem
Boeing and Qatar Airways $BA Update
Bitcoin’s Quiet Surge $BTC
Every story, signed and delivered.
Subscribe to the kxco channel and get the headline, the AI-written key takeaways, and the chain-anchor link the moment we publish. Audio versions and per-ticker subscriptions arrive in the next iteration.