
Bitcoin, Buy the Dip at these Prices
Bitcoin is a buy there is not doubt, here are some technicals to help you choose your entry point, we are waiting for a break below $50,000 before buying more unless momentum changes.
Technical Outlook
Short Term: Overbought
Intermediate Term: Bullish
Long Term: Bullish
Bollinger Bands are 141.79% wider than normal.
The large width of the bands suggest high volatility as compared to BTC's normal range. Therefore, the probability of volatility decreasing and prices entering (or remaining in) a trading range has increased for the near-term.
The bands have been in this wide range for 146 period(s). The probability of prices consolidating into a less volatile trading range increases the longer the bands remain in this wide range but don't count on it here Bitcoin is going to remain a roller coaster.

The recent price action around the bands compared to the action of the Relative Strength Index (RSI) does not suggest any trading opportunities at this time.
Momentum is a general term used to describe the speed at which prices move over a given time period. Generally, changes in momentum tend to lead to changes in prices. This expert shows the current values of four popular momentum indicators.
Stochastic Oscillator
One method of interpreting the Stochastic Oscillator is looking for overbought areas (above 80) and oversold areas (below 20). The Stochastic Oscillator is 73.0335. This is not an overbought or oversold reading. The last signal was a sell 0 period(s) ago.
Relative Strength Index (RSI)
The RSI shows overbought (above 70) and oversold (below 30) areas. The current value of the RSI is 58.94. This is not a topping or bottoming area. A buy or sell signal is generated when the RSI moves out of an overbought/oversold area. The last signal was a sell 20 period(s) ago.
Commodity Channel Index (CCI)
The CCI shows overbought (above 100) and oversold (below -100) areas. The current value of the CCI is 71. This is not a topping or bottoming area. The last signal was a sell 0 period(s) ago.
MACD
The Moving Average Convergence/Divergence indicator (MACD) gives signals when it crosses its 9 period signal line. The last signal was a buy 6 period(s) ago.
BTC is currently 124.1% above its 200-period moving average and is in an upward trend.
Volatility is extremely low when compared to the average volatility over the last 10 periods.
There is a good possibility that there will be an increase in volatility along with sharp price fluctuations in the near future.
Our volume indicators reflect moderate flows of volume into BTC (mildly bullish). Our trend forecasting oscillators are currently bullish on BTC and have had this outlook for the last 5 periods.
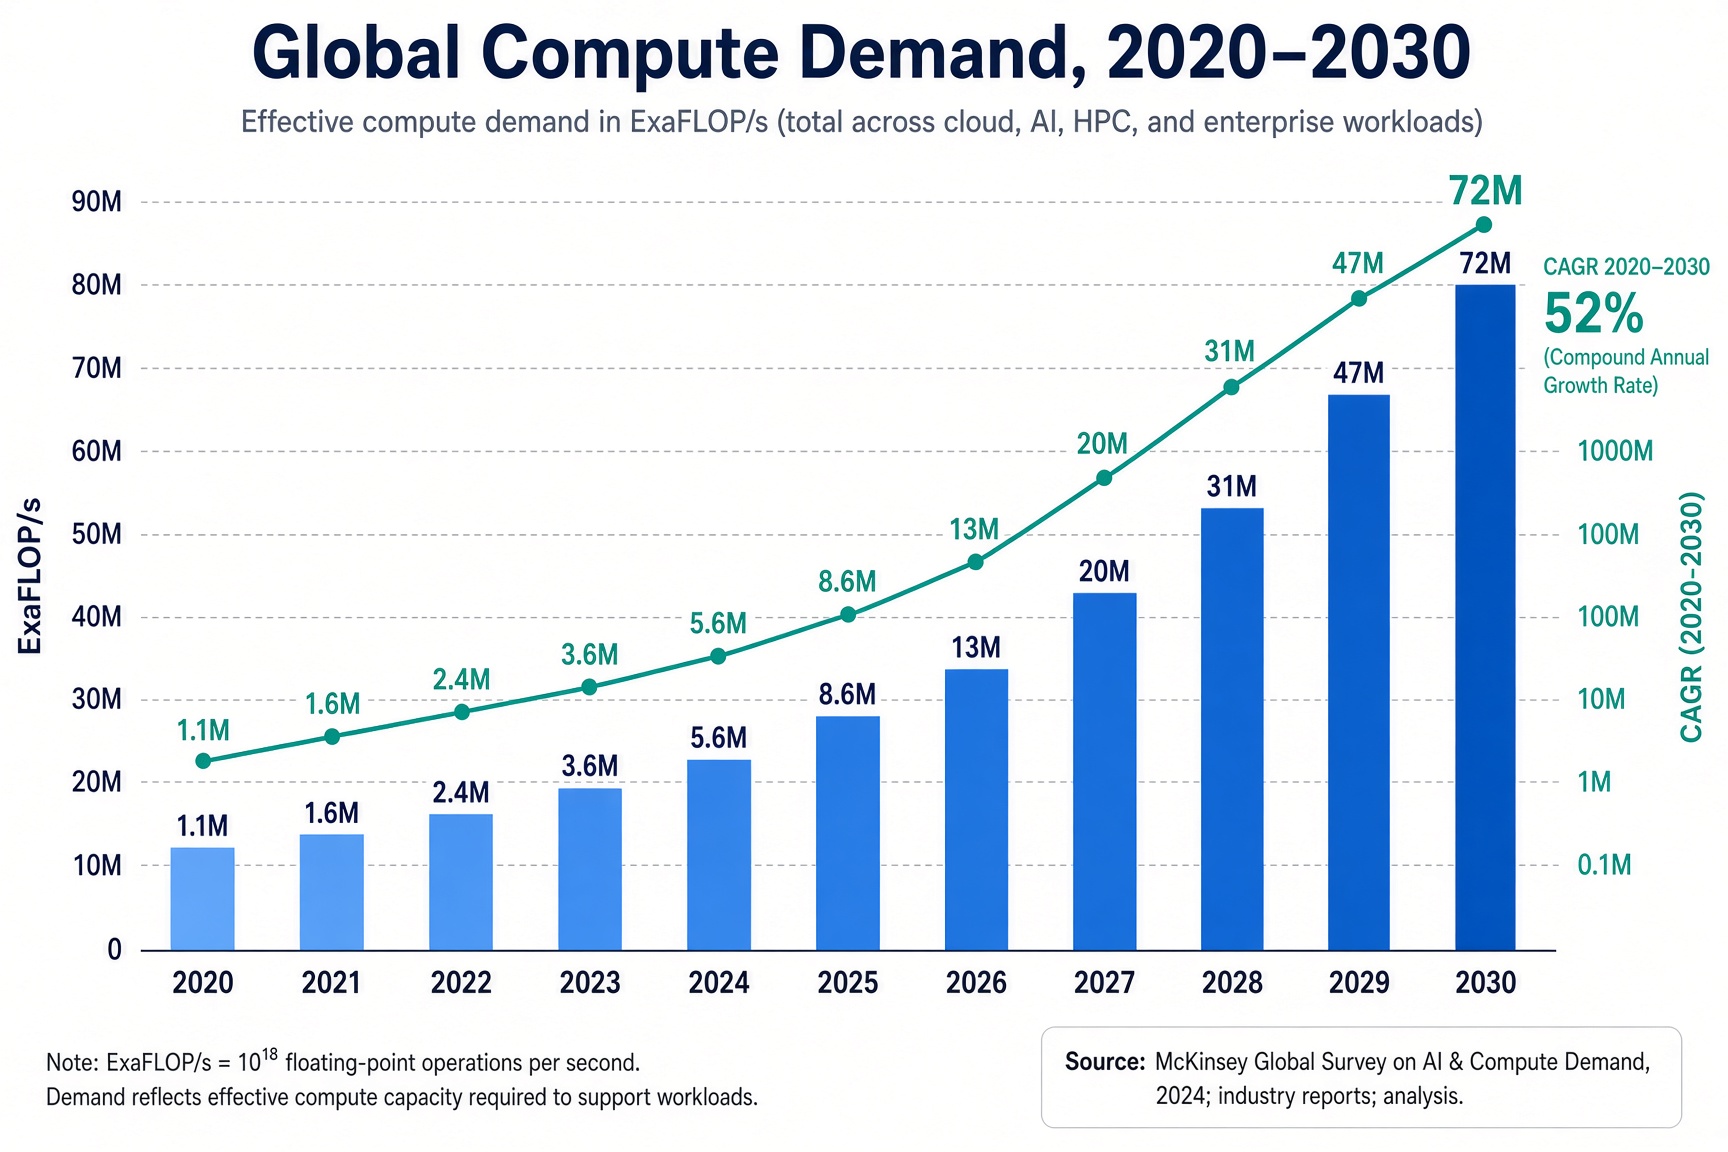
The 2030 Compute Landscape: GPUs, Power and the Architecture of Intelligence
The constraint on AI is no longer ideas or data but compute and the power to run it. Frontier training compute has grown about five times a year since 2020, and the leading AI supercomputer of June 2030 is on course for about 2 million chips and 9 gigawatts. Shayne Heffernan sets out the 2030 arithmetic, the power problem, who has already contracted the gigawatts, and how GPUs, custom ASICs, wafer-scale engines and quantum machines divide the work.
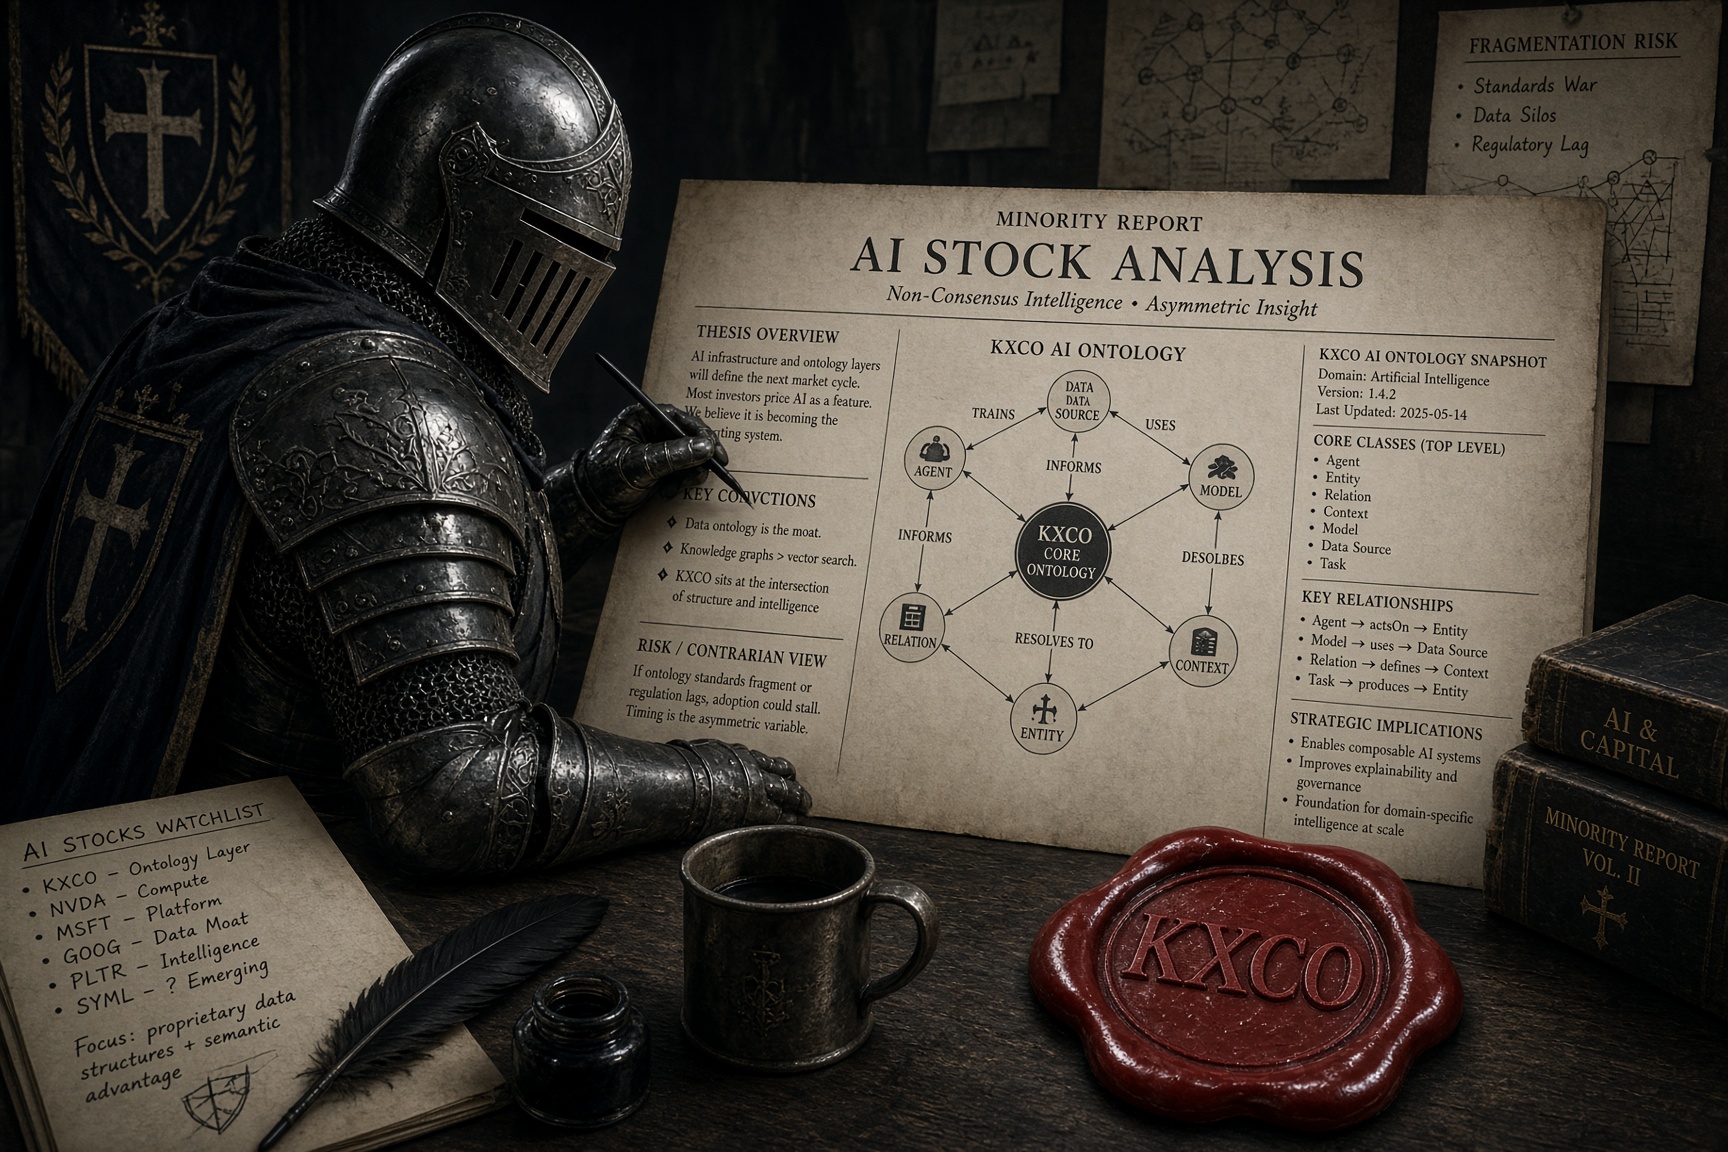
KXCO AI Ontology at 3 Months: What It Called and What Comes Next
On 19 July 2026 the Round Table's AI room published its first Analyst Outlook. To the 16 October 2026 close its 13 names rose 2.6% on an equal weight against 2.1% for QQQ, per StockAnalysis closes, and the six it opened with 35% or more of upside rose 8.6%. This piece lists the six names up more than 5%, the ten names I rate as opportunities now, the month's results in AI and quantum computing, and the official data showing that four in five firms have not yet started using AI.
SpaceX: The Road to 10 Gigawatts
SpaceX did not add an AI business. A company whose processes run on compute built its own computing plant, then built the power to run it. The 10-Q reports 1.4 gigawatts of nameplate compute at 30 June 2026, four leases worth about $41 billion a year and $100 billion of cash. The target is closer to 10 gigawatts than 5 by the end of 2027. This piece sets out the build sequence, the four layers of power in Memphis, and why Terafab is the act after 2027, not the road to it.
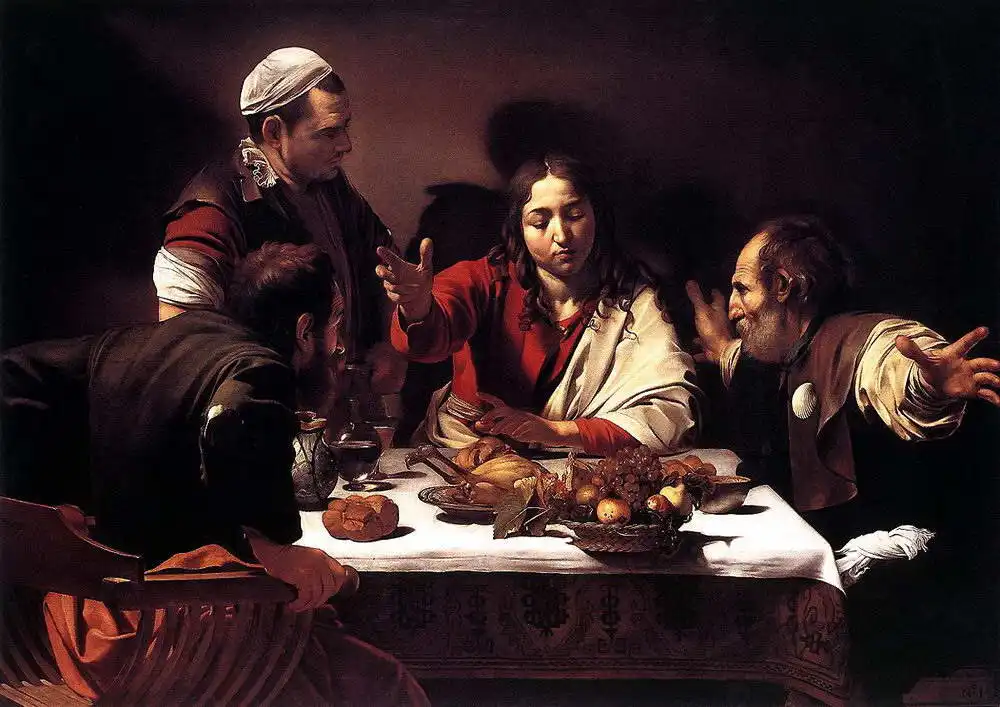
Thoughts on Thinking: Take an Art Break
The best way I know to keep complex work in perspective is to stop at intervals and look at something that took the same order of sustained attention under real constraints. The studies now show what that does: a museum visit restored attention where an urban walk did not, judging the beauty of an object raised abstract thinking almost 14 per cent, and artistic film raised originality even in people who felt worse for it. Five works, Leonardo to Holbein, and the non-default decision in each.
Every story, signed and delivered.
Subscribe to the kxco channel and get the headline, the AI-written key takeaways, and the chain-anchor link the moment we publish. Audio versions and per-ticker subscriptions arrive in the next iteration.