Overall, the bias in prices is: Upwards
Short term: Prices are moving
Intermediate term: Prices are trending
By the way, prices are vulnerable to a correction towards 18.45.
The projected upper bound is: 27.80.
The projected lower bound is: 18.15.
The projected closing price is: 19.01.
Relevant News:
Amata Coporation (AMATA) reveals it expects land sales to hit 1,000 rai (1.6million square meters) of land in 2021.
(A rai (Thai: ไร่, pronounced [râj]) is a unit of area equal to 1,600 square metres (16 ares, 0.16 hectares, 0.3954 acres), and is used in measuring land area for a cadastre or cadastral map.)
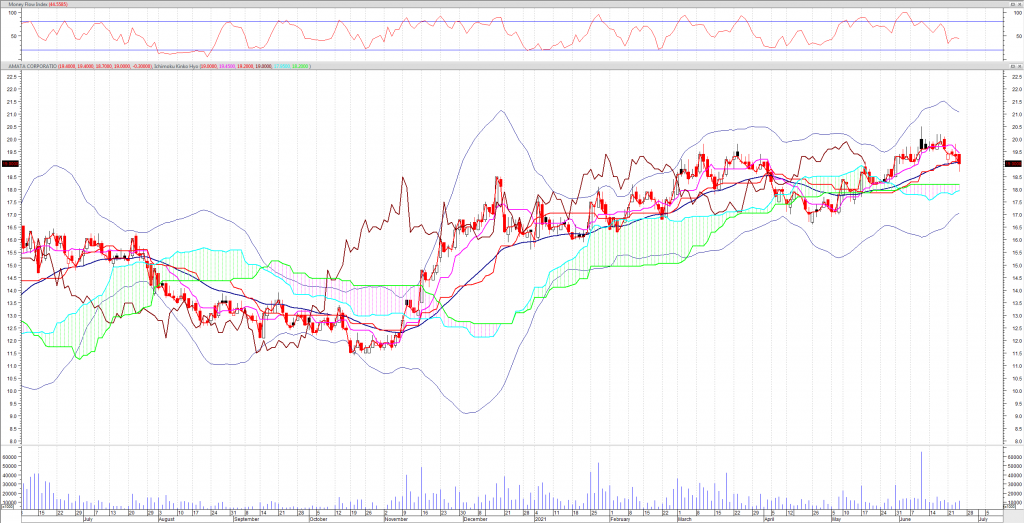
AMATA CORPORATION closed down -0.300 at 19.000. Volume was 17% below average (neutral) and Bollinger Bands were 35% narrower than normal.
Open High Low Close Volume
19.400 19.400 18.700 19.000 11,890,500
Technical Outlook
Short Term: Neutral
Intermediate Term: Bullish
Long Term: Bullish
Moving Averages: 10-period 50-period 200-period
Close: 19.53 18.40 16.24
Volatility: 16 30 51
Volume: 11,407,360 12,621,915 13,699,323
Short-term traders should pay closer attention to buy/sell arrows while intermediate/long-term traders should place greater emphasis on the Bullish or Bearish trend reflected in the lower ribbon.
Summary
AMATA CORPORATIO is currently 17.0% above its 200-period moving average and is in an upward trend. Volatility is relatively normal as compared to the average volatility over the last 10 periods. Our volume indicators reflect moderate flows of volume into AMATA.BK (mildly bullish). Our trend forecasting oscillators are currently bullish on AMATA.BK and have had this outlook for the last 27 periods.
Momentum Indicator
Momentum is a general term used to describe the speed at which prices move over a given time period. Generally, changes in momentum tend to lead to changes in prices. This expert shows the current values of four popular momentum indicators.
Stochastic Oscillator
One method of interpreting the Stochastic Oscillator is looking for overbought areas (above 80) and oversold areas (below 20). The Stochastic Oscillator is 26.3157. This is not an overbought or oversold reading. The last signal was a sell 14 period(s) ago.
Relative Strength Index (RSI)
The RSI shows overbought (above 70) and oversold (below 30) areas. The current value of the RSI is 48.15. This is not a topping or bottoming area. A buy or sell signal is generated when the RSI moves out of an overbought/oversold area. The last signal was a sell 4 period(s) ago.
Commodity Channel Index (CCI)
The CCI shows overbought (above 100) and oversold (below -100) areas. The current value of the CCI is -133.This is an oversold reading. However, a signal isn’t generated until the indicator crosses above -100. The last signal was a sell 4 period(s) ago.
MACD
The Moving Average Convergence/Divergence indicator (MACD) gives signals when it crosses its 9 period signal line. The last signal was a sell 3 period(s) ago.
Candlesticks
A big black candle occurred. This is bearish, as prices closed significantly lower than they opened. If the candle appears when prices are “high,” it may be the first sign of a top. If it occurs when prices are confronting an overhead resistance area (e.g., a moving average, trendline, or price resistance level), the long black candle adds credibility to the resistance. Similarly, if the candle appears as prices break below a support area, the long black candle confirms the failure of the support area.
During the past 10 bars, there have been 3 white candles and 6 black candles for a net of 3 black candles. During the past 50 bars, there have been 16 white candles and 27 black candles for a net of 11 black candles.
Three black candles occurred in the last three days. Although these candles were not big enough to create three black crows, the steady downward pattern is bearish.