
Thursday’s World Stock Markets: Asia-Pacific
#AsiaPacific#Australia#Japan #China#world#stocks
MSCI’s Asia sans-Japan stock index was weaker by 1.09%.
China stocks fell Thursday, with major indexes posting their worst decliner in more than 6 months
The Shanghai Composite index ended down 1.91% to 3,505.18. The blue-chip CSI300 index was down 2.73% to 5,377.14.
The Shenzhen index ended down 2.93% and the start-up board ChiNext Composite index was weaker by 3.632%.
Japanese shares suffered their biggest decliner in 6 months Thursday, tracking Wall Street, weighed by technology companies which have benefited from a recent rally in stocks.
The Nikkei share average fell 1.53% to 28,197.42, while the broader Topix slid 1.14% to 1,838.85.
Australian shares finished lower Thursday to record their worst session in 4 months.
The S&P/ASX 200 index dropped 1.9% to close at 6,649.7. New Zealand’s benchmark S&P/NZX 50 index finished 2.2% lower to 13,086.46
Asia-Pacific Indexes
Data as of 28 Jan 2021. All quotes delayed at least 15 minutes.
Symb
Index
Time
Last
Chg
Chg %
.TRXFLDJPP
Thomson Reuters Equity Japan Index
2:39am EST
160.98
-1.82
-1.12%
.TRXFLDHKP
Thomson Reuters Equity HK Index
4:40am EST
355.17
-10.61
-2.90%
.TRXFLDINP
Thomson Reuters Equity India Index
5:34am EST
1,607.99
-14.11
-0.87%
.N225
Nikkei Stock Average 225
1:15am EST
28,197.42
-437.79
-1.53%
.HSI
Hang Seng Index
3:08am EST
28,550.77
-746.76
-2.55%
.AORD
ASX All Ordinaries Index
1:30am EST
6,917.60
-142.60
-2.02%
.KS11
KOSPI Index
4:03am EST
3,069.05
-53.51
-1.71%
.SETI
SET Composite Index
4:59am EST
1,468.51
-29.62
-1.98%
.JKSE
Jakarta Composite
3:14am EST
5,979.39
-129.78
-2.12%
.PSI
PSE Composite Index
27 Jan 2021
6,851.84
-11.77
-0.17%
.SSEC
Shanghai Composite Index
2:00am EST
3,505.18
-68.17
-1.91%
.BSESN
S&P BSE Sensex
5:50am EST
46,874.36
-535.57
-1.13%
.FTFBMKLCI
FTSE Bursa Malaysia KLCI
27 Jan 2021
1,580.62
+5.31
+0.34%
.HNX30
HNX 30 Index
27 Jan 2021
303.61
-27.12
-8.20%

Understanding the US China AI and Quantum Landscape
AI and quantum are usually reported as a US–China race. The more useful story is two different systems — frontier capital versus open-source scale — entangled through shared chokepoints. Shayne Heffernan maps the landscape with the KXCO AI Sector Ontology, with comparison graphics and the investable names.
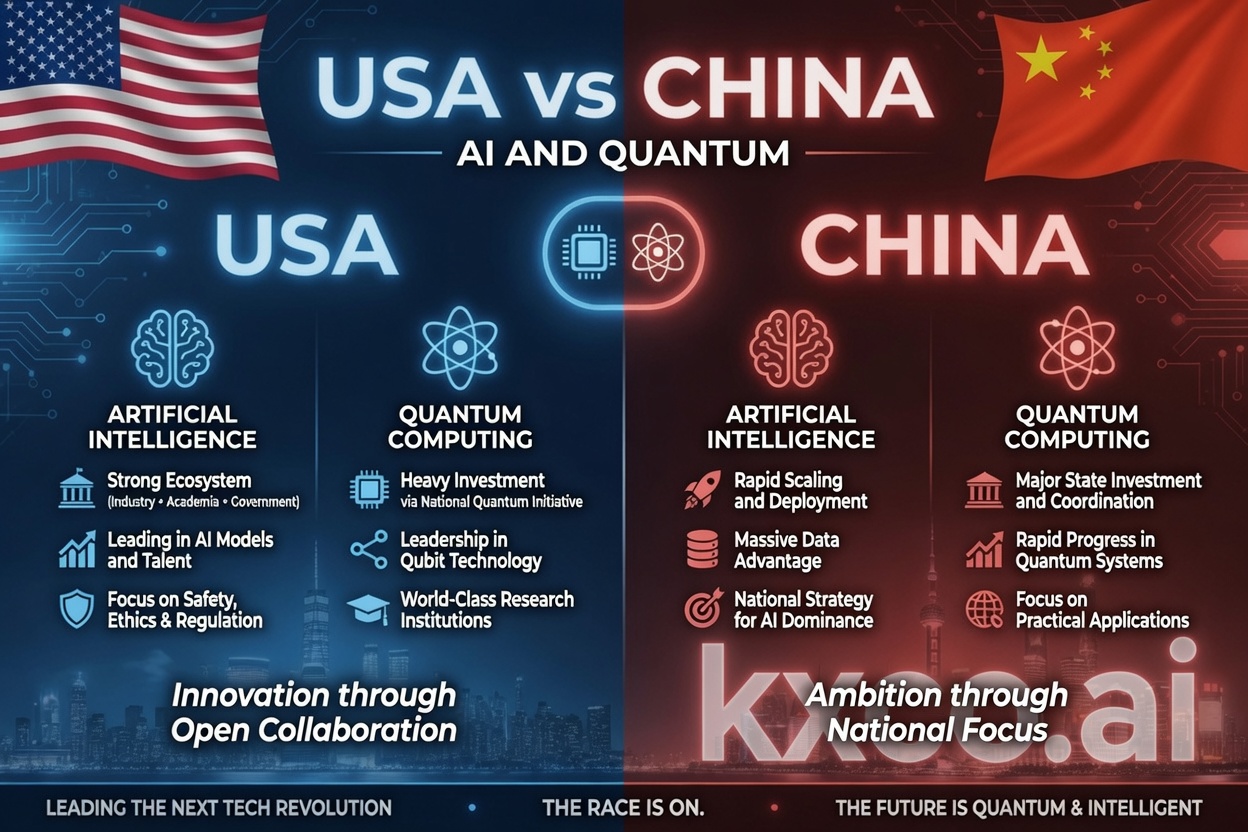
USA vs China: The AI and Quantum Scorecard
The US still leads AI models and chips by a whisker; China leads power and open-weight models outright. Shayne Heffernan scores the four races that will decide the decade.
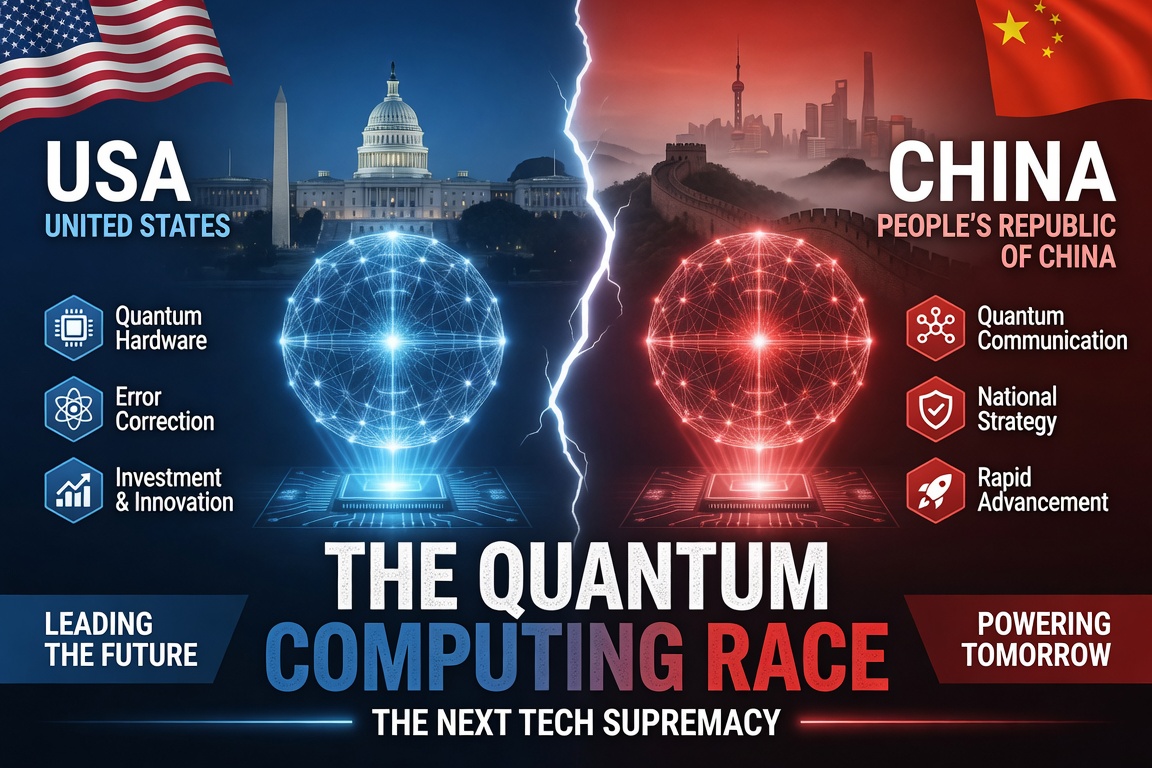
USA vs China: The Quantum Computing Race
The U.S. still leads quantum computing, but China has closed the gap fast — on hardware scale, supply-chain self-reliance and quantum networking. A category-by-category scorecard as of June 2026.

Larry Fink Called It. CME Just Made It Real. The Compute Futures Market Has Arrived
Every story, signed and delivered.
Subscribe to the kxco channel and get the headline, the AI-written key takeaways, and the chain-anchor link the moment we publish. Audio versions and per-ticker subscriptions arrive in the next iteration.