
The Week the Discount Rate Gets a Vote
Economic calendar, dollar, gold, Bitcoin, the AI complex on KXCO Ontology Live, and the stops under the quantum cohort. Week of 28 September to 2 October 2026.

Bangkok desk, 28 September 2026. Confirm every release on the trading page before you size a position. Calendar and live boards: livetradingnews.com/trading. AI complex: livetradingnews.com/center/ai-stocks.
What this note is for
This is the weekly map, not a list of tickers. The Federal Reserve raised the funds rate by a quarter point on 16 September, the first increase in three years, and left the door open to another move before year-end. Oil is still pricing a conflict that has run into its seventh month. The White House chose not to widen the strike set. Into that mix the tape gets the August personal consumption expenditures price index on Wednesday, the September employment report on Friday, a Reserve Bank of Australia decision on Tuesday, and a euro-area inflation print on Friday that the consensus has already marked higher on energy. Those are not background items. They are the discount rate.
Gold, Bitcoin, the dollar crosses, the AI infrastructure names and the quantum pure plays do not share a story. They share a rate. A hot labor print or a sticky core PCE print lifts real yields and the dollar, and it taxes every long-duration claim on the board: Nvidia's multiple, IonQ's milestone premium, gold's real-rate sensitivity, and Bitcoin's liquidity beta. A soft print does the opposite, and it does it fast, because positioning into this week is already leaning on the hawkish reading of 16 September. The work is to know which node breaks first.
The live economic calendar, the TradingView boards, and the broker links sit on the Live Trading News trading page. Times slip. Consensus gets revised. The page is the source of truth for the session. This note is the map of what depends on what. Open it before London, and again before the New York cash open on Wednesday and Friday.
One rule on language. Stops in this note are reference levels where a stated thesis stops being the working hypothesis. They are not orders. They are not a solicitation. Size, slippage and the gap through a payroll number are the trader's problem, not the column's.
The week, in one transmission
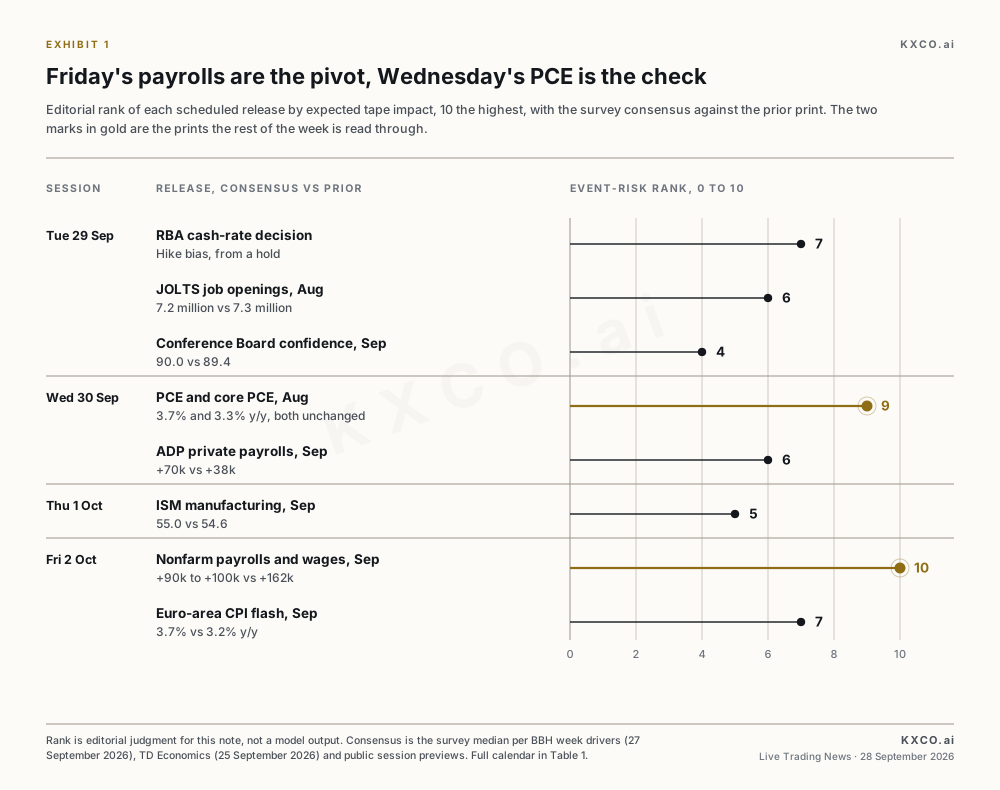
Exhibit 1. Event-risk rank for the week of 28 September. Friday's employment report is the pivot. Wednesday's PCE is the inflation check the Fed actually uses. Rank is editorial, not a model output.
The transmission runs in a fixed order, and it is worth writing down so the week does not feel like a sequence of surprises. A US data surprise hits the front end of the Treasury curve first. The two-year is the cleanest expression of October hike odds. The dollar index follows the two-year, with a lag measured in minutes on a payroll Friday and in hours on a PCE Wednesday. Gold is the inverse of the real rate plus the dollar, unless a geopolitical headline overrides it. This week the geopolitical override is oil and the Middle East, not a new sanction cycle. Bitcoin has been trading the liquidity and dollar leg, not the gold leg. The AI complex splits. Infrastructure beneficiaries (memory, accelerators, networking silicon) have been paid for scarcity. The hyperscalers writing the cheques have been marked down for the cheques. A higher discount rate hurts both, but it hurts the multiple-compression cohort first and the scarcity cohort only if the capex narrative itself is questioned. Quantum sits further out on the duration curve. It is a specification-and-deadline trade until revenue is large enough to be a stop.
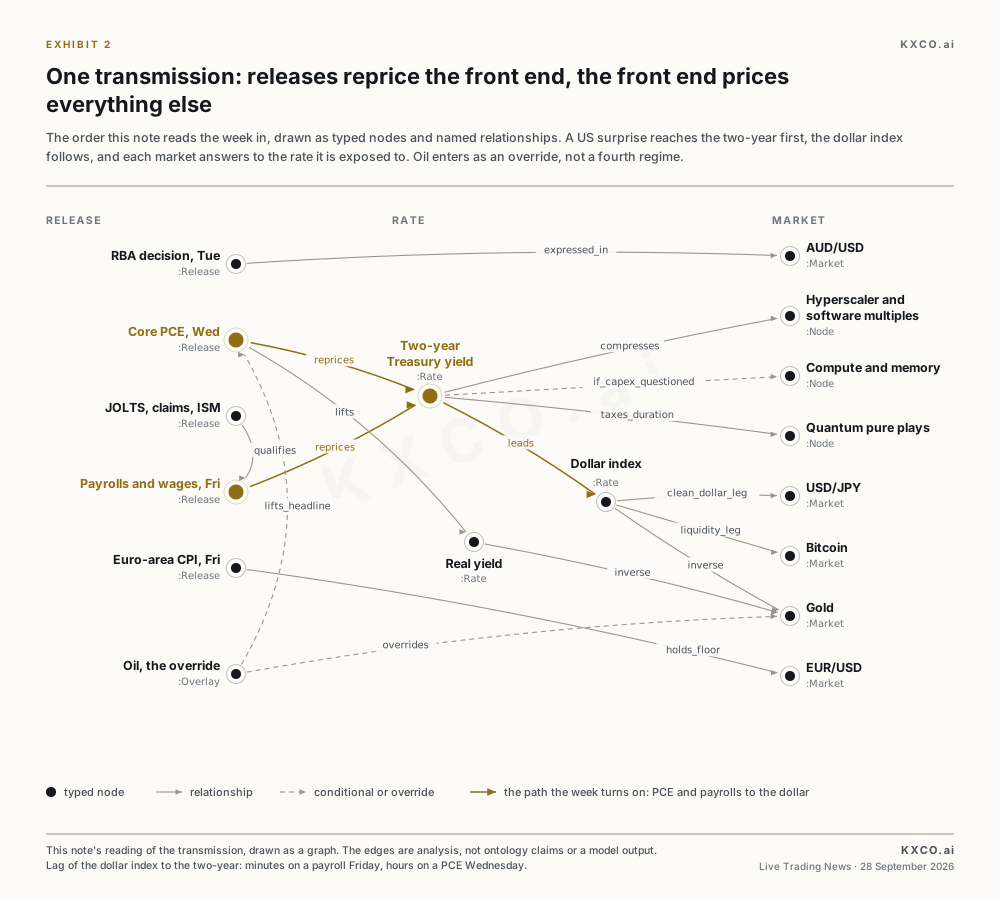
Exhibit 2. The week's transmission as a knowledge graph: each release, the rate it reprices, and the markets that answer to that rate. Oil enters as an override, not a fourth regime. The edges are this note's reading of the order, not a model output.
That is the map. The rest of the note fills it in, day by day, then by market.
Economic calendar: what is actually on the tape
Confirm exact times on the Live Trading News trading page. The schedule below is the working set as of Monday morning in Asia, 28 September 2026. Eastern Time. Consensus figures are survey medians compiled from the public desks (BBH, TD Economics, Investopedia, Vanderbilt Report) and will move.
When (ET) | Release | Consensus | Prior | Why it matters |
|---|---|---|---|---|
Mon 28 Sep | Dallas Fed manufacturing, Sep; Bowman and Barr | n/a | n/a | Tone, not the number. Housing and supervision remarks. |
Tue 29 Sep, policy | RBA cash-rate decision | Hike bias | Hold | First clean non-US rate test. AUD is the expression. |
Tue 29 Sep, 10:00 | JOLTS job openings, Aug | 7.2 million | 7.3 million | Labor demand. A drop under 7.0 changes the Friday setup. |
Tue 29 Sep, 10:00 | Conference Board confidence, Sep | 90.0 | 89.4 | Soft. Matters if it breaks, not if it prints 90. |
Wed 30 Sep, 8:15 | ADP private payrolls, Sep | +70k | +38k | Noisy leading indicator into Friday. Do not overfit it. |
Wed 30 Sep, 8:30 | PCE price index, Aug, y/y | 3.7% | 3.7% | Fed's preferred inflation gauge. Sticky is the base case. |
Wed 30 Sep, 8:30 | Core PCE, Aug, y/y | 3.3% | 3.3% | Third month at 3.3% if consensus holds. That is not 2%. |
Wed 30 Sep, 8:30 | Personal income / spending, Aug | 0.5% / firm | 0.4% / 0.0% real | Demand check alongside the deflator. |
Wed 30 Sep, 8:30 | Q2 GDP, third estimate | n/a | prior est. | Revision risk. Second order unless the surprise is large. |
Thu 1 Oct, 8:30 | Initial jobless claims | n/a | 197k | Weekly labor. A jump would qualify Friday. |
Thu 1 Oct, 10:00 | ISM manufacturing, Sep | 55.0 | 54.6 | Expansion. Watch new orders and prices paid. |
Fri 2 Oct, 8:30 | Nonfarm payrolls, Sep | +90k to +100k | +162k | The week's pivot. Unemployment seen at 4.1%. |
Fri 2 Oct, 8:30 | Average hourly earnings, Sep | 0.3% m/m | 0.3% | Wage impulse. A 0.5% print is a hawkish shock. |
Fri 2 Oct | Eurozone CPI, Sep flash | 3.7% y/y | 3.2% | Energy. Core seen 2.5% from 2.4%. ECB hike case. |
Table 1. Working calendar, week of 28 September 2026. Consensus is a survey median, not a forecast from this desk. Source set: agency calendars, BBH week drivers (27 September), TD Economics upcoming table (25 September), public session previews.
Monday: observation, not invention
Monday is a positioning day. The Dallas Fed manufacturing survey is a regional print. It will not reset October odds. What it can do is confirm or contradict the ISM prices-paid story that arrives Thursday. Fed speakers are the other Monday input. Vice Chair for Supervision Michelle Bowman is scheduled on bank supervision. Governor Michael Barr is scheduled on the outlook and housing. Neither is the Chair. Treat a hawkish aside as color, and do not rebuild the book around it. The useful Monday work is mechanical: where did gold open in Asia relative to the $4,285 close of 25 September 2026, where is Bitcoin relative to the $83,000–$84,000 band, and is the dollar index still sitting on 101. Exhibit 4 and Exhibit 5 draw those levels.
Earnings are light. The names that matter later in the week are Micron, Nike and Accenture, with Carnival and CarMax earlier. Micron is the one that belongs on an AI desk. Memory has been the scarcity expression inside the infrastructure trade. A guide that confirms tight supply supports the node. A guide that talks about digestion supports the multiple-compression camp. It is not a macro print, but it is the cleanest company-level check on whether the capex is still being absorbed.
Tuesday: the RBA, openings, and confidence
Tuesday is the first real policy event, and it is not American. The Reserve Bank of Australia is the central bank the street has marked as ready to resume tightening. If it hikes and the statement keeps a further-move bias, AUD/USD is the expression, and the cross should be read against the dollar index rather than in isolation. A hike that is wrapped in a one-and-done paragraph is a different trade: the knee-jerk rally in the Aussie fades, and the dollar leg reasserts into Wednesday. A hold, against a hike-leaning setup, is the surprise. That surprise hits AUD first and then, because it reads as a global-easing crack in a week priced for sticky inflation, it can leak into gold and the front end. Do not fade the first thirty minutes. Read the statement.
US data on Tuesday is labor-demand and household mood. August JOLTS openings are seen at 7.2 million against 7.3 million. The level still says an economy near full employment, which is how the Federal Open Market Committee described 4.1 percent unemployment in its 2026 projection. The trade is the deviation. A print under 7.0 million, with quits falling, is the first soft tell of the week and it will be used to fade Friday's consensus. A print that holds or rises says the August payroll gain of 162,000, per the Bureau of Labor Statistics, was not a one-off, and it steepens the hawkish path into PCE. Conference Board consumer confidence is seen at 90.0 against 89.4. That is a flat forecast. It matters if the expectations component breaks, because expectations lead spending, and spending is the other half of Wednesday's personal-income report. Case-Shiller for July is a lagging housing print. Barr is on housing this week. The index will be cited. It will not lead.
Wednesday: the inflation print the Fed uses
Wednesday is the inflation day. August PCE is expected, per the survey medians in Table 1, to rise 0.4 percent on the month, leaving the year-on-year rate unchanged at 3.7 percent. Core PCE is expected at 0.3 percent on the month and 3.3 percent on the year, a third straight month at 3.3 percent if the consensus is right. Personal income is seen at 0.5 percent. Real spending is expected to rebound after a flat July. The third estimate of second-quarter GDP prints in the same window. ADP private payrolls, seen at plus 70,000 against plus 38,000, arrive fifteen minutes earlier, at 8:15 on 30 September 2026, and will be over-traded. ADP is not the Bureau of Labor Statistics. Use it as a volatility event, not as Friday's answer.
The market path on a PCE surprise is standard and worth stating so it is not rediscovered at 8:31. A core month-on-month of 0.4 percent or higher, or a year-on-year that lifts off 3.3 percent, reprices the October meeting toward another quarter point, lifts the two-year, lifts the dollar index through the 101.30 area it has already tested, and pressures gold and the long-duration AI multiples in the same hour. A core print of 0.2 percent, with the year-on-year slipping, does the reverse: the hawkish bias from 16 September loses its data hook, the dollar gives back the post-hike bid, and gold gets a real-rate bid that does not need a war headline. Spending matters as the cross-check. Hot inflation with firm real spending is the clean hawkish combination. Hot inflation with collapsing spending is stagflation chatter, and it is a worse mix for equities than for gold.
Fiscal noise sits under Wednesday. It is the last day of the federal fiscal year 2026. A funding headline can move the long bond independently of PCE. If it does, separate it. A fiscal spike in yields with a soft PCE is not the same trade as a Fed spike in yields with a hot PCE. Gold cares which one it is. The front end tells you.
Thursday: claims, ISM, and the new fiscal year
Thursday opens the 2027 fiscal year. Initial claims were 197,000 as of the last weekly report, per the Labor Department. They are the weekly labor check. A claims print that jumps through 220,000 would qualify Friday's payroll consensus to the downside before the number exists. A claims print that stays in the high 180s says the labor market the FOMC called near full employment is still that market. ISM manufacturing for September is seen at 55.0 against 54.6. That is expansion, and it is the kind of expansion that does not rescue the Fed's inflation problem. The sub-indices do the work. Prices paid rising while new orders fade is the uncomfortable mix. New orders firm and prices paid easing is the mix that lets equities breathe into Friday. S&P Global's manufacturing PMI is the earlier private read. Do not let it substitute for ISM, but do not ignore a wide gap between the two.
Friday: payrolls, wages, and Europe's inflation
Friday is the week. September nonfarm payrolls are expected, per the survey medians in Table 1, between plus 90,000 and plus 100,000, against plus 162,000 in August. The unemployment rate is expected to hold at 4.1 percent for a third month, in line with the FOMC's 2026 projection. Average hourly earnings are expected at 0.3 percent on the month, unchanged. The range around the payroll consensus is the trade. A print north of 160,000, with unemployment at 4.1 percent and wages at 0.4 percent or higher, is the hawkish trifecta. It firms the case for another increase before year-end, and it does it with the Fed's own labor mandate looking intact. A print under 50,000, or a rise in unemployment to 4.3 percent, reopens the argument that 16 September was the hike that data will not support. Between those poles, on a 70,000 to 120,000 print with wages behaved, the market will call it in-line and go back to the path it already discounted. In-line is not dull. It leaves the October meeting live, which is a tax on duration.
Euro-area flash CPI for September lands the same day. Headline is forecast at 3.7 percent year on year against 3.2 percent in August, on energy. Core is seen at 2.5 percent against 2.4 percent. Above-target inflation and a firmer growth tone are the combination the European Central Bank's hawks have been waiting to cite. For FX that means the euro is not a simple funding short against a strong dollar this week. A hot US payroll and a hot euro CPI can lift both the dollar index and EUR/USD's floor, and the cross can chop while USD/JPY does the clean dollar work. Read the euro against the yen and the pound, not only against the dollar, if both inflation prints surprise the same way.
China's September PMIs and Japan's third-quarter Tankan sit in the same global week. China's set is expected to stay consistent with a soft growth path. That is a cap on the reflation bid in metals and on the Australian dollar's commodity leg, which is why an RBA hike should be traded as a rates story first. The Tankan is a Bank of Japan input. USD/JPY at 157–158 already says the market does not believe intervention talk without a policy change under it. A strong Tankan keeps that disbelief intact.
How the calendar hits the book
Three regimes cover the week. They are not predictions. They are the paths the book should already have written down.
Regime one: sticky inflation, acceptable labor. Per the Table 1 consensus, core PCE holds 3.3 percent, payrolls land between 80,000 and 140,000, unemployment stays at 4.1 percent, wages print 0.3 percent. The October meeting stays live. The dollar index holds 100.80–101.80. Gold fails to reclaim $4,400 and trades the real-rate range. Bitcoin chops the $80,000–$87,000 band. AI multiples do not re-rate; infrastructure names hold if Micron's guide is clean; hyperscaler capex anxiety does not get a new excuse and does not get relief. This is the base case embedded in the consensus.
Regime two: the hawkish shock. Core PCE 0.4 percent on the month, or payrolls back near the August print of 162,000 per Table 1 with wages firm. Two-year yields gap, DXY pushes the June high area near 101.80, gold loses $4,200 at the daily close, Bitcoin loses $80,000, and the long-duration end of the AI complex (application software and the quantum pure plays) takes the first hit. Memory and accelerators hold up longer, until the market asks whether a higher funds rate changes the 2027 capex number. It usually asks that question a session late.
Regime three: the data hook breaks. Payrolls under 50,000 or unemployment up, with core PCE 0.2 percent. The 16 September hike starts to look like the move the next payroll will argue with. Dollar gives back the month's 1.7 percent gain. Gold reclaims the post-hike range toward $4,380–$4,400, the shelf drawn in Exhibit 4. Bitcoin trades the liquidity bid toward the 21 September spike. The AI complex splits the other way: multiples expand first in the names that were punished for spending, and the scarcity premium in memory stops being the only winning node.
Oil is the overlay, not a fourth regime. A conflict in its seventh month is already in the gold and the inflation prints. A fresh supply shock lifts headline PCE expectations for the next month and supports gold even in regime two, until real rates overpower it. Do not mix an oil spike with a payroll spike and call both "risk off." One is inflationary. One is a growth question. They hedge each other badly.
Foreign exchange
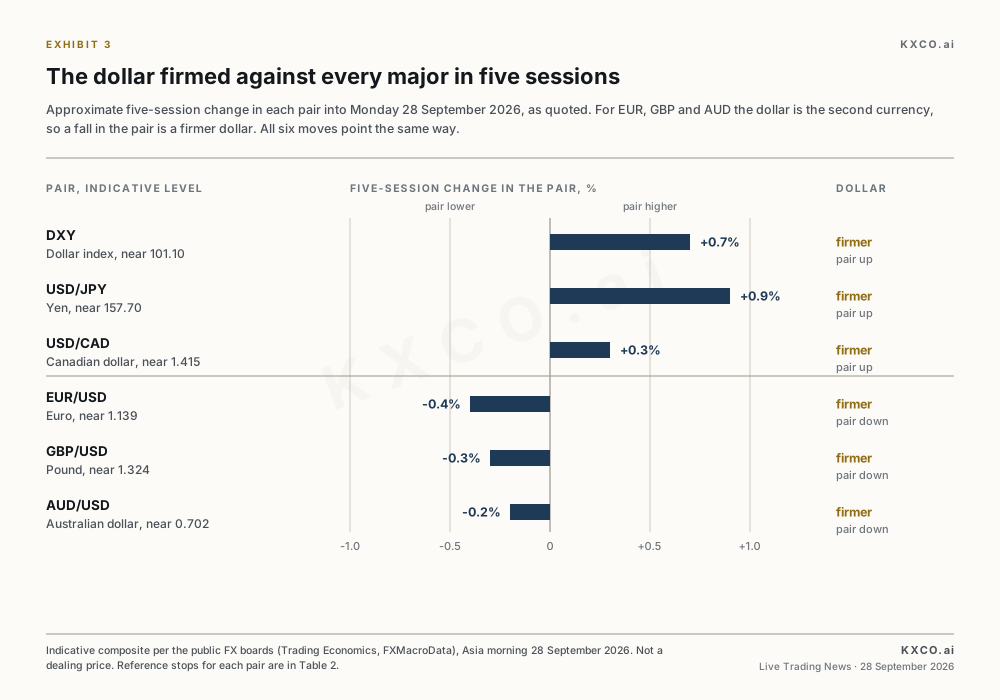
Exhibit 3. Five-session dollar bias into Monday 28 September, with the indicative level for each pair. Indicative, from public FX boards. Not a dealing price.
The dollar index opened the week near 101.10, up about 1.7 percent on the month and a little over 3 percent on the year. The 52-week range on the boards runs roughly 95.50 to 101.80, so the index is sitting under its high, not through it. That is a loaded position. A hawkish Friday does not need to invent a trend. It needs to clear a high the market has already seen. A soft Friday does not need to invent a collapse. It needs to put 100.20, the area that held mid-September before the post-hike grind, back in play.
Pair | Indicative | Week frame | Reference stop | What invalidates |
|---|---|---|---|---|
DXY | 101.10 | Under 101.80 high | 100.20 / 101.80 | Close through either side after Friday. |
EUR/USD | 1.139 | Heavy, not broken | 1.128 / 1.150 | Hot EZ CPI can hold the floor even if DXY firms. |
GBP/USD | 1.324 | Following the euro | 1.312 / 1.338 | UK data is second order this week. |
USD/JPY | 157.70 | Yield differential | 156.00 / 159.50 | Only a BOJ shift or intervention with policy under it. |
AUD/USD | 0.702 | RBA Tuesday | 0.692 / 0.712 | Hike-and-hawkish holds 0.70. A hold loses it. |
USD/CAD | 1.415 | Oil and dollar | 1.400 / 1.428 | Oil spike and a soft USD fight each other. |
USD/CHF | 0.829 | Low-yield dollar | 0.820 / 0.840 | Follows DXY unless SNB language changes. |
Table 2. Major FX reference levels, Asia morning 28 September 2026. Indicative composite from public boards (Trading Economics, FXMacroData). Stops are thesis levels, not orders.
EUR/USD near 1.139 is the pair that will confuse people on Friday. A strong US payroll is dollar-positive. A 3.7 percent euro-area CPI print is euro-positive at the margin, because it keeps the ECB in a hiking conversation. The net can be a choppy euro and a clean move in the dollar against the yen. GBP/USD near 1.324 has no domestic catalyst of equal rank this week. It will follow the euro with a lag and a wider spread. Trading the pound as a view on Britain, on a payroll Friday, is how accounts donate.
USD/JPY near 157.7 is the cleanest dollar expression on the board, and it is also the pair with the longest history of official discomfort. Intervention without a Bank of Japan shift has faded inside a week all year. The Tankan is the local input. A firm survey keeps the yield gap in charge. The reference band is 156 to 159.50. A payroll-driven spike through 159 that is not met with yen-buying inside the Tokyo morning is a market that has stopped believing the verbal line. A dip through 156 on a soft payroll is the first place dollar longs will defend.
AUD/USD near 0.702 is Tuesday's pair. The commodity leg is capped by a China PMI set that is not about to describe a boom. So the Aussie this week is a rates pair wearing a commodity mask. A hike with a further-move bias holds 0.70 and can test 0.712. A hold, or a hike dressed as the last one, loses 0.70 and puts 0.692 in play before New York has had breakfast. Do not carry an Aussie view through the statement unread.
USD/CAD near 1.415 mixes the dollar with oil. A Middle East headline that lifts crude and a payroll headline that lifts the dollar push the pair in opposite directions. If both hit on Friday, stand aside until one of them dominates the hour. USD/CHF near 0.829 is a low-beta dollar. It is useful as a check, not as the trade.
The practical FX stop for the week is not a price. It is a sequence. If Tuesday's RBA, Wednesday's core PCE and Friday's payrolls all print on the hawkish side of consensus, the dollar long is the position and the stop is a close back under 100.50. If two of the three print soft, the dollar long from the post-hike grind is the position that is wrong, and adding to it because the third print might save it is how the week is lost. One soft print is noise. Two is the regime.
Gold
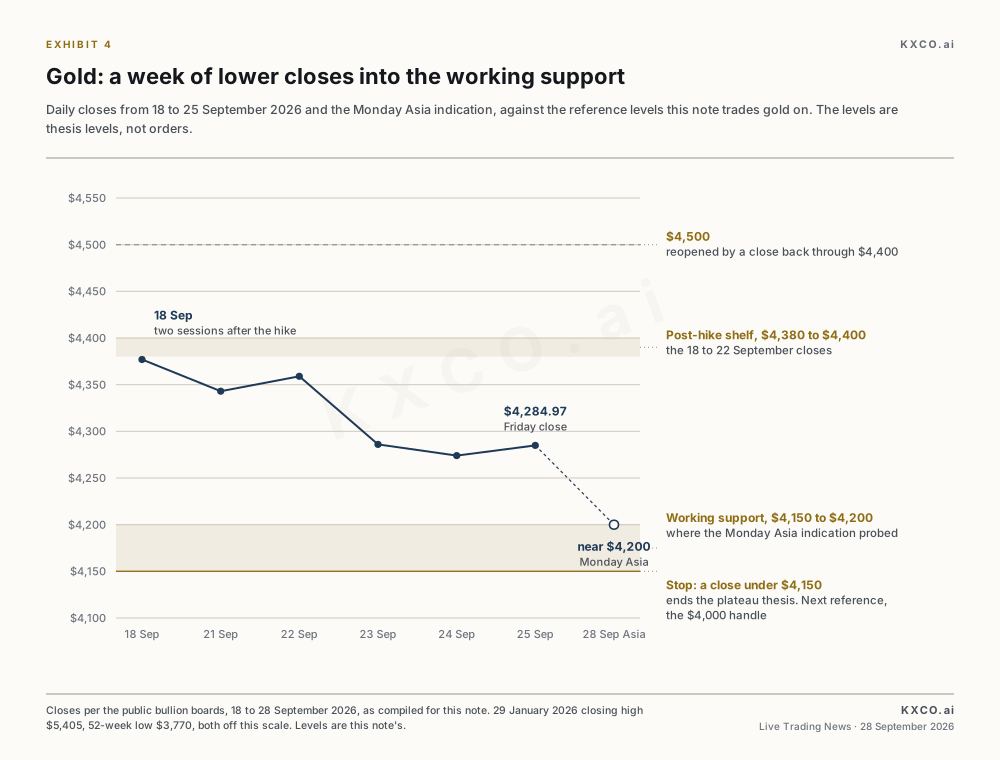
Exhibit 4. Gold daily closes, 18 to 25 September, against the reference levels in this note. Friday close, 25 September 2026: $4,284.97. 29 January 2026 closing high $5,405. Sources: public bullion boards, 25 to 28 September 2026.
Gold closed on Friday 25 September 2026 at $4,284.97 a troy ounce, per the public bullion boards, up a quarter of a percent on the day and down a little over 2 percent on the week. The Monday Asia indication sat nearer $4,200, a gap that says the Sunday market marked the dollar and the real rate, not a new supply story. The metal is about 1.9 percent lower in 2026 and about 21 percent under the 29 January 2026 closing high of $5,405. The 52-week range runs roughly $3,770 to $5,405. Silver closed the week near $64 and was indicated nearer $62 as of Monday, with the gold-silver ratio around 66.6 at Friday's close. Platinum and palladium remain well under their 2026 highs. This is gold holding a high plateau while the complex leaks. A broad precious-metals boom would look different.
The fundamental set is simple, and it has not changed because the price is still above $4,000 as of this morning. Gold is long real rates in reverse, long the geopolitical premium, and short the dollar. The geopolitical premium is already in the price: a war in its seventh month, an oil market that has not gone back to the pre-conflict range, and a Federal Reserve that hiked anyway. That last point is the one to sit with. The Fed raised rates on 16 September with gold still above $4,300, per the closes in Exhibit 4. The metal's inability to push back toward $4,500 after that hike tells you the marginal buyer is tactical, not structural. Central-bank demand is the structural bid underneath. It is slow. It does not defend a Friday-to-Monday gap.
Levels, as drawn in Exhibit 4. The working support is $4,150 to $4,200, which is where Monday's Asia indication already probed. A break of $4,150 at the daily close after a hot PCE or a hot payroll is the stop on the "plateau holds" thesis, and the next reference is the $4,000 handle, then the $3,770 52-week low, which should not be in play unless the dollar clears 101.80 and real yields reprice a second hike as the base case rather than the risk case. On the top side, $4,380–$4,400 is the post-hike shelf from 18–22 September. A move back through $4,400 at the daily close, on a soft payroll or a genuine oil shock, reopens $4,500. The January high at $5,405 is not a target for this week. Citing it as one is how notes waste the reader's time.
Silver is the beta, not the signal. A 4 percent down day into the weekend, against gold's smaller move, is the ratio doing what it does when the dollar firms: silver gives back more. A gold trade hedged with short silver is a volatility trade. It is not a view on the monetary premium. Leave it unless the book is built for the spread.
The calendar link to gold is Wednesday first, Friday second. PCE is the real-rate print. Payrolls are the growth-and-wages print that tells you whether the real-rate move extends. Oil is the override. If crude spikes on a supply headline the same morning as a hot core PCE, gold can rise with yields for an hour and then follow real rates. Wait for the hour. The first print is not the close.
Bitcoin
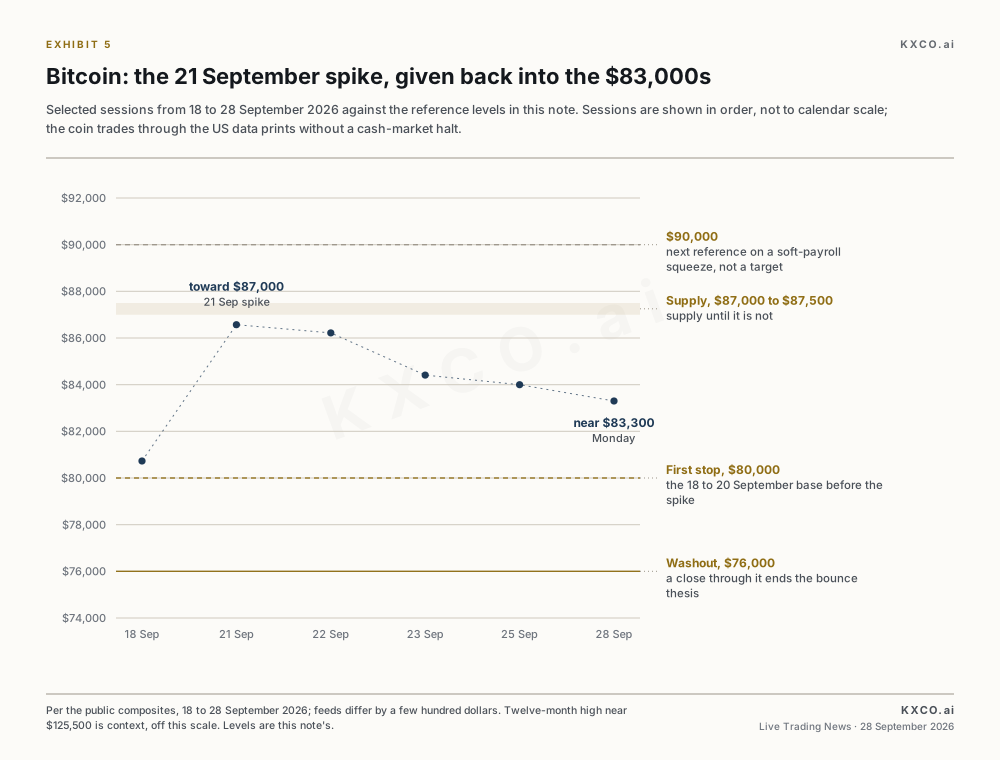
Exhibit 5. Bitcoin, selected sessions from 18 to 28 September 2026, against the reference levels in this note. Spike toward $87,000 on 21 September, give-back into the $83,000s by Monday. Public composite; feeds differ by a few hundred dollars.
Bitcoin traded near $83,300 on Monday 28 September 2026, per the public composites, down about 1.5 percent from the Sunday mark, after a Friday close in the $84,000 area. The 21 September session spiked toward $87,000 and, on some feeds, tagged the high $86,000s to low $87,000s. That spike has been given back. On a twelve-month view the high sits near $125,500 and the low, on at least one retail board, is an artifact that should not be used. The relevant trading range for this note, as of this week, is the September range, roughly $75,000 to $87,500. Month-on-month the coin is higher. Week-on-week it is not. Treat the level, not the narrative.
Bitcoin is not gold this month. Gold leaked with the dollar bid. Bitcoin spiked on 21 September and mean-reverted. The correlation the desk should actually trade is Bitcoin against the dollar and against Nasdaq liquidity, not against the bullion fix. A hawkish payroll that lifts DXY through 101.80 and hits long-duration tech is a Bitcoin-negative print even if gold is only down one percent. A soft payroll that drops the dollar and reopens multiple expansion is a Bitcoin-positive print even if gold's move is larger. The mistake is to hedge one with the other and call it a pair trade. They share a liquidity factor. They do not share a buyer.
Reference levels, as drawn in Exhibit 5. The round number at $80,000 is the first stop on the post-21 September bounce. It is not magic. It is where the 18–20 September base sat before the spike, and it is where systematic bids have a habit of clustering until they do not. Under that, $76,000 is the mid-September washout area, and a break through it at the daily close ends the bounce thesis. On the top side, $87,000–$87,500 is supply until it is not. A payroll-Friday squeeze through that band, on a soft number, puts $90,000 in play as the next reference, not as a target with a date on it. The twelve-month high near $125,000 is context. It is not a stop and it is not a forecast.
Positioning into a payroll week in Bitcoin is a gap problem. The coin trades through the US data prints without a cash-market halt. A 3 percent move in ten minutes is ordinary. The stop that sits 1 percent under the entry is not a stop. It is a donation. If the thesis is "soft payroll, liquidity bid," the invalidation is a hot payroll and a DXY close over 101.50, not a wick. If the thesis is "hawkish week, $80,000 breaks" (the first stop in Exhibit 5), the invalidation is a core PCE of 0.2 percent that the dollar fails to rally on. Write the invalidation in the other market. Bitcoin will tell you late.
Microstructure is not the story of this note, but one point belongs. Exchange prints differed by several hundred dollars across the public boards on Sunday night. That is normal. It is also why a stop entered on a single retail feed, without a reference to the index print, gets tagged by a feed gap that the aggregate never traded. Use a composite. The Live Trading News trading page carries the live boards.
AI stocks, read through KXCO Ontology Live
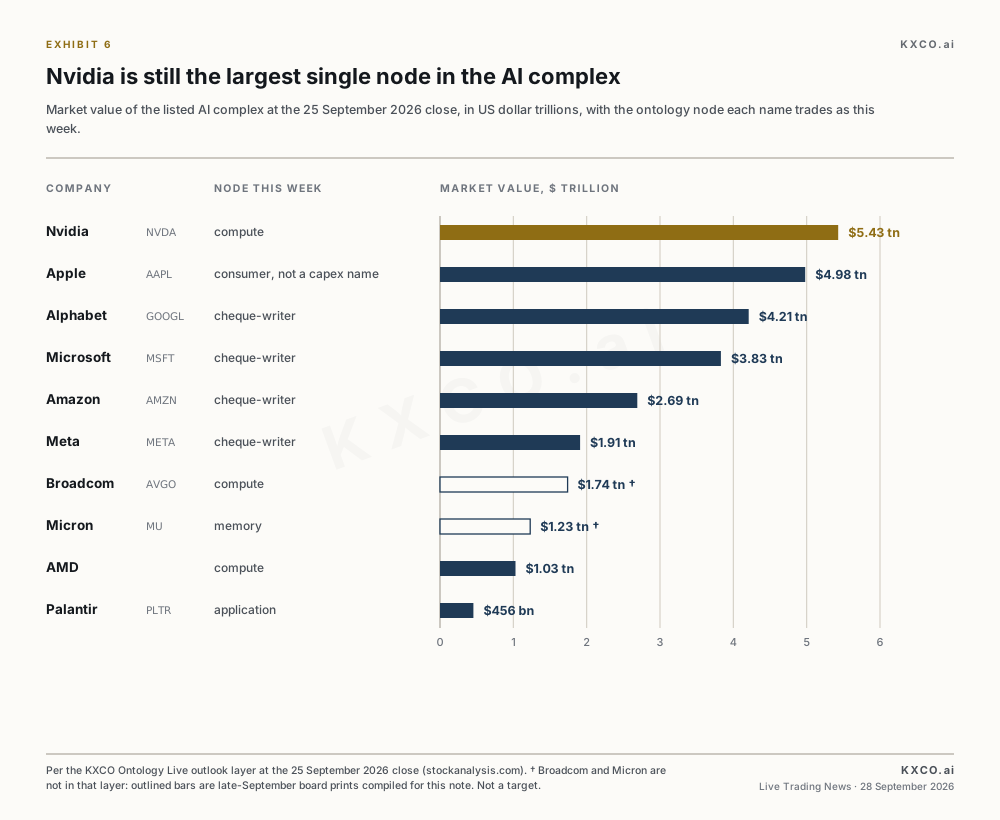
Exhibit 6. Indicative market value of the AI complex, late September 2026, USD trillions. Nvidia remains the largest single node. Market values as of the 25 September 2026 close, per the KXCO Ontology Live outlook layer. Broadcom and Micron from late-September board prints. Not a target.
The AI complex is not a factor. It is a set of nodes that share a capex cycle and a discount rate, and that diverge the moment either one is questioned. KXCO Ontology Live is the map this desk uses to keep those nodes apart: entities, claims, and the analyst-outlook layer, updated as the record corrects itself in the open. The scorecard published this weekend put the live graph at 395 entities, 892 claims and 47 findings, up from a 31-entity seed, with nine of thirteen names on the first outlook table higher since 17 July. That is a record of the map. It is not a buy list. The use of the map this week is narrower. Which nodes are exposed to the discount rate, which are exposed to a capex digestion story, and which are exposed to a quantum specification that has nothing to do with Wednesday's deflator.
Four nodes cover the listed complex for a macro week.
Compute and memory. Nvidia, indicated near $225 to $228 and a market value around $5.4 to $5.5 trillion, remains the toll booth on training accelerators. AMD near $625 and a trillion-dollar value is the second source. Broadcom near $365 is the custom-silicon and networking toll. Micron, near $1,100 as of the latest session after adding about 5 percent on the public boards, is the memory scarcity expression, and it reports this week. These names have been paid for being on the receiving end of the cheque. A higher discount rate compresses the multiple. It does not, by itself, cancel the order book. The stop on the compute node is not a PCE print. The stop is a hyperscaler cutting the 2027 capex number, or a Micron guide that says the shortage is over. Neither is the base case for Wednesday. Both are the question the market will ask if Friday is hawkish and yields gap.
The hyperscaler cheque-writers. Microsoft near $516, Alphabet near $345 to $350, Amazon near $250, Meta near $740 to $750, Oracle near $137, per the 25 September closes. This is the node the market has been marking down even where earnings have held, because the capex is absorbing cash flow and the return on it is still a claim rather than a reported line. Ontology Live keeps the claim separate from the revenue. That separation is the point. A sticky PCE print hurts this node through the multiple, and it hurts it more than it hurts Micron, because the market is already arguing about the spend. A soft payroll does the opposite: the multiple compression pauses, and the node that was punished for writing cheques outperforms the node that was paid for receiving them, for a session or two. Oracle remains the widest gap on the outlook layer between contracted backlog and market value. That gap is a claim. It is not a floor.
Application and distribution. Palantir near $190, Salesforce, CrowdStrike, and the software layer that sells the workflow rather than the watt. These are longer duration than the silicon. They move with the two-year yield on a payroll Friday and with contract commentary on their own calendar. Per the ontology's outlook layer, Palantir carries a Buy with about 3 percent left to its $196 consensus target, after the best run on the first outlook table, up 43 percent since 17 July. In practice it trades into this week as a neutral: the map has been right often enough to publish the record, and wrong often enough that the record includes the corrections. A name with that little room left to its target means the position is the calendar, not the ticker. Do not let a Friday yield spike turn a workflow multiple into a macro opinion.
Energy and the physical constraint. The capex cycle is a power cycle. Utilities, turbines, and the grid names sit on the ontology as the constraint node, not as an AI multiple. They do not share Nvidia's duration. A hawkish week that hits long-duration software can leave the power node alone, or bid it, if the market decides the constraint got tighter rather than the demand got postponed. Keep them off the same stop as the application layer.
Node | Names | Exposure this week | Thesis stop |
|---|---|---|---|
Compute / memory | NVDA, AMD, AVGO, MU | Multiple, then the order book | Capex cut or a Micron digestion guide. Not one PCE tenth. |
Cheque-writers | MSFT, GOOGL, AMZN, META, ORCL | Discount rate on spend | A second hike priced as base case, or a cut to the 2027 number. |
Application | PLTR, CRM, CRWD | Two-year yield | Friday yield gap. Own-calendar commentary overrides. |
Power constraint | Grid, turbines, utilities | Physical, not multiple | A demand postponement, not a hot print alone. |
Quantum adjacency | IONQ, RGTI, QBTS, IBM | Specification and deadline | Missed milestone, or a close under the August base. |
Table 3. AI complex by Ontology Live node, and the stop that actually belongs to each node. Prices in the text are 25 September closes and late-September board indications.
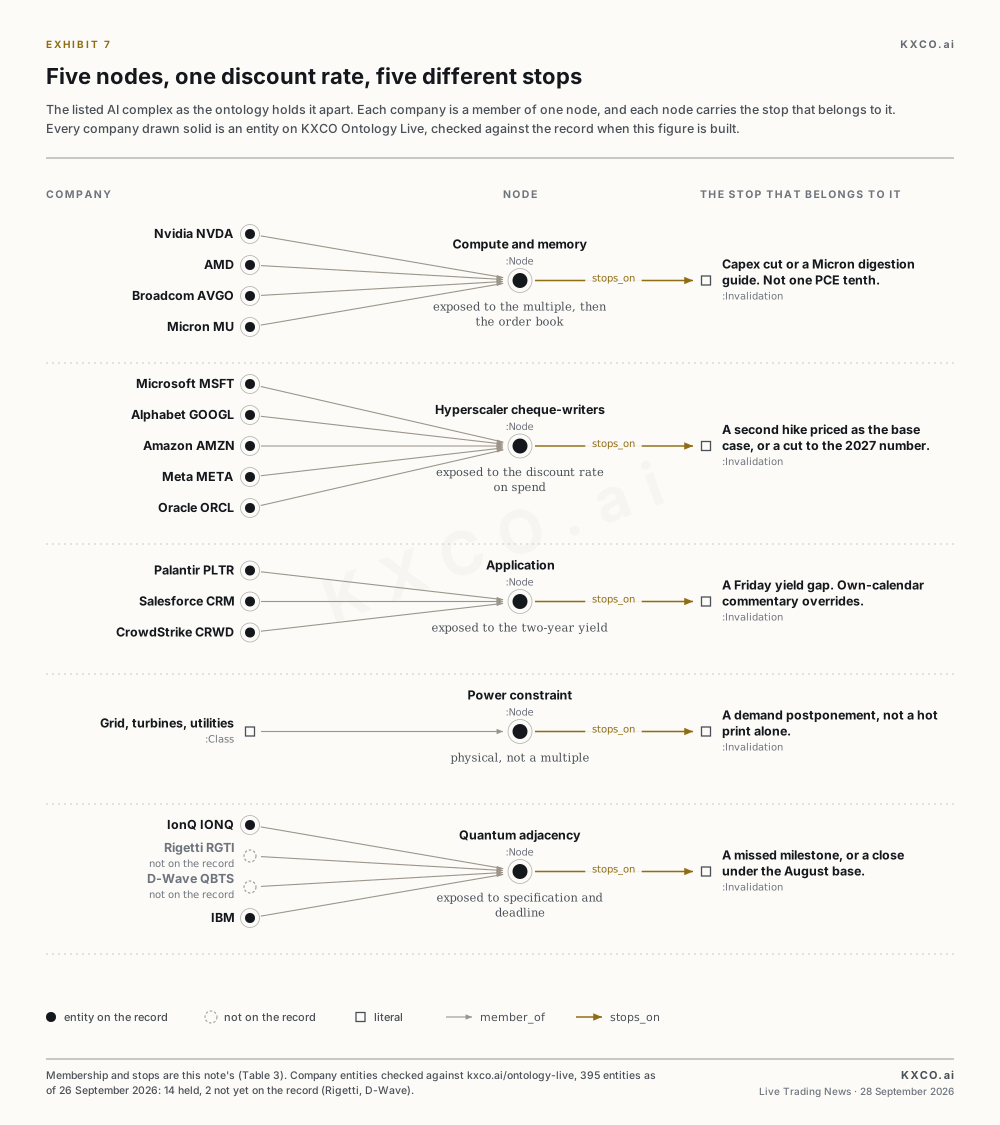
Exhibit 7. The AI complex as the ontology holds it apart: five nodes, the names in each, and the stop that belongs to each node. Every company drawn solid is an entity on KXCO Ontology Live, checked when the figure is built.
The round-number book on the large names, for readers who want a single page, per the 25 September closes and late-September board prints, is Nvidia $225–$228, Apple $340, Alphabet $345–$352, Microsoft $516, Amazon $250, Meta $740–$752, Broadcom $365, Micron near $1,100, AMD $623–$631, Palantir $190. Market values run from Nvidia at about $5.5 trillion to Palantir near $455 billion. Apple is on the AI scoreboards and is not an AI capex name. It is a multiple and a consumer name, and it should not be stopped with Micron. Tesla near $370–$380 is a retail-flow name with an autonomy claim. It is on the ontology. It is not a Wednesday PCE vehicle.
What Ontology Live changes about the read, practically, is the refusal to let a single headline update every node at once. A Micron guide is a memory-node update. A payroll number is a discount-rate update. A quantum executive-order anniversary is a specification update. Publishing them as one "AI quantum" tape is how the week gets mis-traded. The live graph is there so the claim can be checked against the last time that claim was scored. The AI Stocks Center carries the running record.
Quantum, the specification, and the stops
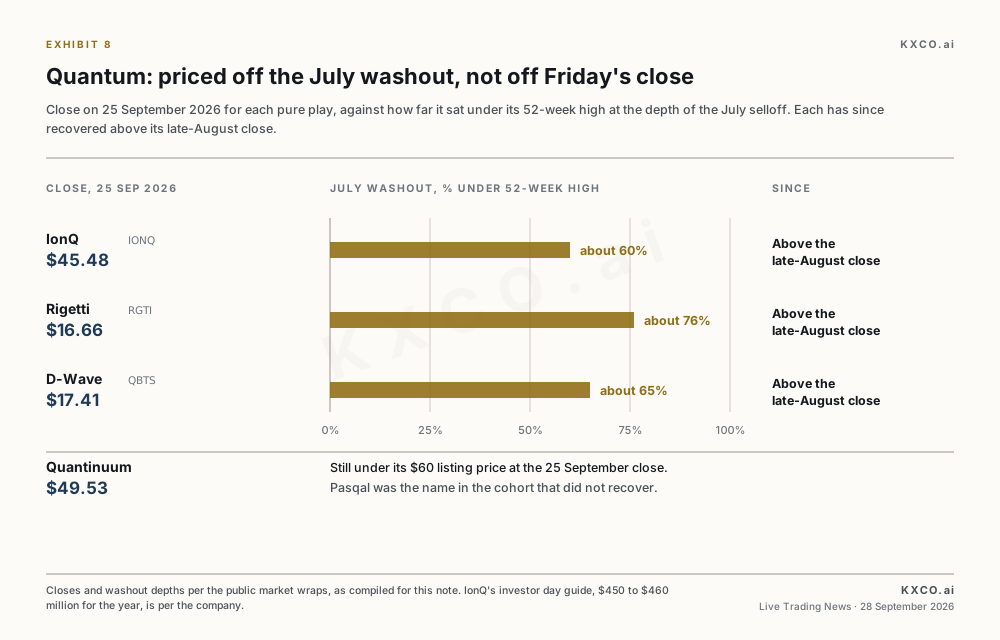
Exhibit 8. Quantum pure-play closes, 25 September 2026, against the depth of the July washout. IonQ $45.48, Rigetti $16.66, D-Wave $17.41. Quantinuum $49.53, still under its $60 listing. Sources: public market wraps.
The quantum cohort is a specification-and-deadline trade sitting next to an AI capex cycle, and the two get bundled because the headlines share a word. They should not share a stop. In June the administration signed orders aiming at a scientifically relevant quantum computer by 2028 and a faster federal migration to post-quantum cryptography. That is a clock. Clocks move stocks that do not yet have the revenue to defend a multiple. They also expire. IBM has 2029 on Starling, its planned fault-tolerant system, and published quantum-advantage claims in late July that remain open to classical challenge. IonQ's investor day in early September lifted full-year revenue guidance, per the company, into the $450–$460 million range with SkyWater included, after a second-quarter print of $80.1 million. That is real revenue. It is not a $45 stock's entire argument.
The July washout is the reference that matters more than Friday's close. At the depth of that selloff IonQ was about 60 percent under its 52-week high, Rigetti about 76 percent under, D-Wave about 65 percent under. By the close on 25 September 2026, per the public market wraps, the recovery had IonQ at $45.48, Rigetti at $16.66 and D-Wave at $17.41, each above the late-August close. Quantinuum at $49.53 as of the same close was still under its $60 listing price. Pasqal was the name that did not recover. The cohort does not trade as one thing once the headline is over. It trades as one thing when a new headline arrives. This week's macro prints are a headline of that second kind: they do not change a qubit error rate, and they change the multiple on a pre-revenue story immediately.
Stops, stated as invalidation rather than as a broker ticket. For IonQ the recovery thesis dies on a close back through the late-August base, not on a 4 percent payroll-Friday wick. The stock halved-and-worse in July without a qubit failing. It can do a smaller version of that on a discount-rate shock. For Rigetti and D-Wave the same rule holds, with wider bands, because the floats are smaller and the wicks are ruder. A stop 3 percent under the entry will be run on a Friday open. The structural stop is the August base. The tactical stop is the dollar: if DXY closes the week above 101.50 and the two-year has repriced a second hike, the quantum long is a position that needs a specification headline to survive, and this week's calendar does not contain one.
Post-quantum cryptography is the adjacent claim, and it is the one that does not need a fault-tolerant machine. Federal migration timelines pull security budgets forward whether or not IonQ hits a fidelity target. That demand sits with the security node, the names selling attestation, key migration and inventory, not with the pure-play hardware. Ontology Live keeps the two claims in different places on purpose. A trader who buys Rigetti as a PQC migration bet has bought the wrong node. A trader who buys a security compounder as a qubit bet has done the same thing in reverse. The stop for the PQC claim is a slipped federal timeline or a budget mark, not a gate-fidelity paper.
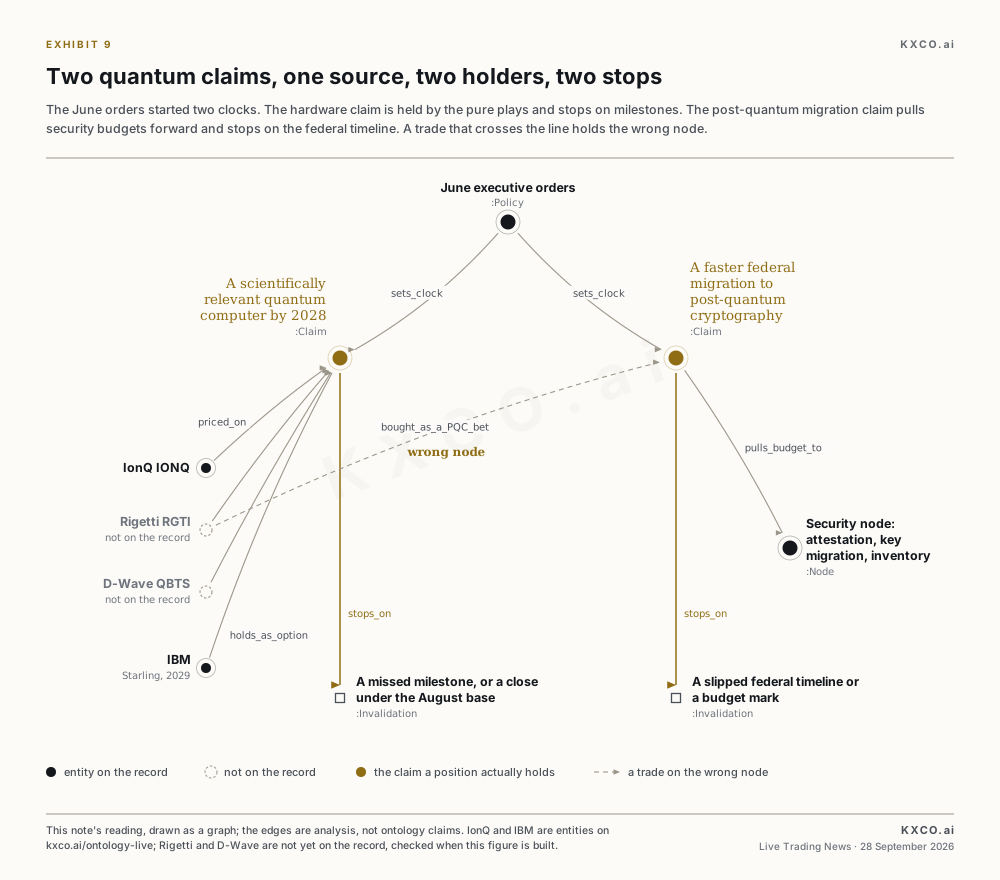
Exhibit 9. Two quantum claims, kept in two places. The hardware clock and the post-quantum migration came from the same June orders. They do not share a holder, an exposure or a stop.
IBM is the name that straddles. It has a quantum roadmap and a consulting and software multiple. It should be read on the roadmap milestones (advantage claims that survive challenge, the Starling clock) and stopped on those, not on the pure-play beta. When the pure plays halve and IBM does not, the market is telling you the roadmap is priced as an option inside a cash-flow business. That is the correct reading until a milestone misses.
Cross-asset playbook
The book for the week is a sequence, not a basket.
Before Tuesday, the only position that has a catalyst is the Australian dollar, and only into the statement. Flat is a position. A pre-statement Aussie long is a bet that the hike arrives with a further-move bias. The invalidation is the paragraph, not the rate.
Into Wednesday, reduce rather than add. PCE at 8:30 New York is a gap event for gold, for the dollar, and for the AI multiples. The working orders are the reference levels already stated in Table 2, Exhibit 4 and Exhibit 5: gold $4,150 on the downside and $4,400 on the reclaim; DXY 100.20 and 101.80; Bitcoin $80,000 and $87,000. If the core print is the consensus 0.3 percent and 3.3 percent, do nothing. Consensus confirmed is not a new trade.
Thursday is the qualifier. Claims and ISM prices-paid either license Friday's consensus per Table 1 or they chip it. A claims jump through 220,000 is the chip. An ISM prices-paid rise with firm new orders is the license.
Friday is the only day that earns a full-size reaction, and only after the wage line is out, not on the headline payroll alone. A 140,000 headline with 0.5 percent wages is hawkish. A 140,000 headline with 0.1 percent wages and unemployment at 4.2 percent is not. Read the three numbers against the consensus per Table 1. Then read euro-area CPI before deciding the dollar move is clean, because a hot European print keeps a bid under the euro that a dollar-only model will miss.
Across all three regimes the AI instruction is the same. Do not stop the complex as one ticker. Memory and accelerators stop on the order book. Hyperscalers stop on the discount rate and on any cut to the spend. Quantum stops on the August base and on the absence of a specification headline to offset a yield gap. Power stops on a demand postponement. Ontology Live is the ledger for which claim you actually hold.
What would change the map
Five developments change this note before Friday's close, and they are listed so the reader can throw the note out when one of them arrives. A payroll print outside 50,000 to 160,000, per the Friday poles above. A core PCE month-on-month outside 0.2 to 0.4 percent. An RBA decision that does not match the statement's bias. An oil move large enough to dominate the inflation read. A hyperscaler or Micron comment that cuts or freezes the capex path. Anything else (a Fed speaker aside, a regional survey, a social-media qubit claim) is noise until it shows up in one of those five.
The deeper point is the one the ontology is for. Markets this week will try to trade AI, quantum, gold and Bitcoin as a single risk mood. They are four books that share a discount rate and diverge everywhere else. The calendar says when the discount rate gets a vote. The stops say where each book is wrong. The trading page is where the vote gets counted.
Sources and the page to use
Source set: calendar structure from agency schedules and the public week-ahead notes dated 24–27 September 2026, including BBH, TD Economics, Investopedia and the Vanderbilt Report. Gold from public bullion closes: Friday 25 September 2026 $4,284.97, 29 January closing high $5,405, Monday Asia indications near $4,200. Bitcoin from public composites near $83,300 on Monday 28 September, with the 21 September spike toward $87,000. Dollar index near 101.10; EUR/USD 1.139; GBP/USD 1.324; USD/JPY 157.7; AUD/USD 0.702; USD/CAD 1.415. AI market values from late-September board snapshots and the KXCO Ontology Live outlook layer as of the 25 September 2026 close: Nvidia about $5.4 trillion, Apple about $5.0 trillion, Alphabet about $4.2 trillion, Microsoft about $3.8 trillion, Micron and AMD at or above a trillion. Quantum closes of 25 September: IonQ $45.48, Rigetti $16.66, D-Wave $17.41. Ontology counts from the Live Trading News Round Table scorecard of 27 September.
The economic calendar and the live boards are on the trading page: livetradingnews.com/trading. The AI complex record is at livetradingnews.com/center/ai-stocks. Both are the working links for this note.
Stocks mentioned: $NVDA (NASDAQ), $AMD (NASDAQ), $AVGO (NASDAQ), $MU (NASDAQ), $MSFT (NASDAQ), $GOOGL (NASDAQ), $AMZN (NASDAQ), $META (NASDAQ), $ORCL (NYSE), $PLTR (NASDAQ), $CRM (NYSE), $CRWD (NASDAQ), $AAPL (NASDAQ), $TSLA (NASDAQ), $IONQ (NYSE), $RGTI (NASDAQ), $QBTS (NYSE), $IBM (NYSE), $NKE (NYSE), $ACN (NYSE), $CCL (NYSE) and $KMX (NYSE).
Shayne Heffernan, Ph.D., is the founder of Live Trading News, the KnightsBridge Group, Knightsbridge Law and the KXCO.ai ecosystem spanning post-quantum cryptography, identity, attestation and enterprise ontology.
This note is market commentary. It is not investment advice, not a solicitation, and not a recommendation to buy or sell any security, token, currency or commodity. Levels are reference points for a stated thesis. Consensus figures move. Feeds differ. Past performance is not a guide to future results. Trading leveraged foreign exchange, contracts for difference and cryptocurrencies carries a high risk of loss.

The Round Table Scorecard: 87 Days of a Live Ontology
On 1 July 2026 KXCO put a Round Table ontology in public with 31 entities, 41 claims and no findings. It now holds 395 entities, 892 claims and 47 findings, with every correction kept rather than overwritten. This scorecard grades the record, how it corrects itself in the open, and the 9 of 13 names on its first outlook table that are higher since 17 July.

Wall Street Week Ahead: Rates, Oil, AI, Quantum, Defense, Metals and Bitcoin
The trading week opens after a Federal Reserve that chose to hike, a White House that chose not to strike Yemen, and an oil market still pricing a war now in its seventh month. The useful work this week is not a list of tickers. It is a map of what depends on what: the funds rate, the Magnificent Seven, a quantum cohort just handed a specification and a deadline, the missile primes selling into a restock, and gold, silver, crude and Bitcoin, all held against the live AI sector ontology.

Musk and Colossus: Inside the 1.29 Gigawatt Machine in Memphis
Elon Musk is sleeping in an Airstream beside a warehouse in Whitehaven with MACROHARD painted on the roof. The machine next to it is a two-state compute campus carrying about 1.29 gigawatts of IT load, roughly 670,000 accelerators and 48.7 billion dollars of modeled capital, per Epoch AI cards of 16 September 2026. A field brief on the buildings, the silicon, the turbines, the batteries, the tenants who now hold the hours, and what the compute is actually worth.

Quantum Is Accelerating
Quantum is accelerating. Not toward a machine that breaks RSA next quarter, which is still five orders of magnitude away on the first honest cross-platform yardstick the field has ever had, but toward foundries, clouds, logical qubits and government deadlines that are already fixed. Two clocks are running. Only one of them is slow, and it is not the one that decides what a bank, a court or a ministry has to do this year.
Every story, signed and delivered.
Subscribe to the kxco channel and get the headline, the AI-written key takeaways, and the chain-anchor link the moment we publish. Audio versions and per-ticker subscriptions arrive in the next iteration.