
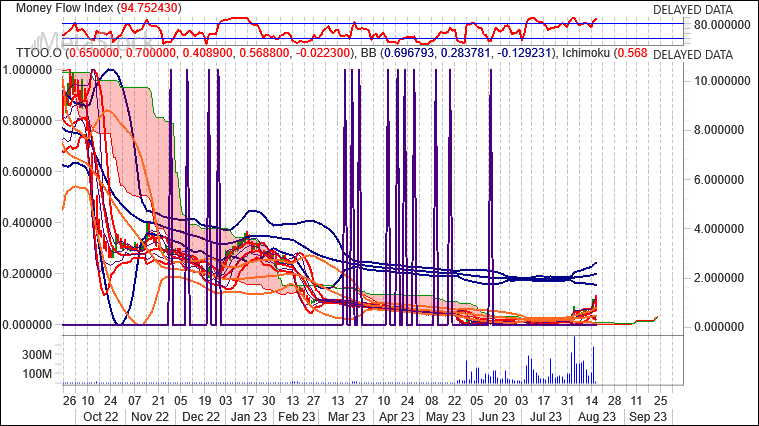
The Shorts are in on TTOO and it loks like a retracement in to the 40c range is on the table, but at that point it looks like a great buy.
T2 Biosystems (NASDAQ:TTOO) Short Interest History
| Market Date | FINRA Non-Exempt Volume | FINRA Exempt Volume | FINRA Short Volume | FINRA Total Volume | FINRA Short Volume Ratio | ||||
|---|---|---|---|---|---|---|---|---|---|
| 2023-08-16 | 104,103,533 | + | 7,133,629 | = | 111,237,162 | / | 200,885,951 | = | 55.37 |
| 2023-08-15 | 125,124,950 | + | 2,258,974 | = | 127,383,924 | / | 236,929,038 | = | 53.76 |
| 2023-08-14 | 34,173,642 | + | 2,022,506 | = | 36,196,148 | / | 64,915,111 | = | 55.76 |
| 2023-08-11 | 21,039,425 | + | 1,735,277 | = | 22,774,702 | / | 42,992,242 | = | 52.97 |
| 2023-08-10 | 43,198,545 | + | 886,263 | = | 44,084,808 | / | 77,286,616 | = | 57.04 |
| 2023-08-09 | 79,017,026 | + | 1,793,196 | = | 80,810,222 | / | 150,255,484 | = | 53.78 |
| 2023-08-08 | 71,598,914 | + | 1,479,391 | = | 73,078,305 | / | 132,350,297 | = | 55.22 |
| 2023-08-07 | 38,031,651 | + | 1,753,856 | = | 39,785,507 | / | 82,657,252 | = | 48.13 |
| 2023-08-04 | 50,356,650 | + | 2,526,674 | = | 52,883,324 | / | 101,452,923 | = | 52.13 |
| 2023-08-03 | 150,693,308 | + | 2,150,228 | = | 152,843,536 | / | 271,766,889 | = | 56.24 |
| Report Date | Total Shares Sold Short | Dollar Volume Sold Short | Change from Previous Report | Percentage of Float Shorted | Days to Cover | Price on Report Date |
|---|---|---|---|---|---|---|
| 7/31/2023 | 15,590,000 shares | $2.30 million | +716.2% | N/A | 0.2 | $0.15 |
| 7/15/2023 | 1,910,000 shares | $212,583.00 | +34.5% | N/A | 0 | $0.11 |
| 6/30/2023 | 1,420,000 shares | $100,252.00 | -41.3% | 6.6% | 0 | $0.07 |
| 6/15/2023 | 2,420,000 shares | $215,380.00 | +869.9% | 11.2% | 0.1 | $0.09 |
| 5/31/2023 | 249,500 shares | $22,455.00 | -47.7% | 1.1% | 0 | $0.09 |
| 5/15/2023 | 476,900 shares | $131,099.81 | -4.9% | 2.0% | 0.6 | $0.27 |
Technical Outlook
Short Term: Overbought
Intermediate Term: Bullish
Long Term: TBD
Momentum is a general term used to describe the speed at which prices move over a given time period. Generally, changes in momentum tend to lead to changes in prices. This expert shows the current values of four popular momentum indicators.
Stochastic Oscillator
One method of interpreting the Stochastic Oscillator is looking for overbought areas (above 80) and oversold areas (below 20). The Stochastic Oscillator is 83.1860. This is an overbought reading. However, a signal is not generated until the Oscillator crosses below 80 The last signal was a sell 9 period(s) ago.
Relative Strength Index (RSI)
The RSI shows overbought (above 70) and oversold (below 30) areas. The current value of the RSI is 79.38. This is where it usually tops. The RSI usually forms tops and bottoms before the underlying security. A buy or sell signal is generated when the RSI moves out of an overbought/oversold area. The last signal was a sell 4 period(s) ago.
Commodity Channel Index (CCI)
The CCI shows overbought (above 100) and oversold (below -100) areas. The current value of the CCI is 170.This is an overbought reading. However, a signal isn’t generated until the indicator crosses below 100. The last signal was a sell 4 period(s) ago.
MACD
The Moving Average Convergence/Divergence indicator (MACD) gives signals when it crosses its 9 period signal line. The last signal was a buy 46 period(s) ago.