
T2 Biosystems, Inc. $TTOO a Short Story
The Shorts are in on TTOO and it loks like a retracement in to the 40c range is on the table, but at that point it looks like a great buy.
T2 Biosystems (NASDAQ:TTOO) Short Interest History
Market Date
FINRA
Non-Exempt Volume
FINRA
Exempt Volume
FINRA
Short Volume
FINRA
Total Volume
FINRA
Short Volume Ratio
2023-08-16
104,103,533
+
7,133,629
=
111,237,162
/
200,885,951
=
55.37
2023-08-15
125,124,950
+
2,258,974
=
127,383,924
/
236,929,038
=
53.76
2023-08-14
34,173,642
+
2,022,506
=
36,196,148
/
64,915,111
=
55.76
2023-08-11
21,039,425
+
1,735,277
=
22,774,702
/
42,992,242
=
52.97
2023-08-10
43,198,545
+
886,263
=
44,084,808
/
77,286,616
=
57.04
2023-08-09
79,017,026
+
1,793,196
=
80,810,222
/
150,255,484
=
53.78
2023-08-08
71,598,914
+
1,479,391
=
73,078,305
/
132,350,297
=
55.22
2023-08-07
38,031,651
+
1,753,856
=
39,785,507
/
82,657,252
=
48.13
2023-08-04
50,356,650
+
2,526,674
=
52,883,324
/
101,452,923
=
52.13
2023-08-03
150,693,308
+
2,150,228
=
152,843,536
/
271,766,889
=
56.24
Report Date
Total Shares Sold Short
Dollar Volume Sold Short
Change from Previous Report
Percentage of Float Shorted
Days to Cover
Price on Report Date
7/31/2023
15,590,000 shares
$2.30 million
+716.2%
N/A
0.2
$0.15
7/15/2023
1,910,000 shares
$212,583.00
+34.5%
N/A
0
$0.11
6/30/2023
1,420,000 shares
$100,252.00
-41.3%
6.6%
0
$0.07
6/15/2023
2,420,000 shares
$215,380.00
+869.9%
11.2%
0.1
$0.09
5/31/2023
249,500 shares
$22,455.00
-47.7%
1.1%
0
$0.09
5/15/2023
476,900 shares
$131,099.81
-4.9%
2.0%
0.6
$0.27

Technical Outlook
Short Term: Overbought
Intermediate Term: Bullish
Long Term: TBD
Momentum is a general term used to describe the speed at which prices move over a given time period. Generally, changes in momentum tend to lead to changes in prices. This expert shows the current values of four popular momentum indicators.
Stochastic Oscillator
One method of interpreting the Stochastic Oscillator is looking for overbought areas (above 80) and oversold areas (below 20). The Stochastic Oscillator is 83.1860. This is an overbought reading. However, a signal is not generated until the Oscillator crosses below 80 The last signal was a sell 9 period(s) ago.
Relative Strength Index (RSI)
The RSI shows overbought (above 70) and oversold (below 30) areas. The current value of the RSI is 79.38. This is where it usually tops. The RSI usually forms tops and bottoms before the underlying security. A buy or sell signal is generated when the RSI moves out of an overbought/oversold area. The last signal was a sell 4 period(s) ago.
Commodity Channel Index (CCI)
The CCI shows overbought (above 100) and oversold (below -100) areas. The current value of the CCI is 170.This is an overbought reading. However, a signal isn't generated until the indicator crosses below 100. The last signal was a sell 4 period(s) ago.
MACD
The Moving Average Convergence/Divergence indicator (MACD) gives signals when it crosses its 9 period signal line. The last signal was a buy 46 period(s) ago.

Ontology Is the Idea Finance Has Been Missing
The world created around 181 zettabytes of data in 2025, and AI adds more every day than anyone can read. The scarce resource is no longer data or compute. It is understanding, and understanding is a picture. Shayne Heffernan on ontology, the visual layer that turns infinite data into insight, and why finance, banking and regulation need it most.
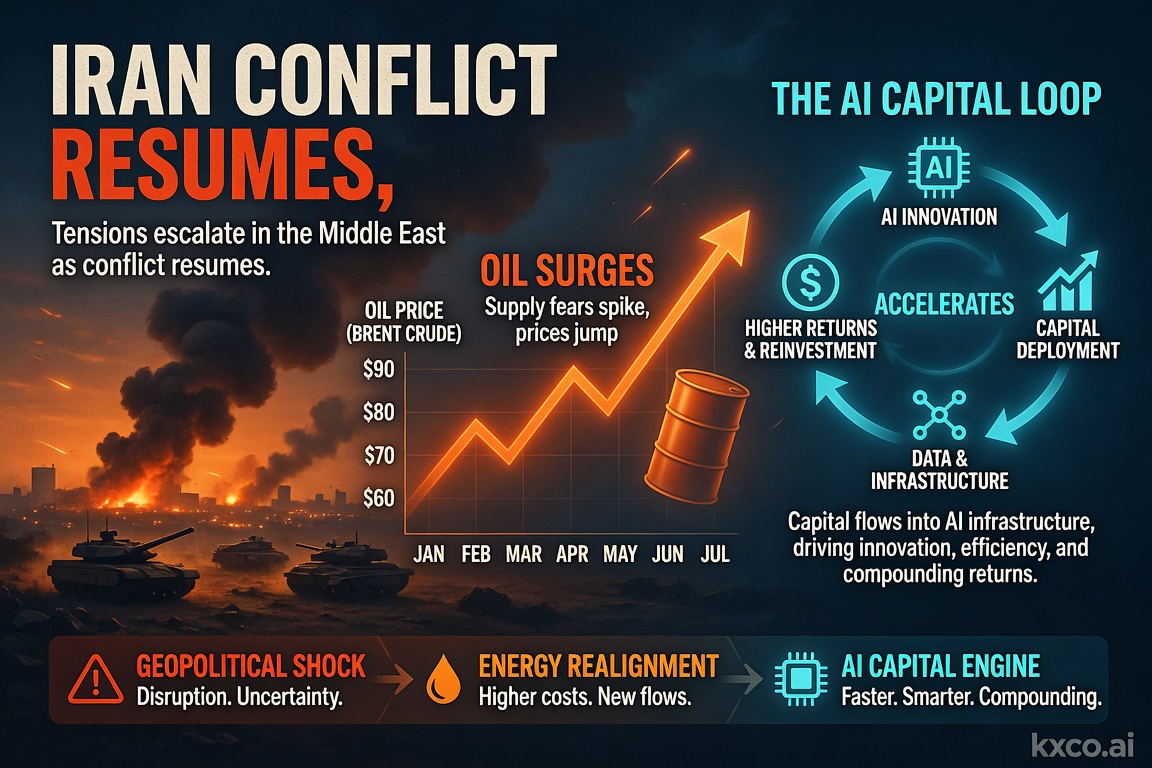
Economic Calendar and Trading Strategies for the Week Ahead: July 14–18, 2026
A pivotal week for markets: US strikes on Iran reignite the oil risk premium, June CPI and retail sales test the Fed's rate-cut path, and the $1 trillion AI capital loop keeps driving the tech trade. Full economic calendar plus trading strategies across oil, gold, Bitcoin, FX and AI stocks.

Ontology: Agentic AI and Infrastructure
The AI trade so far has been a compute trade. The next leg is a meaning trade — and ontology, secured and settled, is the layer almost everyone is skipping. Shayne Heffernan on why ontology is the missing layer in agentic AI, and the infrastructure it needs.
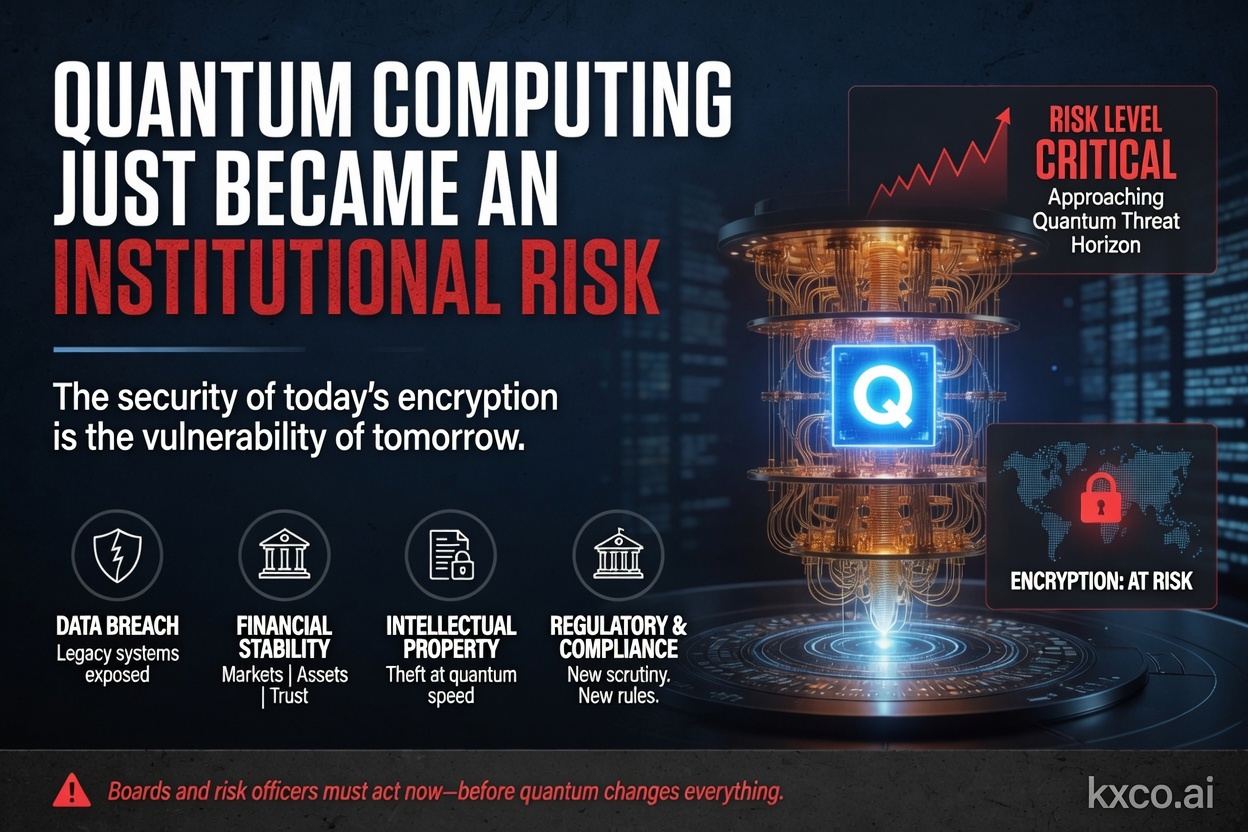
Quantum Computing Just Became an Institutional Risk
Shayne Heffernan on BlackRock's quantum-computing warning for Bitcoin and Ethereum, Google's cryptanalysis research, the two on-chain risk vectors, and how KXCO's Armature L1 — post-quantum from genesis, coordinated by its ontology — answers a threat that just went institutional.
Every story, signed and delivered.
Subscribe to the kxco channel and get the headline, the AI-written key takeaways, and the chain-anchor link the moment we publish. Audio versions and per-ticker subscriptions arrive in the next iteration.