Metastock Charts and Technicals For Ethereum
#Ethereum is a blockchain for decentralized applications (dapps) such as prediction markets or trading venues. Dapps operate similarly to regular applications, but inherit features of blockchain-based technologies such as censorship resistance.
The Ethereum blockchain was co-founded and originally described by Russian-Canadian developer Vitalik Buterin, who remains the project’s most well-known personality.
Decentralized finance (DeFi) is widely regarded as the best Ethereum use case to date. DeFi markets enable permissionless and automated lending, trading and borrowing to anyone with an internet connection. The market recently surpassed some $22 billion in total value locked (TVL) – a metric similar to assets under management (AUM).
DeFi applications typically have their own tokens as well, generally based on Ethereum. That market has enjoyed a second bull run of its own following surging popularity this past summer.
Ethereum 2.0
In the long run, Ethereum proponents are positioning the blockchain project to be a censorship-resistant base layer operating in the background of tomorrow’s internet. This concept is generally referred to as Web 3.0, and will knit today’s social networks with integral money systems.
Ethereum took a significant step towards this goal on Dec. 1 with the release of a new blockchain, the Beacon Chain, which brought in staking – pledging funds to support the network, rather than mining. That upgrade is part one of three in a series of transitions to upgrade the current Ethereum network towards a blockchain capable of handling an entire financial system.
Ethereum closed up 178.070 at 1,411.840. Volume was 12% below average (neutral) and Bollinger Bands were 209% wider than normal.

Short-term traders should pay closer attention to buy/sell arrows while intermediate/long-term traders should place greater emphasis on the bullish or bearish trend reflected in the lower ribbon.
Summary
Ethereum is currently 190.0% above its 200-period moving average and is in an upward trend.
Volatility is high as compared to the average volatility over the last 10 periods.
Our volume indicators reflect moderate flows of volume into Ethereum (mildly bullish).
Our trend forecasting oscillators are currently bullish on Ethereum and have had this outlook for the last 34 periods.
Our momentum oscillator is currently indicating that Ethereum is currently in an overbought condition.
The security price has set a new 14-period high while our momentum oscillator has not.
This is a bearish divergence.
Overall, the bias in prices is: Upwards.
A big white candle occurred.
This is generally considered bullish, as prices closed significantly higher than they opened.
If the candle appears when prices are "low," it may be the first sign of a bottom.
If it occurs when prices are rebounding off of a support area (e.g., a moving average, trendline, or retracement level), the long white candle adds credibility to the support.
Similarly, if the candle appears during a breakout above a resistance area, the long white candle adds credibility to the breakout.
During the past 10 bars, there have been 7 white candles and 3 black candles for a net of 4 white candles.
During the past 50 bars, there have been 32 white candles and 18 black candles for a net of 14 white candles.

Understanding the US China AI and Quantum Landscape
AI and quantum are usually reported as a US–China race. The more useful story is two different systems — frontier capital versus open-source scale — entangled through shared chokepoints. Shayne Heffernan maps the landscape with the KXCO AI Sector Ontology, with comparison graphics and the investable names.
LVMH, Kering and Prada: Luxury's Reckoning
Luxury's worst slump since the pandemic is more than a weak Chinese consumer — shoppers have grown immune to being marketed at, and the brands most reliant on celebrity-and-spectacle marketing are bleeding hardest. Shayne Heffernan on LVMH, Kering and Prada, with US tickers and a P/E scorecard.
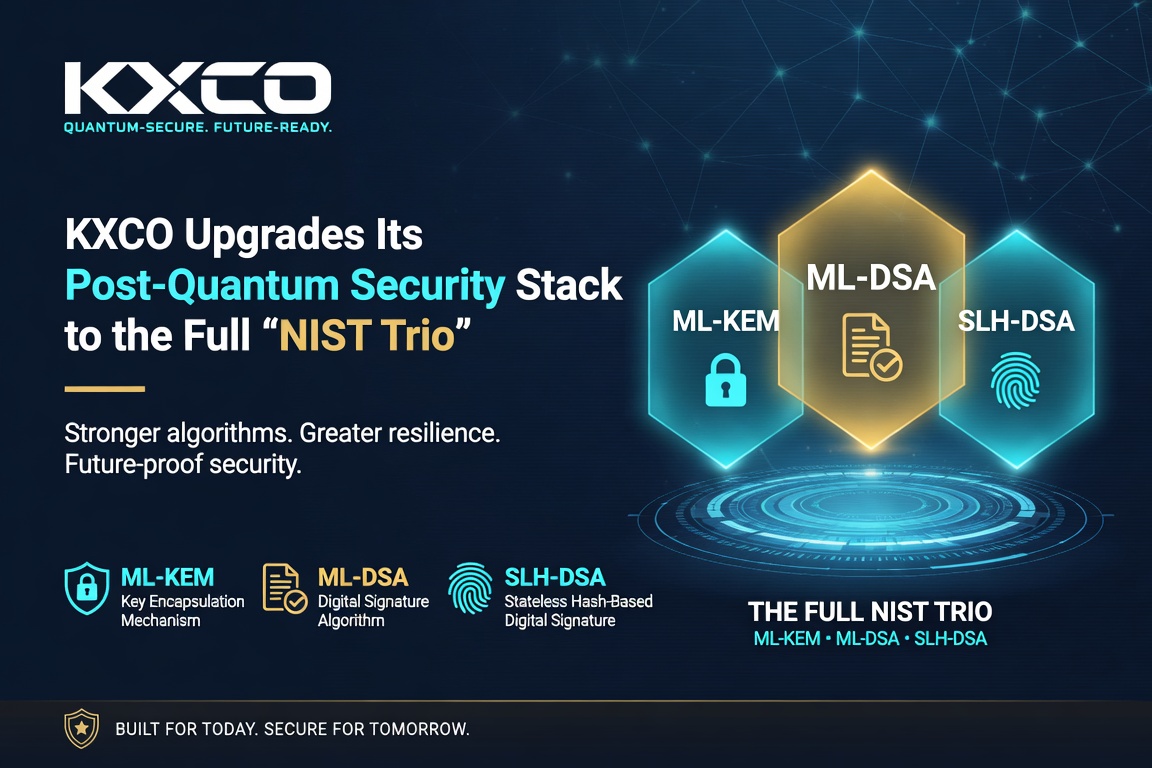
KXCO Upgrades Its Post-Quantum Security Stack to the Full NIST Trio
KXCO has completed the full NIST post-quantum trio — adding hash-based SLH-DSA (FIPS 205) to ML-KEM and ML-DSA and modernising the engine — hardening quantum security across every product, with the whole foundation open and independently verifiable on npm and GitHub. By Shayne Heffernan.

SpaceX: The AI Company You Might Be Missing
The market watches Falcon 9 and Starlink; it is missing the AI company SpaceX has quietly built — xAI, Colossus, the $55bn Terafab chip fab and orbital data centres. Shayne Heffernan maps SpaceX's position against the KXCO AI Sector Ontology ahead of its IPO.
Every story, signed and delivered.
Subscribe to the kxco channel and get the headline, the AI-written key takeaways, and the chain-anchor link the moment we publish. Audio versions and per-ticker subscriptions arrive in the next iteration.