
Is Wall Street Headed for a 2024 Super Rally?
Over the years, Wall Street has consistently emerged as a beacon of wealth creation. When juxtaposed with the returns from housing, gold, oil, and bonds, the stock market outshines these asset classes over extended periods.
However, the narrative shifts when the magnifying glass zooms in on shorter time frames. In recent times, indices like the Dow Jones Industrial Average (DJINDICES: ^DJI), the S&P 500 (SNPINDEX: ^GSPC), and the Nasdaq Composite (NASDAQINDEX: ^IXIC) have oscillated between bullish and bearish territories, leaving investors on tenterhooks.
Predicting the future of the Dow Jones, S&P 500, or Nasdaq Composite remains elusive. Yet, specific data points have historically signaled significant market shifts, capturing the attention of both Wall Street and discerning investors. A prime example currently is the U.S. money supply.
A Deep Dive into U.S. Money Supply Dynamics
Economists primarily monitor M1 and M2, two critical money supply metrics. While M1 represents immediately spendable assets like cash and checking accounts, M2 encompasses M1 and includes savings, money markets, and certain CDs below $100,000. The recent contraction in M2, a phenomenon last witnessed during the Great Depression, is causing concern. With M2's decline amidst rampant inflation, potential economic implications could be dire.
Historically, significant drops in M2 have often foreshadowed economic downturns. While today's economic landscape is vastly different from past centuries, historical patterns suggest caution.

Commercial Bank Credit: Another Warning Sign?
Commercial bank credit, mirroring the trajectory of M2, has shown consistent growth over the decades. However, sporadic declines, especially significant ones, have historically heralded economic challenges. The recent contraction in commercial bank credit might indicate tightening lending standards, potentially affecting corporate earnings and market trajectories.
Historical Perspective: The Optimist's Guide
Despite looming challenges, history underscores the resilience of the market and the rewards for patient, long-term investors. Recessions, while unsettling, are cyclical and often brief. Notably, bullish market trends typically outlast bearish ones, reinforcing the age-old investment adage: time in the market beats timing the market.
Related
Last
Previous
Unit
Reference
GDP Growth Rate
4.90
2.10
percent
Sep 2023
GDP Annual Growth Rate
2.90
2.40
percent
Sep 2023
Government Spending
3843.36
3789.80
USD Billion
Sep 2023
GDP Constant Prices
22490.69
22225.40
USD Billion
Sep 2023
Gross National Product
22641.82
22384.60
USD Billion
Sep 2023
Gross Fixed Capital Formation
3981.30
3955.90
USD Billion
Sep 2023
Changes in Inventories
77.76
14.90
USD Billion
Sep 2023
Real Consumer Spending
3.10
0.80
percent
Sep 2023
GDP Sales QoQ
3.60
2.10
percent
Sep 2023
Full Year GDP Growth
1.90
5.80
percent
Dec 2022
GDP from Utilities
336.30
364.00
USD Billion
Sep 2023
GDP from Transport
736.10
729.00
USD Billion
Sep 2023
GDP from Services
16258.90
16096.70
USD Billion
Sep 2023
GDP from Public Administration
2563.40
2550.50
USD Billion
Sep 2023
GDP from Mining
301.30
292.80
USD Billion
Sep 2023
GDP from Manufacturing
2312.90
2262.30
USD Billion
Sep 2023
GDP from Construction
850.90
820.30
USD Billion
Sep 2023
GDP from Agriculture
179.30
182.10
USD Billion
Sep 2023
Research from Knightsbridge highlights the long-term benefits of staying invested. Regardless of short-term market fluctuations, historical data underscores the importance of a long-term, optimistic investment strategy.
In conclusion, while 2024 might present challenges, armed with historical insights and a patient approach, investors can navigate the markets with confidence.

Ontology Is the Idea Finance Has Been Missing
The world created around 181 zettabytes of data in 2025, and AI adds more every day than anyone can read. The scarce resource is no longer data or compute. It is understanding, and understanding is a picture. Shayne Heffernan on ontology, the visual layer that turns infinite data into insight, and why finance, banking and regulation need it most.
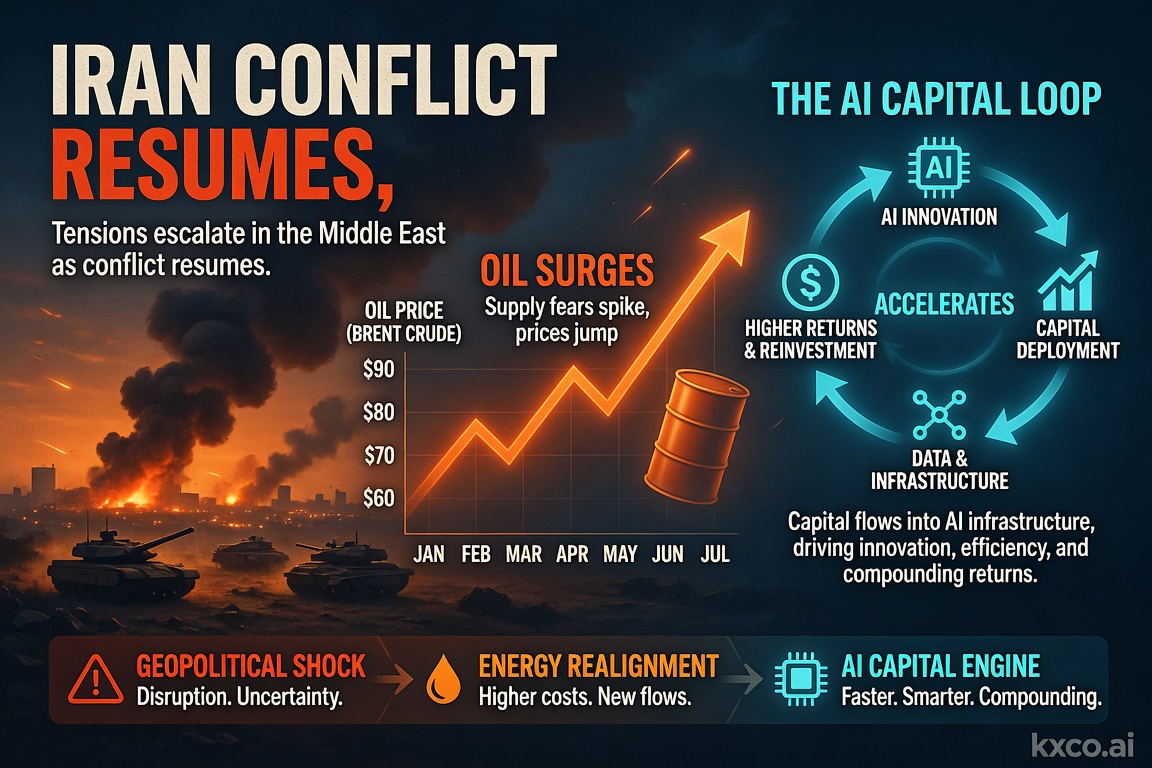
Economic Calendar and Trading Strategies for the Week Ahead: July 14–18, 2026
A pivotal week for markets: US strikes on Iran reignite the oil risk premium, June CPI and retail sales test the Fed's rate-cut path, and the $1 trillion AI capital loop keeps driving the tech trade. Full economic calendar plus trading strategies across oil, gold, Bitcoin, FX and AI stocks.

Ontology: Agentic AI and Infrastructure
The AI trade so far has been a compute trade. The next leg is a meaning trade — and ontology, secured and settled, is the layer almost everyone is skipping. Shayne Heffernan on why ontology is the missing layer in agentic AI, and the infrastructure it needs.

Quantum Computing Just Became an Institutional Risk
Shayne Heffernan on BlackRock's quantum-computing warning for Bitcoin and Ethereum, Google's cryptanalysis research, the two on-chain risk vectors, and how KXCO's Armature L1 — post-quantum from genesis, coordinated by its ontology — answers a threat that just went institutional.
Every story, signed and delivered.
Subscribe to the kxco channel and get the headline, the AI-written key takeaways, and the chain-anchor link the moment we publish. Audio versions and per-ticker subscriptions arrive in the next iteration.