
How to understand MFI on the Bitcoin Market
The Money Flow Index (MFI) is a powerful indicator used in financial analysis, specifically in relation to Bitcoin. It measures the strength of money flowing in and out of the Bitcoin market, taking into account both price and volume data. MFI helps traders and investors identify potential trend reversals and market tops or bottoms.
To calculate MFI for Bitcoin, we follow these steps:
Calculate the Typical Price for each time period, which is the average of the high, low, and closing prices.
Multiply the Typical Price by the trading volume to obtain the Money Flow for each period.
Classify the Money Flow as positive or negative, depending on whether today's Typical Price is higher or lower than yesterday's.
Sum up the Positive Money Flow and Negative Money Flow over a specified number of periods.
Compute the Money Ratio by dividing Positive Money Flow by Negative Money Flow.
Finally, the Money Flow Index is calculated using the Money Ratio.
By observing the MFI in relation to Bitcoin's price action, traders can look for divergences that might indicate potential reversals. For example, if Bitcoin's price trends upward while MFI trends downward (or vice versa), a reversal could be on the horizon.
Additionally, MFI values above 80 may suggest that Bitcoin is overbought, possibly indicating an upcoming market top. Conversely, MFI values below 20 might indicate that Bitcoin is oversold, potentially signaling a market bottom.
The Money Flow Index provides valuable insights into Bitcoin's market sentiment and can aid traders in making informed decisions based on the strength of money flow into or out of the cryptocurrency.
For more detailed information join the XT Knights trading here https://bit.ly/KnightsXT and message https://t.me/XTknights on telegram to join the informed trading group.

Economic Calendar and Trading Strategies for the Week Ahead: July 20–24, 2026
A pivotal week for markets: Iran's closure of the Strait of Hormuz sends crude above $86 and gasoline over $5, while Alphabet, Tesla and Intel earnings test the AI trade. Full economic calendar plus trading strategies across oil, gold, Bitcoin, FX and AI chip stocks.
Economic Calendar and Trading Strategies for the Week Ahead: July 14–18, 2026
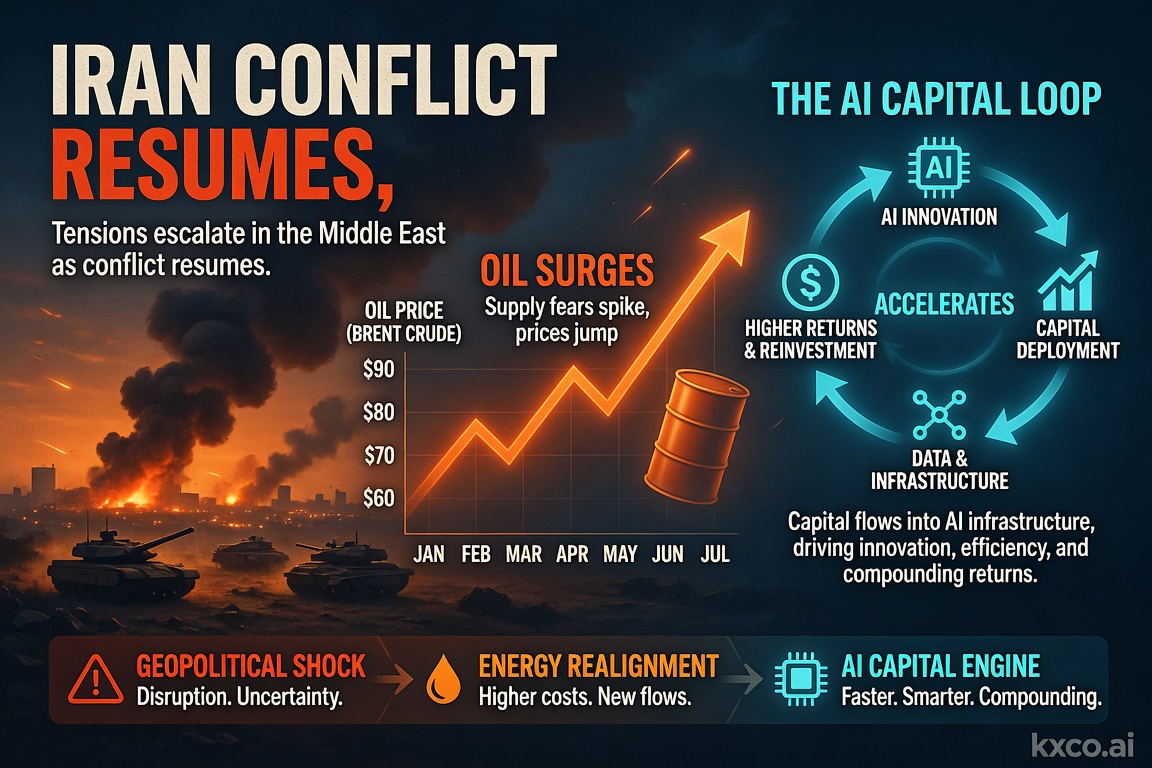
A pivotal week for markets: US strikes on Iran reignite the oil risk premium, June CPI and retail sales test the Fed's rate-cut path, and the $1 trillion AI capital loop keeps driving the tech trade. Full economic calendar plus trading strategies across oil, gold, Bitcoin, FX and AI stocks.

Quantum Computing Just Became an Institutional Risk
Shayne Heffernan on BlackRock's quantum-computing warning for Bitcoin and Ethereum, Google's cryptanalysis research, the two on-chain risk vectors, and how KXCO's Armature L1 — post-quantum from genesis, coordinated by its ontology — answers a threat that just went institutional.

Economic Calendar and Trading Strategies for July 7–11, 2026
A trader's guide to the week of July 7–11, 2026: the US and China economic calendar, the Fed-pivot test after a soft jobs report, and how to trade Nvidia, SpaceX, Bitcoin, the dollar, gold, silver, AI and quantum. Track every release on Live Trading News.
Every story, signed and delivered.
Subscribe to the kxco channel and get the headline, the AI-written key takeaways, and the chain-anchor link the moment we publish. Audio versions and per-ticker subscriptions arrive in the next iteration.