
Cryptocurrency Mining Hardware Market Outlook
According to Technavio, the global cryptocurrency mining hardware market size is projected to grow by USD 12053.16 million from 2022 to 2027. The market is estimated to grow at a CAGR of 11.35% during the forecast period. Moreover, the growth momentum will accelerate. North America held the largest share of the global market in 2022, and the market in the region is estimated to witness an incremental growth of 41%.
Discover some insights on market size before buying the full report. Request a free sample report!
Global Cryptocurrency Mining Hardware Market - Parent Market Analysis
Technavio categorizes the global cryptocurrency mining hardware market as a part of the technology hardware, storage, and peripherals market, which covers manufacturers of cellular phones, personal computers, servers, electronic computer components, and peripherals. It also includes data storage components, motherboards, audio and video cards, monitors, keyboards, printers, and other peripherals. Technavio calculates the global technology hardware, storage, and peripherals market size by considering the revenue generated from sales of hardware devices, equipment, and components.
Find insights on parent market & value chain analysis. Download an exclusive sample!
Global Cryptocurrency Mining Hardware Market - Five Forces
The global cryptocurrency mining hardware market is fragmented, and the five forces analysis covers–
Bargaining Power of Buyers
Threat of New Entrants
Threat of Rivalry
Bargaining Power of Suppliers
Threat of Substitutes
Interpretation of Porter's Five Forces model helps to strategize the business, for entire details - buy report!
Global Cryptocurrency Mining Hardware Market – Customer Landscape
The report includes the market's adoption lifecycle, from the innovator's stage to the laggard's stage. It focuses on adoption rates in different regions based on the penetration. Furthermore, the report also includes key purchase criteria and drivers of price sensitivity to help companies evaluate and develop their growth strategies.
Global Cryptocurrency Mining Hardware Market - Segmentation Assessment
Segment Overview
Technavio has segmented the market based on product, application, and region.
Application-specific integrated circuit (ASIC)-based hardware solutions are used to process and record transactions efficiently. ASIC mining hardware solutions enable miners to remain profitable even if the value of cryptocurrency declines beyond a certain level. Hence, the ASIC segment will grow at the highest rate during the forecast period.
Geography Overview
Based on geography, the global cryptocurrency mining hardware market is segmented into North America, Europe, APAC, South America, and the Middle East and Africa. The report provides actionable insights and estimates the contribution of all regions to the growth of the global cryptocurrency mining hardware market.
North America held 41% of the global cryptocurrency mining hardware market in 2022. The US is the major contributor of revenue to the cryptocurrency mining hardware market in the region owing to the presence of several cryptocurrency mining ventures. In addition, Canada is estimated to evolve into a regional hub for cryptocurrency mining during the forecast period. Several cryptocurrency mining ventures are setting up their businesses in Canada owing to the low cost of electricity generation, easy access to high-speed Internet, and favorable climatic conditions. These factors will further drive the growth of the market in North America during the forecast period.
Global Cryptocurrency Mining Hardware Market – Market Dynamics
Key factors driving market growth
The profitability of cryptocurrency mining ventures is driving the global cryptocurrency mining hardware market growth.
Cryptocurrency miners set up large-scale rigs to increase their profits. In cloud cryptocurrency mining, customers invest in a cloud-hosted cryptocurrency mining venture, which transfers a certain share of the earned cryptocurrency to them.
Thus, the profitability of cryptocurrency mining ventures will encourage several small-scale cryptocurrency mining operators to adopt cloud mining, which will drive the growth of the global cryptocurrency mining hardware market during the forecast period.
Recent trends influencing the market
The acceptance of cryptocurrency by retailers is a key trend in the market.
The growing use of cryptocurrencies by major retailers will increase the use of cryptocurrencies for financial transactions.
Cryptocurrencies such as Bitcoin and Ether are being used for daily transactions by the public, retailers, and merchandisers.
Many small businesses and retailers are accepting cryptocurrency as an alternative form of payment, which will propel the growth of the market during the forecast period.
Major challenges hindering the market growth
The volatility in the value of cryptocurrency is challenging the global cryptocurrency mining hardware market growth.
Due to the volatile value of cryptocurrency, low-risk investors do not include it in their financial portfolios.
Moreover, the lack of transaction charges, position charges, trade posting fees, and regulations on trading platforms also lead to volatility in the value of cryptocurrency.
Therefore, several investors refrain from including cryptocurrency in their financial portfolios, which is a challenge for the growth of the global cryptocurrency mining hardware market.
Drivers, Trends, and Challenges are the factors of market dynamics, which state about consequences and sustainability of the businesses. Find some insights from a free sample report!
What are the key data covered in this cryptocurrency mining hardware market report?
CAGR of the market during the forecast period
Detailed information on factors that will drive the growth of the cryptocurrency mining hardware market between 2023 and 2027
Precise estimation of the size of the cryptocurrency mining hardware market and its contribution to the parent market
Accurate predictions about upcoming trends and changes in consumer behavior
Growth of the cryptocurrency mining hardware market industry across APAC, North America, Europe, Middle East and Africa, and South America
Thorough analysis of the market's competitive landscape and detailed information about vendors
Comprehensive analysis of factors that will challenge the growth of cryptocurrency mining hardware market vendors
Gain instant access to 17,000+ market research reports.
Technavio's SUBSCRIPTION platform
Related Reports:
The crypto wallet market size is projected to grow by USD 686.05 million with a CAGR of 24.19% between 2021 to 2026. The market is segmented by product (software-based and hardware-based) and geography (North America, Europe, APAC, South America, and the Middle East and Africa).
The ASIC miner market size is projected to grow by USD 125.57 million with a CAGR of 6.74% between 2021 to 2026. The market is segmented by application (enterprise and personal) and geography (North America, Europe, APAC, South America, and the Middle East and Africa).
Cryptocurrency Mining Hardware Market Scope
Report Coverage
Details
Page number
120
Base year
2022
Historic Period
2017 -2021
Forecast period
2023 -2027
Growth momentum & CAGR
Accelerate at a CAGR of 11.35%
Market growth 2023-2027
USD 12053.16 million
Market structure
Fragmented
YoY growth (%)
10.71
Regional analysis
North America, Europe, APAC, Middle East and Africa, and South America
Performing market contribution
North America at 41%
Key countries
US, China, Russia, Germany, and Ireland
Competitive landscape
Leading companies, Market Positioning of Vendors, Competitive Strategies, and Industry Risks
Leading Vendors, Market Positioning of Vendors
Argo Blockchain Plc, BIT Digital Inc., Bitfarms Ltd., BitMain Group, Canaan Inc., Ebang International Holdings Inc., Elite Mining Inc., ePIC Blockchain Technologies Inc., Genesis Mining Ltd., GMO Internet Group Inc., Helium Systems Inc., HIVE Blockchain Technologies Ltd., Hut 8 Mining Corp., Intelion Mine LLC, Marathon Digital Holdings Inc., NiceHash Ltd., Riot Blockchain Inc., Shenzhen Fusionsilicon Semiconductor Co. Ltd., Shenzhen Jingang Zhuoyue Co., Ltd, Shenzhen MicroBT Electronics Technology Co. Ltd, and Spondoolies Ltd.
Market Dynamics
Parent Market Analysis; Market growth inducers and obstacles; Fast-growing and slow-growing segment analysis for the forecast period
Customization purview
If our report has not included the data that you are looking for, you can reach out to our analysts and get segments customized.
Browse Information Technology Market Reports
Table of Contents:
1 Executive Summary
1.1 Market overview Exhibit 01: Executive Summary – Chart on Market Overview Exhibit 02: Executive Summary – Data Table on Market Overview Exhibit 03: Executive Summary – Chart on Global Market Characteristics Exhibit 04: Executive Summary – Chart on Market by Geography Exhibit 05: Executive Summary – Chart on Market Segmentation by Product Exhibit 06: Executive Summary – Chart on Market Segmentation by Application Exhibit 07: Executive Summary – Chart on Incremental Growth Exhibit 08: Executive Summary – Data Table on Incremental Growth Exhibit 09: Executive Summary – Chart on Vendor Market Positioning
2 Market Landscape
2.1 Market ecosystem Exhibit 10: Parent market Exhibit 11: Market Characteristics
3 Market Sizing
3.1 Market definition Exhibit 12: Offerings of vendors included in the market definition
3.2 Market segment analysis Exhibit 13: Market segments
3.3 Market size 2022
3.4 Market outlook: Forecast for 2022-2027 Exhibit 14: Chart on Global - Market size and forecast 2022-2027 ($ million) Exhibit 15: Data Table on Global - Market size and forecast 2022-2027 ($ million) Exhibit 16: Chart on Global Market: Year-over-year growth 2022-2027 (%) Exhibit 17: Data Table on Global Market: Year-over-year growth 2022-2027 (%)
4 Five Forces Analysis
4.1 Five forces summary Exhibit 18: Five forces analysis - Comparison between 2022 and 2027
4.2 Bargaining power of buyers Exhibit 19: Chart on Bargaining power of buyers – Impact of key factors 2022 and 2027
4.3 Bargaining power of suppliers Exhibit 20: Bargaining power of suppliers – Impact of key factors in 2022 and 2027
4.4 Threat of new entrants Exhibit 21: Threat of new entrants – Impact of key factors in 2022 and 2027
4.5 Threat of substitutes Exhibit 22: Threat of substitutes – Impact of key factors in 2022 and 2027
4.6 Threat of rivalry Exhibit 23: Threat of rivalry – Impact of key factors in 2022 and 2027
4.7 Market condition Exhibit 24: Chart on Market condition - Five forces 2022 and 2027
5 Market Segmentation by Product
5.1 Market segments Exhibit 25: Chart on Product - Market share 2022-2027 (%) Exhibit 26: Data Table on Product - Market share 2022-2027 (%)
5.2 Comparison by Product Exhibit 27: Chart on Comparison by Product Exhibit 28: Data Table on Comparison by Product
5.3 ASIC - Market size and forecast 2022-2027 Exhibit 29: Chart on ASIC - Market size and forecast 2022-2027 ($ million) Exhibit 30: Data Table on ASIC - Market size and forecast 2022-2027 ($ million) Exhibit 31: Chart on ASIC - Year-over-year growth 2022-2027 (%) Exhibit 32: Data Table on ASIC - Year-over-year growth 2022-2027 (%)
5.4 GPU - Market size and forecast 2022-2027 Exhibit 33: Chart on GPU - Market size and forecast 2022-2027 ($ million) Exhibit 34: Data Table on GPU - Market size and forecast 2022-2027 ($ million) Exhibit 35: Chart on GPU - Year-over-year growth 2022-2027 (%) Exhibit 36: Data Table on GPU - Year-over-year growth 2022-2027 (%)
5.5 Others - Market size and forecast 2022-2027 Exhibit 37: Chart on Others - Market size and forecast 2022-2027 ($ million) Exhibit 38: Data Table on Others - Market size and forecast 2022-2027 ($ million) Exhibit 39: Chart on Others - Year-over-year growth 2022-2027 (%) Exhibit 40: Data Table on Others - Year-over-year growth 2022-2027 (%)
5.6 Market opportunity by Product Exhibit 41: Market opportunity by Product ($ million)
6 Market Segmentation by Application
6.1 Market segments Exhibit 42: Chart on Application - Market share 2022-2027 (%) Exhibit 43: Data Table on Application - Market share 2022-2027 (%)
6.2 Comparison by Application Exhibit 44: Chart on Comparison by Application Exhibit 45: Data Table on Comparison by Application
6.3 Bitcoin mining - Market size and forecast 2022-2027 Exhibit 46: Chart on Bitcoin mining - Market size and forecast 2022-2027 ($ million) Exhibit 47: Data Table on Bitcoin mining - Market size and forecast 2022-2027 ($ million) Exhibit 48: Chart on Bitcoin mining - Year-over-year growth 2022-2027 (%) Exhibit 49: Data Table on Bitcoin mining - Year-over-year growth 2022-2027 (%)
6.4 Ethereum mining - Market size and forecast 2022-2027 Exhibit 50: Chart on Ethereum mining - Market size and forecast 2022-2027 ($ million) Exhibit 51: Data Table on Ethereum mining - Market size and forecast 2022-2027 ($ million) Exhibit 52: Chart on Ethereum mining - Year-over-year growth 2022-2027 (%) Exhibit 53: Data Table on Ethereum mining - Year-over-year growth 2022-2027 (%)
6.5 Others - Market size and forecast 2022-2027 Exhibit 54: Chart on Others - Market size and forecast 2022-2027 ($ million) Exhibit 55: Data Table on Others - Market size and forecast 2022-2027 ($ million) Exhibit 56: Chart on Others - Year-over-year growth 2022-2027 (%) Exhibit 57: Data Table on Others - Year-over-year growth 2022-2027 (%)
6.6 Market opportunity by Application Exhibit 58: Market opportunity by Application ($ million)
7 Customer Landscape
7.1 Customer landscape overview Exhibit 59: Analysis of price sensitivity, lifecycle, customer purchase basket, adoption rates, and purchase criteria
8 Geographic Landscape
8.1 Geographic segmentation Exhibit 60: Chart on Market share by geography 2022-2027 (%) Exhibit 61: Data Table on Market share by geography 2022-2027 (%)
8.2 Geographic comparison Exhibit 62: Chart on Geographic comparison Exhibit 63: Data Table on Geographic comparison
8.3 North America - Market size and forecast 2022-2027 Exhibit 64: Chart on North America - Market size and forecast 2022-2027 ($ million) Exhibit 65: Data Table on North America - Market size and forecast 2022-2027 ($ million) Exhibit 66: Chart on North America - Year-over-year growth 2022-2027 (%) Exhibit 67: Data Table on North America - Year-over-year growth 2022-2027 (%)
8.4 Europe - Market size and forecast 2022-2027 Exhibit 68: Chart on Europe - Market size and forecast 2022-2027 ($ million) Exhibit 69: Data Table on Europe - Market size and forecast 2022-2027 ($ million) Exhibit 70: Chart on Europe - Year-over-year growth 2022-2027 (%) Exhibit 71: Data Table on Europe - Year-over-year growth 2022-2027 (%)
8.5 APAC - Market size and forecast 2022-2027 Exhibit 72: Chart on APAC - Market size and forecast 2022-2027 ($ million) Exhibit 73: Data Table on APAC - Market size and forecast 2022-2027 ($ million) Exhibit 74: Chart on APAC - Year-over-year growth 2022-2027 (%) Exhibit 75: Data Table on APAC - Year-over-year growth 2022-2027 (%)
8.6 South America - Market size and forecast 2022-2027 Exhibit 76: Chart on South America - Market size and forecast 2022-2027 ($ million) Exhibit 77: Data Table on South America - Market size and forecast 2022-2027 ($ million) Exhibit 78: Chart on South America - Year-over-year growth 2022-2027 (%) Exhibit 79: Data Table on South America - Year-over-year growth 2022-2027 (%)
8.7 Middle East and Africa - Market size and forecast 2022-2027 Exhibit 80: Chart on Middle East and Africa - Market size and forecast 2022-2027 ($ million) Exhibit 81: Data Table on Middle East and Africa - Market size and forecast 2022-2027 ($ million) Exhibit 82: Chart on Middle East and Africa - Year-over-year growth 2022-2027 (%) Exhibit 83: Data Table on Middle East and Africa - Year-over-year growth 2022-2027 (%)
8.8 US - Market size and forecast 2022-2027 Exhibit 84: Chart on US - Market size and forecast 2022-2027 ($ million) Exhibit 85: Data Table on US - Market size and forecast 2022-2027 ($ million) Exhibit 86: Chart on US - Year-over-year growth 2022-2027 (%) Exhibit 87: Data Table on US - Year-over-year growth 2022-2027 (%)
8.9 China - Market size and forecast 2022-2027 Exhibit 88: Chart on China - Market size and forecast 2022-2027 ($ million) Exhibit 89: Data Table on China - Market size and forecast 2022-2027 ($ million) Exhibit 90: Chart on China - Year-over-year growth 2022-2027 (%) Exhibit 91: Data Table on China - Year-over-year growth 2022-2027 (%)
8.10 Russia - Market size and forecast 2022-2027 Exhibit 92: Chart on Russia - Market size and forecast 2022-2027 ($ million) Exhibit 93: Data Table on Russia - Market size and forecast 2022-2027 ($ million) Exhibit 94: Chart on Russia - Year-over-year growth 2022-2027 (%) Exhibit 95: Data Table on Russia - Year-over-year growth 2022-2027 (%)
8.11 Germany - Market size and forecast 2022-2027 Exhibit 96: Chart on Germany - Market size and forecast 2022-2027 ($ million) Exhibit 97: Data Table on Germany - Market size and forecast 2022-2027 ($ million) Exhibit 98: Chart on Germany - Year-over-year growth 2022-2027 (%) Exhibit 99: Data Table on Germany - Year-over-year growth 2022-2027 (%)
8.12 Ireland - Market size and forecast 2022-2027 Exhibit 100: Chart on Ireland - Market size and forecast 2022-2027 ($ million) Exhibit 101: Data Table on Ireland - Market size and forecast 2022-2027 ($ million) Exhibit 102: Chart on Ireland - Year-over-year growth 2022-2027 (%) Exhibit 103: Data Table on Ireland - Year-over-year growth 2022-2027 (%)
8.13 Market opportunity by geography Exhibit 104: Market opportunity by geography ($ million)
9 Drivers, Challenges, and Trends
9.1 Market drivers
9.2 Market challenges
9.3 Impact of drivers and challenges Exhibit 105: Impact of drivers and challenges in 2022 and 2027
9.4 Market trends
10 Vendor Landscape
10.1 Overview
10.2 Vendor landscape Exhibit 106: Overview on Criticality of inputs and Factors of differentiation
10.3 Landscape disruption Exhibit 107: Overview on factors of disruption
10.4 Industry risks Exhibit 108: Impact of key risks on business
11 Vendor Analysis
11.1 Vendors covered Exhibit 109: Vendors covered
11.2 Market positioning of vendors Exhibit 110: Matrix on vendor position and classification
11.3 BIT Digital Inc. Exhibit 111: BIT Digital Inc. - Overview Exhibit 112: BIT Digital Inc. - Product / Service Exhibit 113: BIT Digital Inc. - Key offerings
11.4 BitMain Group Exhibit 114: BitMain Group - Overview Exhibit 115: BitMain Group - Product / Service Exhibit 116: BitMain Group - Key offerings
11.5 Canaan Inc. Exhibit 117: Canaan Inc. - Overview Exhibit 118: Canaan Inc. - Product / Service Exhibit 119: Canaan Inc. - Key offerings
11.6 Ebang International Holdings Inc. Exhibit 120: Ebang International Holdings Inc. - Overview Exhibit 121: Ebang International Holdings Inc. - Product / Service Exhibit 122: Ebang International Holdings Inc. - Key offerings
11.7 Elite Mining Inc. Exhibit 123: Elite Mining Inc. - Overview Exhibit 124: Elite Mining Inc. - Product / Service Exhibit 125: Elite Mining Inc. - Key offerings
11.8 ePIC Blockchain Technologies Inc. Exhibit 126: ePIC Blockchain Technologies Inc. - Overview Exhibit 127: ePIC Blockchain Technologies Inc. - Product / Service Exhibit 128: ePIC Blockchain Technologies Inc. - Key offerings
11.9 Helium Systems Inc. Exhibit 129: Helium Systems Inc. - Overview Exhibit 130: Helium Systems Inc. - Product / Service Exhibit 131: Helium Systems Inc. - Key offerings
11.10 HIVE Blockchain Technologies Ltd. Exhibit 132: HIVE Blockchain Technologies Ltd. - Overview Exhibit 133: HIVE Blockchain Technologies Ltd. - Product / Service Exhibit 134: HIVE Blockchain Technologies Ltd. - Key offerings
11.11 Hut 8 Mining Corp. Exhibit 135: Hut 8 Mining Corp. - Overview Exhibit 136: Hut 8 Mining Corp. - Product / Service Exhibit 137: Hut 8 Mining Corp. - Key offerings
11.12 Intelion Mine LLC Exhibit 138: Intelion Mine LLC - Overview Exhibit 139: Intelion Mine LLC - Product / Service Exhibit 140: Intelion Mine LLC - Key offerings
11.13 Marathon Digital Holdings Inc. Exhibit 141: Marathon Digital Holdings Inc. - Overview Exhibit 142: Marathon Digital Holdings Inc. - Product / Service Exhibit 143: Marathon Digital Holdings Inc. - Key offerings
11.14 Riot Blockchain Inc. Exhibit 144: Riot Blockchain Inc. - Overview Exhibit 145: Riot Blockchain Inc. - Business segments Exhibit 146: Riot Blockchain Inc. - Key offerings Exhibit 147: Riot Blockchain Inc. - Segment focus
11.15 Shenzhen Fusionsilicon Semiconductor Co. Ltd. Exhibit 148: Shenzhen Fusionsilicon Semiconductor Co. Ltd. - Overview Exhibit 149: Shenzhen Fusionsilicon Semiconductor Co. Ltd. - Product / Service Exhibit 150: Shenzhen Fusionsilicon Semiconductor Co. Ltd. - Key offerings
11.16 Shenzhen Jingang Zhuoyue Co., Ltd Exhibit 151: Shenzhen Jingang Zhuoyue Co., Ltd - Overview Exhibit 152: Shenzhen Jingang Zhuoyue Co., Ltd - Product / Service Exhibit 153: Shenzhen Jingang Zhuoyue Co., Ltd - Key offerings
11.17 Spondoolies Ltd. Exhibit 154: Spondoolies Ltd. - Overview Exhibit 155: Spondoolies Ltd. - Product / Service Exhibit 156: Spondoolies Ltd. - Key offerings
12 Appendix
12.1 Scope of the report
12.2 Inclusions and exclusions checklist Exhibit 157: Inclusions checklist Exhibit 158: Exclusions checklist
12.3 Currency conversion rates for US$ Exhibit 159: Currency conversion rates for US$
12.4 Research methodology Exhibit 160: Research methodology Exhibit 161: Validation techniques employed for market sizing Exhibit 162: Information sources
12.5 List of abbreviations Exhibit 163: List of abbreviations
About Us
Technavio is a leading global technology research and advisory company. Their research and analysis focus on emerging market trends and provide actionable insights to help businesses identify market opportunities and develop effective strategies to optimize their market positions. With over 500 specialized analysts, Technavio's report library consists of more than 17,000 reports and counting, covering 800 technologies, spanning 50 countries. Their client base consists of enterprises of all sizes, including more than 100 Fortune 500 companies. This growing client base relies on Technavio's comprehensive coverage, extensive research, and actionable market insights to identify opportunities in existing and potential markets and assess their competitive positions within changing market scenarios.

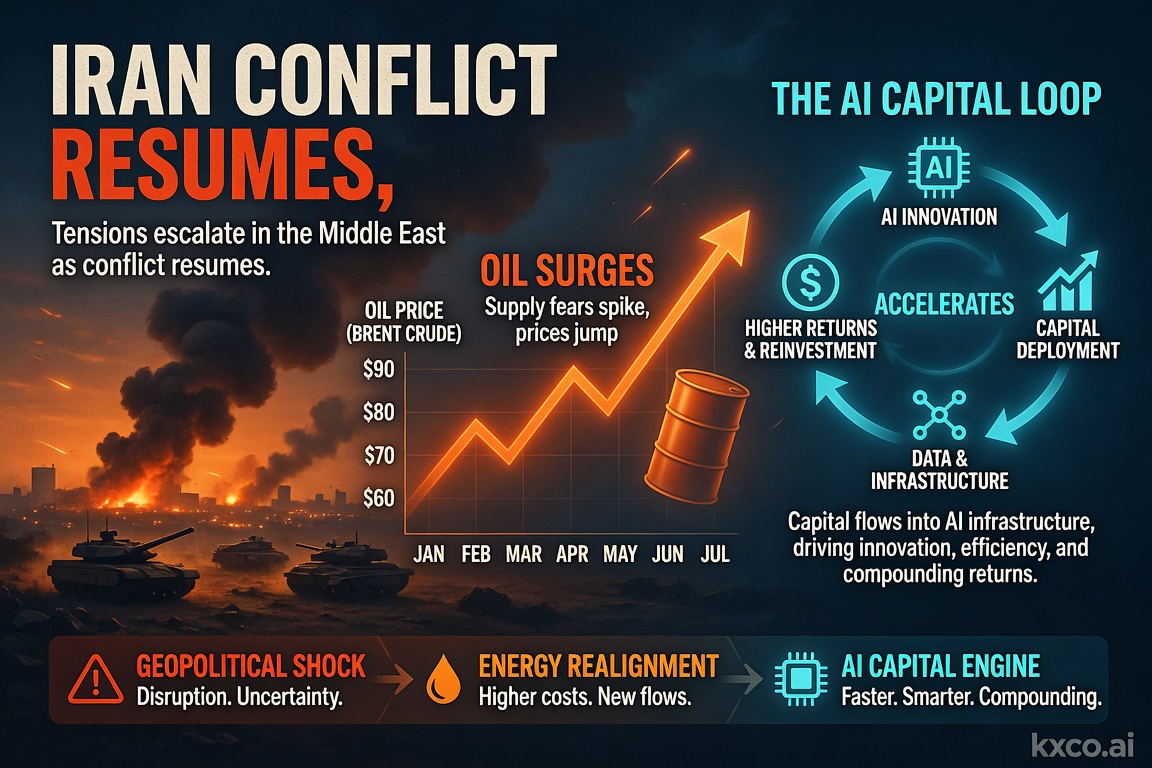
Economic Calendar and Trading Strategies for the Week Ahead: July 14–18, 2026
A pivotal week for markets: US strikes on Iran reignite the oil risk premium, June CPI and retail sales test the Fed's rate-cut path, and the $1 trillion AI capital loop keeps driving the tech trade. Full economic calendar plus trading strategies across oil, gold, Bitcoin, FX and AI stocks.

Quantum Computing Just Became an Institutional Risk
Shayne Heffernan on BlackRock's quantum-computing warning for Bitcoin and Ethereum, Google's cryptanalysis research, the two on-chain risk vectors, and how KXCO's Armature L1 — post-quantum from genesis, coordinated by its ontology — answers a threat that just went institutional.

Quantum, AI and the Trust Problem Markets Aren't Pricing
Quantum computing and AI agents are usually traded as separate stories. They are one story, and it is about trust. Shayne Heffernan on why the financial system needs verifiable infrastructure before the volume of machine transactions makes retrofitting impossible.

Economic Calendar and Trading Strategies for July 7–11, 2026
A trader's guide to the week of July 7–11, 2026: the US and China economic calendar, the Fed-pivot test after a soft jobs report, and how to trade Nvidia, SpaceX, Bitcoin, the dollar, gold, silver, AI and quantum. Track every release on Live Trading News.
Every story, signed and delivered.
Subscribe to the kxco channel and get the headline, the AI-written key takeaways, and the chain-anchor link the moment we publish. Audio versions and per-ticker subscriptions arrive in the next iteration.