
PMI
1. Manufacturing Purchasing Managers Index
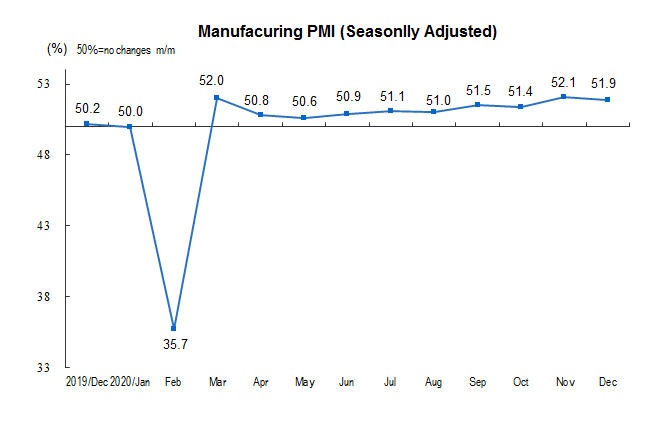
In December 2020, China’s Manufacturing Purchasing Managers Index (PMI) was 51.9 percent, down by 0.2 percentage point from last month, which was above the threshold for ten consecutive months, indicating that the manufacturing industry continued to recovery steadily.
In terms of enterprise scale, the PMI of large enterprises was 52.7 percent, which was 0.3 percentage point lower than that of last month, but still higher than the threshold; the PMI of medium-sized enterprises was 52.7 percent, which was 0.7 percentage point higher than that of last month, and continued to be above the threshold; the PMI of small enterprises was 48.8 percent, which was 1.3 percentage points lower than that of last month, which was lower than the threshold.
According to the classification index, the five sub-indices composing PMI, the production index and new orders index were both above the threshold, while raw materials inventory index, employment index and supplier distribution time index all stayed below the threshold.
Production index was 54.2 percent, down by 0.5 percentage point from last month, but still stayed above the threshold, indicating that the growth rate of manufacturing production has slightly slowed down.
New orders index was 53.6 percent, down by 0.3 percentage point from last month, but still stayed above the threshold, indicating that the demand of the manufacturing industry continued to improve.
The inventory index of raw materials was 48.6 percent, unchanged with last month, indicating that the inventory of major raw materials in the manufacturing industry has declined over the previous month.
The employment index was 49.6 percent, slightly up 0.1 percentage point from the previous month, indicating a slight improvement in the employment outlook of manufacturing enterprises.
The supplier delivery time index was 49.9 percent, which was 0.2 percentage point lower than the previous month, indicating that the delivery time of raw material suppliers in manufacturing industry was slightly slower than that of last month.
| China’s Manufacturing PMI (Seasonally Adjusted) | ||||||
| Unit: % | ||||||
| PMI | ||||||
| Production Index | New Orders Index | Main Raw Materials Inventory Index | Employed Person Index | Supplier Delivery Time Index | ||
| 2019-December | 50.2 | 53.2 | 51.2 | 47.2 | 47.3 | 51.1 |
| 2020-January | 50.0 | 51.3 | 51.4 | 47.1 | 47.5 | 49.9 |
| February | 35.7 | 27.8 | 29.3 | 33.9 | 31.8 | 32.1 |
| March | 52.0 | 54.1 | 52.0 | 49.0 | 50.9 | 48.2 |
| April | 50.8 | 53.7 | 50.2 | 48.2 | 50.2 | 50.1 |
| May | 50.6 | 53.2 | 50.9 | 47.3 | 49.4 | 50.5 |
| June | 50.9 | 53.9 | 51.4 | 47.6 | 49.1 | 50.5 |
| July | 51.1 | 54.0 | 51.7 | 47.9 | 49.3 | 50.4 |
| August | 51.0 | 53.5 | 52.0 | 47.3 | 49.4 | 50.4 |
| September | 51.5 | 54.0 | 52.8 | 48.5 | 49.6 | 50.7 |
| October | 51.4 | 53.9 | 52.8 | 48.0 | 49.3 | 50.6 |
| November | 52.1 | 54.7 | 53.9 | 48.6 | 49.5 | 50.1 |
| December | 51.9 | 54.2 | 53.6 | 48.6 | 49.6 | 49.9 |
| Related Indicators of China’s Manufacturing PMI (Seasonally Adjusted) | ||||||||
| Unit: % | ||||||||
| New Export Orders Index | Import Index | Purchase Quantity Index | Main Raw Material Purchase Price Index | Producer Price Index | Finished Goods Inventory Index | Open Orders Index | Production And Business Activities Expectation Index | |
| 2019-December | 50.3 | 49.9 | 51.3 | 51.8 | 49.2 | 45.6 | 45.0 | 54.4 |
| 2020-January | 48.7 | 49.0 | 51.6 | 53.8 | 49.0 | 46.0 | 46.3 | 57.9 |
| February | 28.7 | 31.9 | 29.3 | 51.4 | 44.3 | 46.1 | 35.6 | 41.8 |
| March | 46.4 | 48.4 | 52.7 | 45.5 | 43.8 | 49.1 | 46.3 | 54.4 |
| April | 33.5 | 43.9 | 52.0 | 42.5 | 42.2 | 49.3 | 43.6 | 54.0 |
| May | 35.3 | 45.3 | 50.8 | 51.6 | 48.7 | 47.3 | 44.1 | 57.9 |
| June | 42.6 | 47.0 | 51.8 | 56.8 | 52.4 | 46.8 | 44.8 | 57.5 |
| July | 48.4 | 49.1 | 52.4 | 58.1 | 52.2 | 47.6 | 45.6 | 57.8 |
| August | 49.1 | 49.0 | 51.7 | 58.3 | 53.2 | 47.1 | 46.0 | 58.6 |
| September | 50.8 | 50.4 | 53.6 | 58.5 | 52.5 | 48.4 | 46.1 | 58.7 |
| October | 51.0 | 50.8 | 53.1 | 58.8 | 53.2 | 44.9 | 47.2 | 59.3 |
| November | 51.5 | 50.9 | 53.7 | 62.6 | 56.5 | 45.7 | 46.7 | 60.1 |
| December | 51.3 | 50.4 | 53.2 | 68.0 | 58.9 | 46.2 | 47.1 | 59.8 |
2. Non-manufacturing purchasing managers index
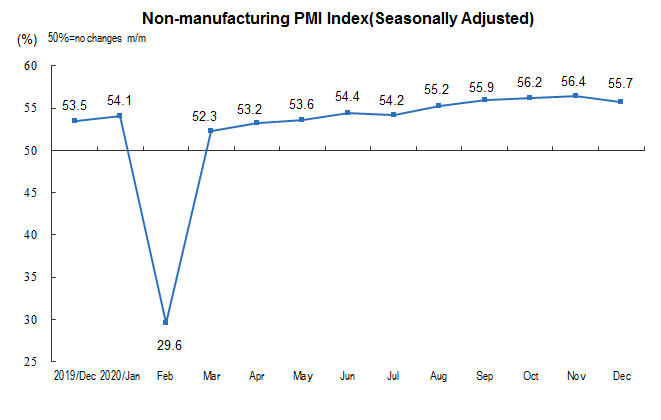
In December, the non-manufacturing business activity index was 55.7 percent, which was 0.7 percentage point lower than that of last month, but it continued to be in a relatively high economic zone, and the non-manufacturing industry continued to recover steadily.
In terms of industry, the construction industry business activity index was 60.7 percent, 0.2 percentage point higher than that of last month. The business activity index of service industry was 54.8 percent, 0.9 percentage point lower than that of last month. From the perspective of industry situation, the business activity index of air transportation, post, telecommunication, radio and television satellite transmission services, monetary and financial services, and capital market services was in the high prosperity range of more than 60.0 percent; the business activity index of catering, real estate, ecological protection and environmental governance stayed below the threshold.
The index of new orders was 51.9 percent, down 0.9 percentage point from the previous month, indicating that the growth of demand in the non-manufacturing market has slowed down. By industry, the new order index of construction industry was 55.8 percent, up 1.8 percentage points from last month; the new order index of service industry was 51.2 percent, down 1.4 percentage points from last month.
The price index of inputs was 54.3 percent, up 1.6 percentage points from last month, indicating that the prices of inputs used by non-manufacturing enterprises for business activities continued to rise. By industry, the price index of construction inputs was 61.2 percent, up 3.7 percentage points from last month; the price index of service inputs was 53.1 percent, up 1.2 percentage points from last month.
The sales price index was 52.3 percent, up 1.3 percentage points from last month, indicating that the overall sales price of non-manufacturing industry continued to rise. By industry, the sales price index of the construction industry was 54.0 percent, up 2.7 percentage points from the previous month; the sales price index of the service industry was 52.0 percent, up 1.1 percentage points from the previous month.
The employment index was 48.7 percent, down 0.2 percentage point from the previous month, indicating that the employment outlook of the non-manufacturing industry has dropped slightly. By industry, the employment index of construction industry was 52.7 percent, down 1.7 percentage points from last month; the employment index of service industry was 48.0 percent, up 0.1 percentage point from last month.
The expected index of business activities was 60.6 percent, down 0.6 percentage point from last month, but it continued to be in the high economic zone, indicating that most non-manufacturing enterprises were still optimistic about the stable recovery of the industry. In terms of different industries, the expected index of business activities in the construction industry was 63.5 percent, up 1.7 percentage points from last month; the expected index of business activities in the service industry was 60.1 percent, down 1.0 percentage point from last month.
| Main Indices of China’s Non-manufacturing PMI (Seasonally Adjusted) | ||||||
| Unit: % | ||||||
| Non-manufacturing PMI | New Orders Index | Input Price Index | Sales Price Index | Employment Index | Business Activities Expectation Index | |
| 2019-December | 53.5 | 50.4 | 52.4 | 50.3 | 48.3 | 59.1 |
| 2020-January | 54.1 | 50.6 | 53.3 | 50.5 | 48.6 | 59.6 |
| February | 29.6 | 26.5 | 49.3 | 43.9 | 37.9 | 40.0 |
| March | 52.3 | 49.2 | 49.4 | 46.1 | 47.7 | 57.3 |
| April | 53.2 | 52.1 | 49.0 | 45.4 | 48.6 | 60.1 |
| May | 53.6 | 52.6 | 52.0 | 48.6 | 48.5 | 63.9 |
| June | 54.4 | 52.7 | 52.9 | 49.5 | 48.7 | 60.3 |
| July | 54.2 | 51.5 | 53.0 | 50.1 | 48.1 | 62.2 |
| August | 55.2 | 52.3 | 51.9 | 50.1 | 48.3 | 62.1 |
| September | 55.9 | 54.0 | 50.6 | 48.9 | 49.1 | 63.0 |
| October | 56.2 | 53.0 | 50.9 | 49.4 | 49.4 | 62.9 |
| November | 56.4 | 52.8 | 52.7 | 51.0 | 48.9 | 61.2 |
| December | 55.7 | 51.9 | 54.3 | 52.3 | 48.7 | 60.6 |
| Other Indices of China’s Non-manufacturing PMI (Seasonally Adjusted) | ||||
| Unit: % | ||||
| Foreign New Orders Index | Unfilled Orders Index | Stock Index | Supplier Delivery Time Index | |
| 2019-December | 47.8 | 44.5 | 47.2 | 52.2 |
| 2020-January | 48.4 | 43.6 | 47.2 | 52.1 |
| February | 26.8 | 35.2 | 39.3 | 28.3 |
| March | 38.6 | 43.0 | 46.1 | 46.4 |
| April | 35.5 | 43.4 | 47.0 | 51.0 |
| May | 41.3 | 44.3 | 47.8 | 52.9 |
| June | 43.3 | 44.8 | 48.0 | 52.1 |
| July | 44.5 | 44.9 | 48.1 | 51.9 |
| August | 45.1 | 44.6 | 48.5 | 52.4 |
| September | 49.1 | 46.3 | 48.5 | 52.2 |
| October | 47.0 | 44.9 | 48.7 | 52.3 |
| November | 49.0 | 45.2 | 48.8 | 51.8 |
| December | 47.5 | 44.7 | 47.0 | 51.2 |
3. Composite PMI Output Index
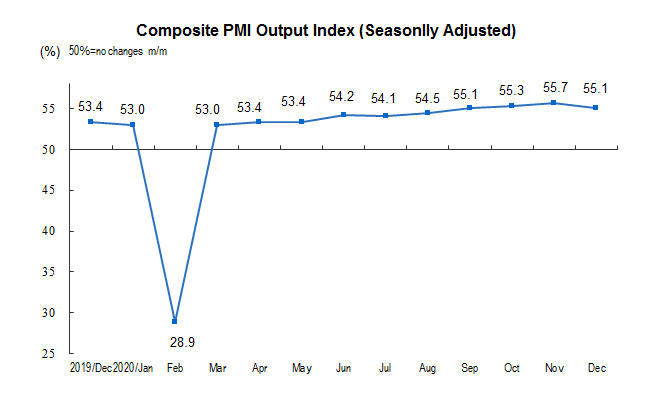
In December, the comprehensive PMI output index was 55.1 percent, which was 0.6 percentage point lower than that of last month, but it was in a relatively high boom range of more than 55.0 percent for four consecutive months, indicating that the production and operation activities of Chinese enterprises continued to recover in the near future.
CPI
China’s consumer prices rebounded in December, official data showed Monday, as food prices picked up due to weather difficulties and rising demand ahead of the Lunar New Year festival.
In December, the consumer price index (CPI) rose more than expected at 0.2 percent on-year, said the National Bureau of Statistics, with prices increasing for fresh produce and meats such as pork, beef and mutton ahead of next month’s nationwide holiday.
“Due to continued low temperatures, the production, storage and transportation costs of fresh vegetables and fruit increased,” said NBS senior statistician Dong Lijuan.
The index is a key gauge of retail inflation, and the rebound follows the first negative reading in over a decade the month before as food costs fell.
On Monday, Dong said that consumer demand was picking up due to New Year’s Day and the upcoming Lunar New Year, bumping up prices of other food items.
But pork prices, which rocketed previously after an African swine fever outbreak ravaged pig stocks, continued to drop by 1.3 percent on-year last month as supplies of the staple meat recovered.
For the full year of 2020, consumer prices rose 2.5 percent on-year.
“Consumer prices may slip back into deflation over the next couple of months due to a jump in pork prices a year ago, but this should prove temporary,” said Capital Economics’ senior China economist Julian Evans-Pritchard.
On Friday, China’s first live hog futures began trading, which officials hope will help halt price fluctuations.
High food inflation has triggered urban unrest in the past and rising prices is a concern not just for farmers but also the country’s leaders.
Iris Pang, chief economist for Greater China at ING said consumer prices should hold steady moving forward, with pork prices stabilising and vegetable costs dropping after winter.
She added: “I expect that as vaccinations progress, there will be more demand for consumer goods and… prices should increase.”
Meanwhile, the producer price index (PPI) which measures the cost of goods at the factory gate, fell 0.4 percent on-year last month — better than November’s 1.5 percent drop.
“Domestic demand recovered steadily, coupled with the continued rise in prices of some international commodities,” said Dong.
For the whole of 2020, PPI fell 1.8 percent on-year.


