
Check-Cap (NASDAQ:CHEK) Is Seeing Heavy Trading
$CHEK #Check-Cap #Checkcap #USA #NASDAQ #Stocks
Check-Cap
Ticker: NASDAQ:CHEK
Price: $1.45
Check-Cap News
So why exactly is Check-Cap on the move today? The most recent news from the company comes from Dec. 30. At this time, it was given notice of a 180-day extension to regain Nasdaq Exchange compliance. That gives the stock time to push above the $1 minimum required to list on the market.
Keeping all of this in mind, let’s take a look at what investors need to know about Check-Cap Ltd. before investing in CHEK stock.
Check-Cap Ltd. is a company that creates a screening device for colorectal cancer.
The goal is to find polyps before they possibly transform into cancer.
It does this through its C-Scan medical device, which is the only preparation free test able to do so.
C-Scan is a capsule that the patient takes and it passes through their body normally.
While doing so, it scans the walls of the gastrointestinal tract and relays the information to the tracking system worn on the person’s back.
This data is then sent to physicians and can be used to create 2D and 3D maps of the person’s inner surface of the colon.
CHEK stock was up 160% as of Monday morning.
Business Summary
Check-Cap is a Israel-based clinical-stage medical diagnostics company developing. The Company develops C-Scan, capsule-based, system ingestible imaging for colorectal cancer screening.
Price Performance
Candlesticks
A big white candle occurred. This is generally considered bullish, as prices closed significantly higher than they opened. If the candle appears when prices are "low," it may be the first sign of a bottom. If it occurs when prices are rebounding off of a support area (e.g., a moving average, trendline, or retracement level), the long white candle adds credibility to the support. Similarly, if the candle appears during a breakout above a resistance area, the long white candle adds credibility to the breakout.
During the past 10 bars, there have been 7 white candles and 3 black candles for a net of 4 white candles. During the past 50 bars, there have been 25 white candles and 24 black candles for a net of 1 white candles.
A rising window occurred (where the top of the previous shadow is below the bottom of the current shadow). This usually implies a continuation of a bullish trend.
Three white candles occurred in the last three days. Although these candles were not big enough to create three white soldiers, the steady upward pattern is bullish.
Momentum Indicators
Momentum is a general term used to describe the speed at which prices move over a given time period. Generally, changes in momentum tend to lead to changes in prices. This expert shows the current values of four popular momentum indicators.
Stochastic Oscillator
One method of interpreting the Stochastic Oscillator is looking for overbought areas (above 80) and oversold areas (below 20). The Stochastic Oscillator is 82.4691. This is an overbought reading. However, a signal is not generated until the Oscillator crosses below 80 The last signal was a buy 7 period(s) ago.
Relative Strength Index (RSI)
The RSI shows overbought (above 70) and oversold (below 30) areas. The current value of the RSI is 93.45. This is where it usually tops. The RSI usually forms tops and bottoms before the underlying security. A buy or sell signal is generated when the RSI moves out of an overbought/oversold area. The last signal was a sell 23 period(s) ago.
MACD
The Moving Average Convergence/Divergence indicator (MACD) gives signals when it crosses its 9 period signal line. The last signal was a buy 5 period(s) ago.
Rex Takasugi - TD Profile
CHECK CAP LTD closed up 0.990 at 1.450. Volume was 5,510% above average (trending) and Bollinger Bands were 581% wider than normal.
Open High Low Close Volume 0.722 1.650 0.667 1.450 356,571,424
Technical Outlook Short Term: Overbought Intermediate Term: Bullish Long Term: Bullish
Moving Averages: 10-period 50-period 200-period Close: 0.48 0.36 0.52 Volatility: 654 326 212 Volume: 43,354,524 10,290,108 5,042,737
Short-term traders should pay closer attention to buy/sell arrows while intermediate/long-term traders should place greater emphasis on the Bullish or Bearish trend reflected in the lower ribbon.
Summary
CHECK CAP LTD gapped up today (bullish) on heavy volume. Possibility of a Breakaway Gap which usually signifies the beginning of a major market move. Four types of price gaps exist - Common, Breakaway, Runaway, and Exhaustion. Gaps acts as support/resistance.
CHECK CAP LTD is currently 180.5% above its 200-period moving average and is in an upward trend. Volatility is extremely high when compared to the average volatility over the last 10 periods. There is a good possibility that volatility will decrease and prices will stabilize in the near term. Our volume indicators reflect very strong flows of volume into CHEK.O (bullish). Our trend forecasting oscillators are currently bullish on CHEK.O and have had this outlook for the last 26 periods. Our momentum oscillator is currently indicating that CHEK.O is currently in an overbought condition.
AI is the Neat Handwriting of the Illiterate
A model in the hands of someone who has read the filing and walked the plant is a clerk. The same model, speaking for someone who has done neither, is a disguise. On AI slop, phantom citations and factslop, why finish stopped being evidence of work, and the containment layer KXCO built so a machine cannot speak as the institution until a source is attached.
Worthship: Do Not Conform to the Age
Worthship is the older English word for worship, and it means to ascribe worth. Bishop Robert Barron preached Romans 12 on 30 August. This essay follows the text into the prison letters, and puts two questions to a graph: do the four readings of that Sunday agree, and was Paul free or in chains when he wrote about despair?
The Truth in All Its Ugliness Must Survive
A majority vote does not determine the truth. Consensus is a mood, gossip is a sport, and a model will write the pretty version for free. Why the ugly number has to survive, why a record beats a dashboard, and what KXCO was built to keep standing when the room changes its mind.
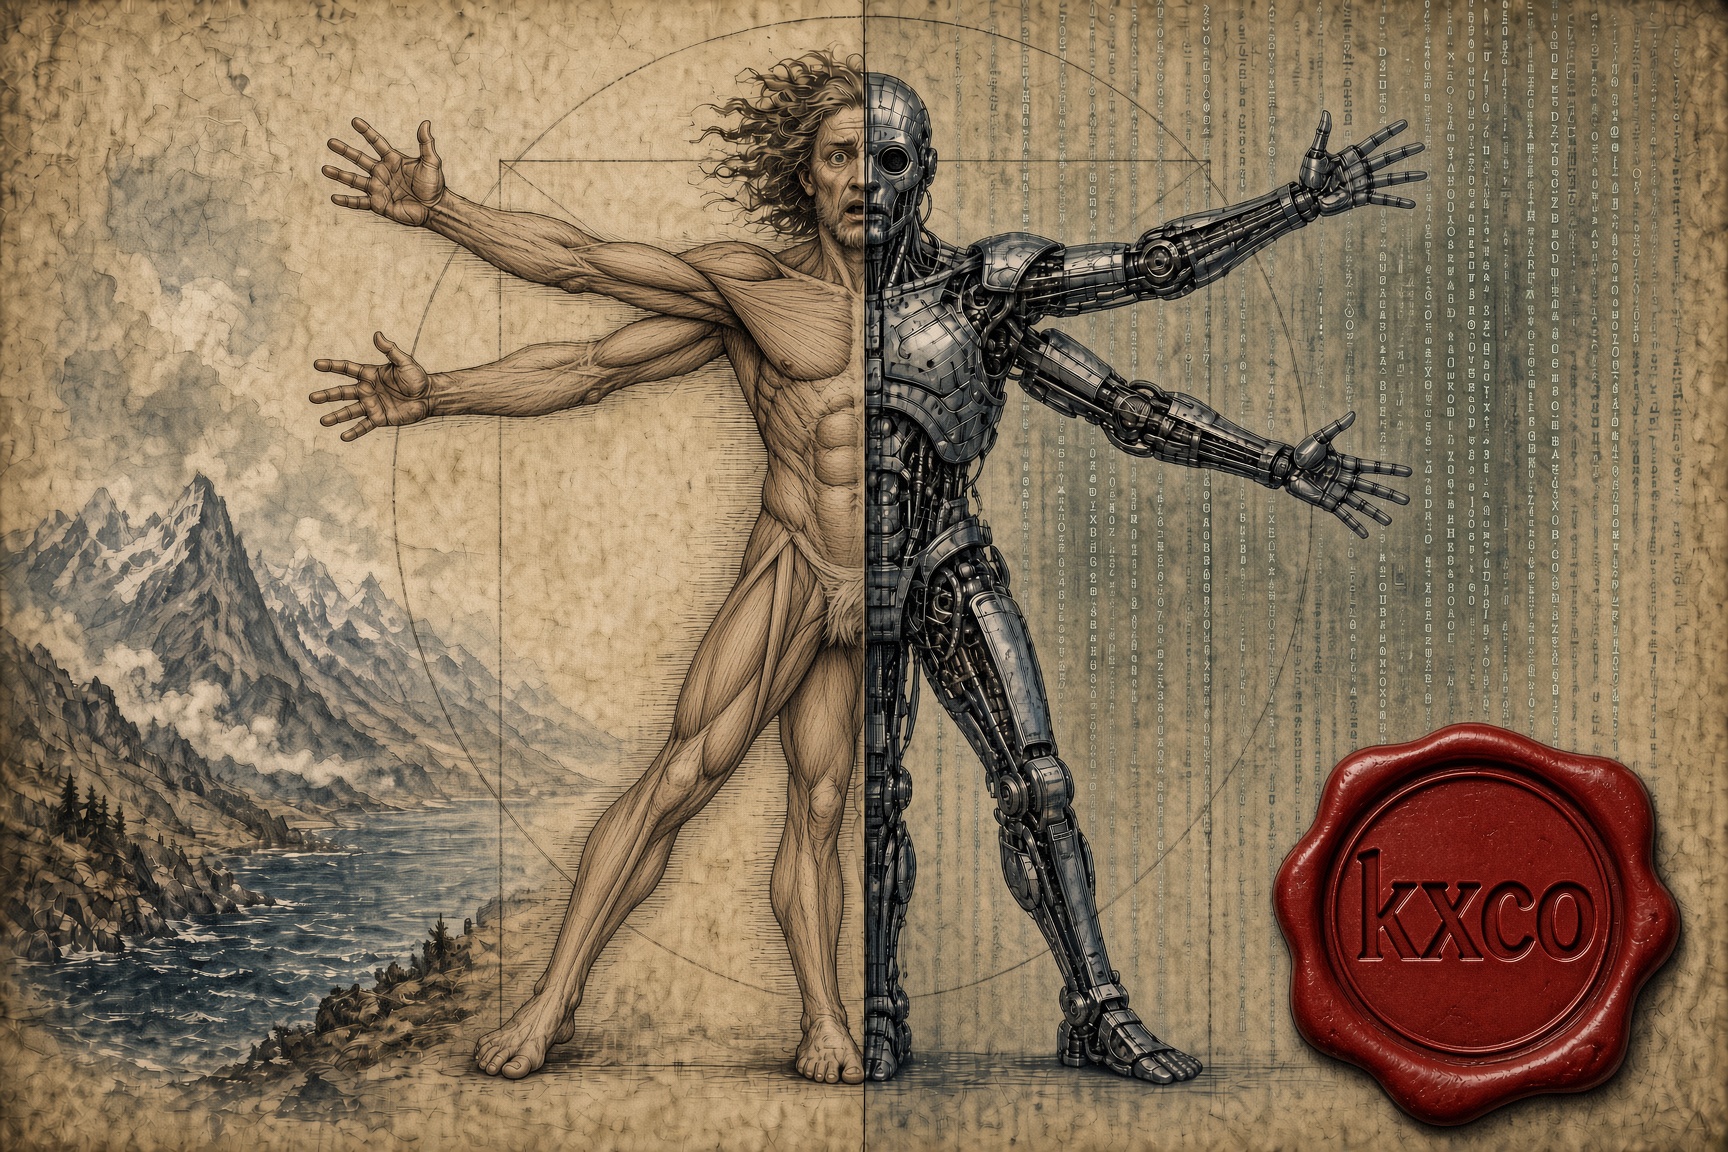
Don't Be the Best, Be the Only: Winning in an AI World
AI is repricing competence downward. What it cannot reproduce is a life. The case for remaining non-fungible, why friction still produces the best ideas, and what it means to build AI systems that keep the human intellect in them.
Every story, signed and delivered.
Subscribe to the kxco channel and get the headline, the AI-written key takeaways, and the chain-anchor link the moment we publish. Audio versions and per-ticker subscriptions arrive in the next iteration.