
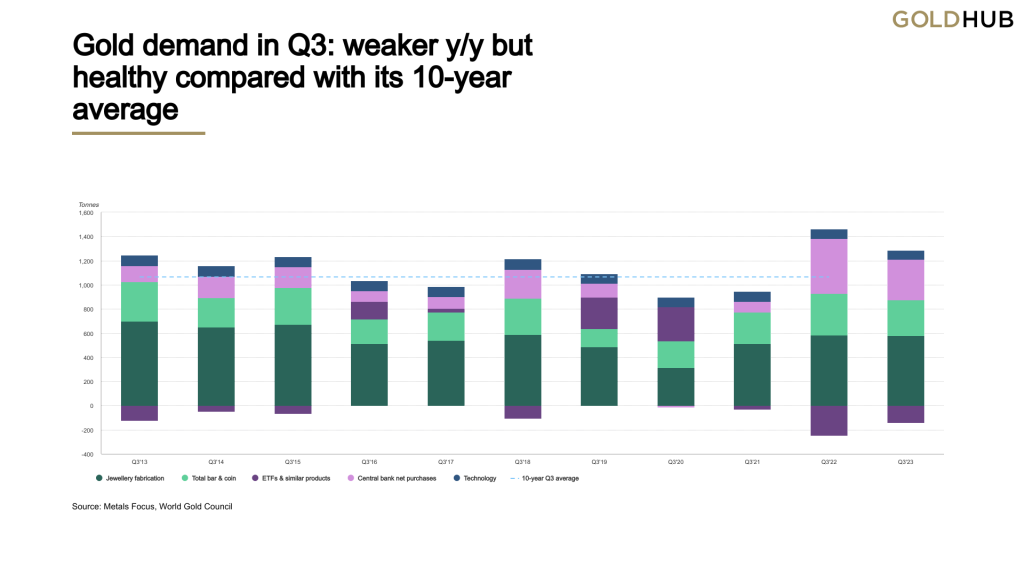
Central banks gold buying maintained a historic pace but fell short of the Q3’22 record. Jewellery demand softened slightly in the face of high gold prices, while the investment picture was mixed.
Gold demand (excluding OTC) in Q3 was 8% ahead of its five-year average, but 6% weaker y/y at 1,147t. Inclusive of OTC and stock flows, total demand was up 6% y/y at 1,267t.1
Net central bank buying of 337t was the third strongest quarter in our data series, although failed to match the exceptional 459t from Q3’22. Yet, demand from central banks y-t-d is 14% ahead of the same period last year at a record 800t.
Q3 investment demand of 157t, although 56% higher y/y, was weak relative to its five-year average of 315t. Global gold ETFs lost 139t in Q3 – a far smaller outflow than Q3’22 (-244t).
Bar and coin investment declined 14% y/y to 296t, although remained firmly above the five-year quarterly average of 267t. The y/y decline is largely the product of sharp falls in Europe.
OTC investment totalled 120t in Q3. This opaque source of demand was again evident as the gold price found firm support for much of Q3, despite ETF outflows and falling COMEX futures net longs.
Jewellery consumption softened slightly, down 2% y/y at 516t amid continued gold price strength. Jewellery fabrication was marginally more resilient, down 1% to 578t due to inventory build-up.
Fragile consumer electronics demand continued to undermine volumes of gold used in technology, which fell 3% y/y to 75t.
Mine production reached a record 971t in Q3, helping to lift total gold supply to 1,267t (+6% y/y). Recycling was also higher y/y, up 8% to 289t.
Gold demand in Q3: weaker y/y but healthy compared with its 10-year average
Sources: Metals Focus, Refinitiv GFMS, World Gold Council; Disclaimer
Highlights
The LBMA (PM) gold price averaged US$1,928.5/oz during Q3. Although 2% below the record high seen in Q2, this was 12% higher y/y. Several countries saw higher local gold prices due to currency weakness against the US dollar, including Japan, China and Turkey.
Y-t-d, central bank net buying of gold is 14% ahead of 2022. Central banks have bought a net 800t of gold so far this year, the highest on record for that nine-month period. While there is a nucleus of committed regular buyers, the range of countries whose central banks have added to their reserves over recent quarters is broad-based.
Investment demand is mixed y-t-d. Bar and coin investment is broadly in line with Q1-Q3 last year, thanks to H1 strength in the Middle East, Turkey and China. Gold ETFs, in contrast, have seen outflows of 189t so far this year, and have now registered six successive quarters of negative demand.
After a record Q3, mine production also reached a new y-t-d high of 2,744t. This puts a new annual record within reach for 2023. The y-t-d supply of recycled gold is also higher at 924t (+9%). Although this element of supply has been supported by elevated gold prices, it has been capped by economic resilience in the US and a strong investment motive in the Middle East.
Gold supply and demand
| Tonnes | Q3’22 | Q4’22 | Q1’23 | Q2’23 | Q3’23 | y/y change | |
| Supply | |||||||
| Mine production | 949.1 | 946.7 | 860.2 | 912.7 | 971.1 | 2% | |
| Net producer hedging | -26.8 | -13.6 | 37.1 | -19.5 | 7.2 | – | |
| Recycled gold | 268.3 | 290.7 | 312.0 | 322.9 | 288.8 | 8% | |
| Total Supply | 1,190.6 | 1,223.8 | 1,209.3 | 1,216.1 | 1,267.1 | 6% | |
| Demand | |||||||
| Jewellery fabrication | 582.6 | 601.9 | 512.4 | 492.8 | 578.2 | -1% | |
| Jewellery consumption | 525.7 | 628.5 | 474.8 | 475.8 | 516.2 | -2% | |
| Jewellery inventory | 56.9 | -26.7 | 37.6 | 17.0 | 62.1 | 9% | |
| Technology | 77.3 | 72.1 | 70.1 | 70.4 | 75.3 | -3% | |
| Electronics | 63.5 | 57.9 | 56.1 | 56.4 | 61.1 | -4% | |
| Other Industrial | 11.3 | 11.7 | 11.6 | 11.6 | 11.8 | 4% | |
| Dentistry | 2.5 | 2.4 | 2.4 | 2.4 | 2.3 | -6% | |
| Investment | 100.5 | 247.4 | 274.3 | 255.7 | 156.9 | 56% | |
| Total bar & coin demand | 344.2 | 336.6 | 303.0 | 276.8 | 296.2 | -14% | |
| Physical Bar demand | 225.1 | 222.2 | 183.3 | 163.8 | 205.9 | -9% | |
| Official Coin | 86.2 | 85.5 | 94.9 | 87.2 | 54.9 | -36% | |
| Medals/Imitation Coin | 33.0 | 28.9 | 24.7 | 25.8 | 35.4 | 7% | |
| ETFs & similar products | -243.7 | -89.2 | -28.6 | -21.1 | -139.3 | – | |
| Central banks & other inst. | 458.8 | 382.1 | 287.7 | 174.8 | 337.1 | -27% | |
| Gold demand | 1,219.2 | 1,303.5 | 1,144.5 | 993.7 | 1,147.5 | -6% | |
| OTC and other | -28.6 | -79.7 | 64.7 | 222.4 | 119.6 | – | |
| Total Demand | 1,190.6 | 1,223.8 | 1,209.3 | 1,216.1 | 1,267.1 | 6% | |
| LBMA Gold Price, US$/oz | 1,728.9 | 1,725.9 | 1,889.9 | 1,975.9 | 1,928.5 | 12% | |
Source: Metals Focus, Refinitiv GFMS, ICE Benchmark Administration, World Gold Council
Note: For an explanation of these terms, please see the Notes and definitions