
How to understand Bitcoin Price Fields?
Before understanding technical analysis, you must understand price fields and how they play a crucial role in understanding the behavior and trends of Bitcoin in the market. When analyzing Bitcoin price data, several key fields are commonly examined, including High and Low prices, Volume, and Open Interest. Each of these fields provides valuable insights into the market sentiment and potential price movements.
High and Low Prices: The High and Low prices refer to the highest and lowest prices traded during a specific time frame, most commonly a day. These data points are represented on the price chart as vertical lines, with the highest price forming the top of the line (High) and the lowest price forming the bottom (Low).
High prices indicate the highest level reached by Bitcoin during the day, often considered as resistance levels by traders. Conversely, Low prices represent the lowest level Bitcoin dropped to, which can be viewed as support levels. Identifying these levels helps traders make informed decisions about potential entry and exit points, as they can act as crucial price barriers.
Volume: Volume represents the total number of Bitcoins traded within a given time frame. It is typically displayed as a histogram beneath the price chart. Volume provides valuable information about the strength and significance of price movements and indicators. High trading volumes during price rallies or declines suggest strong market participation and validate the trend's credibility.
For instance, if Bitcoin's price is rising with no significant increase in volume, it indicates fake buying interest, potentially leading to a strong correction. Conversely, Bitcoin's price is rising accompanied by high volume may indicate strong buying pressure, potentially signaling a bullish trend continuation.
Open Interest: Open Interest, on the other hand, is a concept mainly used in the context of futures and options contracts. It represents the total number of outstanding contracts that have not been closed or settled by an offsetting transaction. In the Bitcoin futures market, open interest provides insight into the total number of outstanding long and short positions.
When open interest is increasing, it suggests that new money is flowing into the market, indicating rising participation and potential for larger price swings. Conversely, declining open interest may signal a decrease in trader interest and potential consolidation in Bitcoin's price.

Incorporating these price fields into technical analysis enables traders and analysts to identify key support and resistance levels, assess market participation and momentum, validate indicators, and anticipate potential price movements in the Bitcoin market. Proper technical analysis in the Bitcoin market should involve using multiple indicators that validate each other and approached by making well-informed trading decisions.
For more detailed information join the XT Knights trading here https://bit.ly/KnightsXT and message https://t.me/XTknights on telegram to join the trading group.

Economic Calendar and Trading Strategies for the Week Ahead: July 20–24, 2026
A pivotal week for markets: Iran's closure of the Strait of Hormuz sends crude above $86 and gasoline over $5, while Alphabet, Tesla and Intel earnings test the AI trade. Full economic calendar plus trading strategies across oil, gold, Bitcoin, FX and AI chip stocks.
Economic Calendar and Trading Strategies for the Week Ahead: July 14–18, 2026
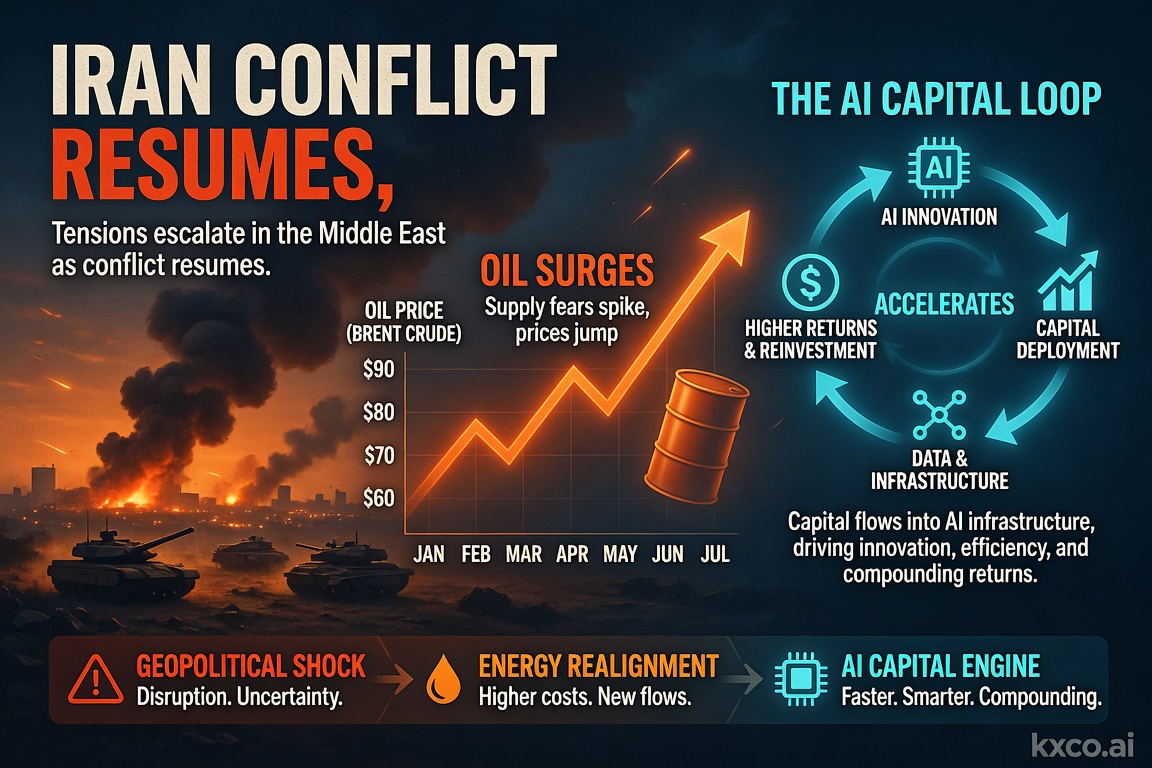
A pivotal week for markets: US strikes on Iran reignite the oil risk premium, June CPI and retail sales test the Fed's rate-cut path, and the $1 trillion AI capital loop keeps driving the tech trade. Full economic calendar plus trading strategies across oil, gold, Bitcoin, FX and AI stocks.

Quantum Computing Just Became an Institutional Risk
Shayne Heffernan on BlackRock's quantum-computing warning for Bitcoin and Ethereum, Google's cryptanalysis research, the two on-chain risk vectors, and how KXCO's Armature L1 — post-quantum from genesis, coordinated by its ontology — answers a threat that just went institutional.

Economic Calendar and Trading Strategies for July 7–11, 2026
A trader's guide to the week of July 7–11, 2026: the US and China economic calendar, the Fed-pivot test after a soft jobs report, and how to trade Nvidia, SpaceX, Bitcoin, the dollar, gold, silver, AI and quantum. Track every release on Live Trading News.
Every story, signed and delivered.
Subscribe to the kxco channel and get the headline, the AI-written key takeaways, and the chain-anchor link the moment we publish. Audio versions and per-ticker subscriptions arrive in the next iteration.