AMC’s “best week ever” based on admissions revenue from July 21 through July 27 sets a new AMC record for its theatres in the U.S. and also sets a new record for all its theatres globally points to big things to come here.
Candlesticks
A white body occurred (because prices closed higher than they opened).
During the past 10 bars, there have been 4 white candles and 5 black candles for a net of 1 black candles. During the past 50 bars, there have been 22 white candles and 26 black candles for a net of 4 black candles.
A spinning top occurred (a spinning top is a candle with a small real body). Spinning tops identify a session in which there is little price action (as defined by the difference between the open and the close). During a rally or near new highs, a spinning top can be a sign that prices are losing momentum and the bulls may be in trouble.
| Support/Resistance |
| Type | Value | Conf. |
| resist. | 7.78 | 2 |
| resist. | 7.11 | 2 |
| resist. | 6.38 | 3 |
| resist. | 6.10 | 2 |
| resist. | 5.85 | 3 |
| resist. | 5.74 | 2 |
| resist. | 4.94 | 20 |
| supp | 4.48 | 9 |
| supp | 4.18 | 4 |
| supp | 4.01 | 2 |
| supp | 3.91 | 2 |
| Chart Indicators |
| Ind. | short | Inter | Long |
| EMA | VBu | VBu | VBu |
| MACD | VBu | Bu | VBu |
| RSI | Bu | ||
| TDD | Bu | ||
| Fibs | Be | Be | Be |
| Highs | VBu | N | VBe |
| Lows | N | Bu | VBe |
| Trends | N | N | N |
| Stoch. | Bu |
| VBu=Very Bullish, Bu=Bullish N=Neutral Be=Bearish, VBe=Very Bearish |
Momentum
Momentum is a general term used to describe the speed at which prices move over a given time period. Generally, changes in momentum tend to lead to changes in prices. This expert shows the current values of four popular momentum indicators.
Stochastic Oscillator
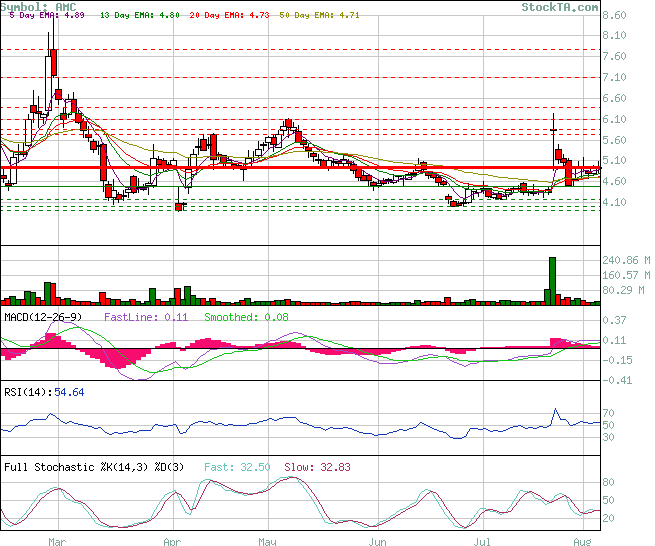
One method of interpreting the Stochastic Oscillator is looking for overbought areas (above 80) and oversold areas (below 20). The Stochastic Oscillator is 52.7431. This is not an overbought or oversold reading. The last signal was a buy 3 period(s) ago.
Relative Strength Index (RSI)
The RSI shows overbought (above 70) and oversold (below 30) areas. The current value of the RSI is 54.64. This is not a topping or bottoming area. A buy or sell signal is generated when the RSI moves out of an overbought/oversold area. The last signal was a sell 8 period(s) ago.
Commodity Channel Index (CCI)
The CCI shows overbought (above 100) and oversold (below -100) areas. The current value of the CCI is 33. This is not a topping or bottoming area. The last signal was a sell 6 period(s) ago.
MACD
The Moving Average Convergence/Divergence indicator (MACD) gives signals when it crosses its 9 period signal line. The last signal was a buy 23 period(s) ago.
Technical Outlook
Short Term: Neutral
Intermediate Term: Bullish
Long Term: Bearish
Short-term traders should pay closer attention to buy/sell arrows while intermediate/long-term traders should place greater emphasis on the Bullish or Bearish trend reflected in the lower ribbon.
Summary
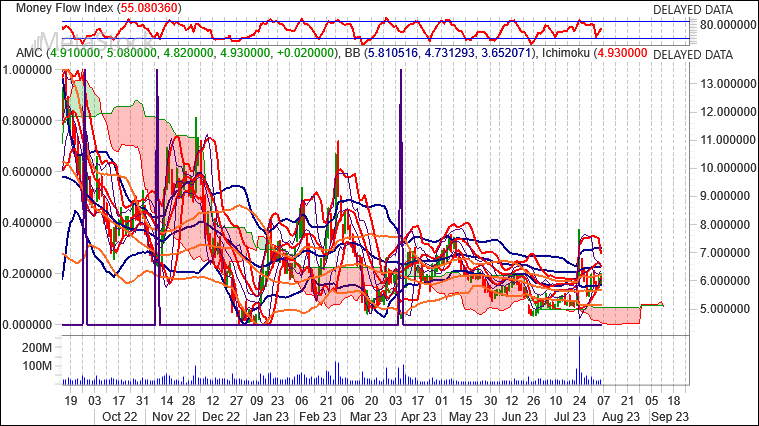
AMC ENTERTAT HLD (Trade Price) is currently 7.8% below its 200-period moving average and is in an upward trend. Volatility is high as compared to the average volatility over the last 10 periods. Our volume indicators reflect moderate flows of volume into AMC (mildly bullish). Our trend forecasting oscillators are currently bullish on AMC and have had this outlook for the last 18 periods.
Shayne Heffernan