
Ambev (NYSE:ABEV) Stock Chart Analysis from Metastock
$ABEV #Ambev #USA #NYSE #Stocks #Trading #Markets
Ambev
Ticker: NYSE:ABEV
Price: $3.06
Ambev Outlook
For alcoholic-beverage firms, the Covid-19 crisis represented a double-edged sword. On one hand, the pandemic destroyed personal incentive to go out to restaurants and bars, thus killing lucrative revenue channels. Even if those few brave souls didn’t give a rat’s rear end about the coronavirus, many jurisdictions imposed severe lockdown measures.
On the other hand, grocery sales of alcoholic beverages increased significantly as in-home entertainment became the only feasible (and safest) solution for imbibing. Further, companies like Boston Beer Company pivoted to hard seltzer, a drink category increasingly becoming the millennial’s preferred choice. But SAM shares are priced in four-digit territory.
However, competitor Ambev is technically one of the cheapest among cheap stocks.
Priced at a little over $3 a pop, ABEV stock is ideal for discount divers looking for a cynical play off the global coronavirus surge. Primarily operating in the Latin American region, Ambev doesn’t have the underlying stability of a Boston Beer. Of course, a higher risk profile suggests a higher reward potential, which should attract speculators.
Better yet, ABEV stock has been steadily moving higher since late October. This might be due to the assumed resumption of normal diplomatic relations under the incoming administration of President-elect Joe Biden.
Business Summary
Ambev SA, formerly Inbev Participacoes Societarias SA, is a Brazil-based company engaged in the brewing sector.
The Company produces, distributes and sells beer, carbonated soft drinks (CSDs) and other non-alcoholic and non-carbonated (NANC) beverages across the Americas.
The Company's activities are divided into three segments: Latin America North, including sell of beer, CSD and NANC drinks in Brazil, as well as operations in the Dominican Republic, Saint Vincent, Antigua, Dominica, Cuba, Guatemala, El Salvador, Honduras, Nicaragua, Barbados and Panama; Latin America South, distributing products in Argentina, Bolivia, Paraguay, Uruguay, Chile; and Canada, represented by Labatt’s operations, which comprises sales in Canada and some exports to the U.S. market.
The Company markets products under various brand names, such as Adriatica, Brahma, Leffe, Budweiser, Corona, PepsiCo and Lipton. It is a subsidiary of Interbrew International BV.
Price Performance

Relative Valuation
Technical Indicators
Overall, the bias in prices is: Upwards.
Note: this chart shows extraordinary price action to the upside.
The projected upper bound is: 3.33.
The projected lower bound is: 2.82.
The projected closing price is: 3.07.
Candlesticks
A big white candle occurred. This is generally considered bullish, as prices closed significantly higher than they opened. If the candle appears when prices are "low," it may be the first sign of a bottom. If it occurs when prices are rebounding off of a support area (e.g., a moving average, trendline, or retracement level), the long white candle adds credibility to the support. Similarly, if the candle appears during a breakout above a resistance area, the long white candle adds credibility to the breakout.
During the past 10 bars, there have been 3 white candles and 4 black candles for a net of 1 black candles. During the past 50 bars, there have been 28 white candles and 16 black candles for a net of 12 white candles.
A piercing line occurred (which indicates that prices moved down on the previous bar, opened even lower, but then closed significantly higher). This implies strength as the momentum appears to be shifting from the bears to the bulls. Note that the higher the close of the white candle (relative to the black candle), the more bullish the Piercing Line pattern.
Momentum Indicators
Momentum is a general term used to describe the speed at which prices move over a given time period. Generally, changes in momentum tend to lead to changes in prices. This expert shows the current values of four popular momentum indicators.
Stochastic Oscillator
One method of interpreting the Stochastic Oscillator is looking for overbought areas (above 80) and oversold areas (below 20). The Stochastic Oscillator is 50.9804. This is not an overbought or oversold reading. The last signal was a sell 9 period(s) ago.
Relative Strength Index (RSI)
The RSI shows overbought (above 70) and oversold (below 30) areas. The current value of the RSI is 55.68. This is not a topping or bottoming area. A buy or sell signal is generated when the RSI moves out of an overbought/oversold area. The last signal was a sell 14 period(s) ago.
MACD
The Moving Average Convergence/Divergence indicator (MACD) gives signals when it crosses its 9 period signal line. The last signal was a sell 9 period(s) ago.
Rex Takasugi - TD Profile
AMBEV SA DRC closed up 0.070 at 3.060. Volume was 331% above average (trending) and Bollinger Bands were 43% narrower than normal.
Open High Low Close Volume 2.920 3.060 2.900 3.060 23,124,468
Technical Outlook Short Term: Neutral Intermediate Term: Bearish Long Term: Bullish
Moving Averages: 10-period 50-period 200-period Close: 3.05 2.80 2.52 Volatility: 35 60 66 Volume: 5,001,386 5,828,313 6,770,812
Short-term traders should pay closer attention to buy/sell arrows while intermediate/long-term traders should place greater emphasis on the Bullish or Bearish trend reflected in the lower ribbon.
Summary
AMBEV SA DRC is currently 21.3% above its 200-period moving average and is in an downward trend. Volatility is low as compared to the average volatility over the last 10 periods. Our volume indicators reflect volume flowing into and out of ABEV.N at a relatively equal pace (neutral). Our trend forecasting oscillators are currently bearish on ABEV.N and have had this outlook for the last 3 periods.
AI is the Neat Handwriting of the Illiterate
A model in the hands of someone who has read the filing and walked the plant is a clerk. The same model, speaking for someone who has done neither, is a disguise. On AI slop, phantom citations and factslop, why finish stopped being evidence of work, and the containment layer KXCO built so a machine cannot speak as the institution until a source is attached.
Worthship: Do Not Conform to the Age
Worthship is the older English word for worship, and it means to ascribe worth. Bishop Robert Barron preached Romans 12 on 30 August. This essay follows the text into the prison letters, and puts two questions to a graph: do the four readings of that Sunday agree, and was Paul free or in chains when he wrote about despair?
The Truth in All Its Ugliness Must Survive
A majority vote does not determine the truth. Consensus is a mood, gossip is a sport, and a model will write the pretty version for free. Why the ugly number has to survive, why a record beats a dashboard, and what KXCO was built to keep standing when the room changes its mind.
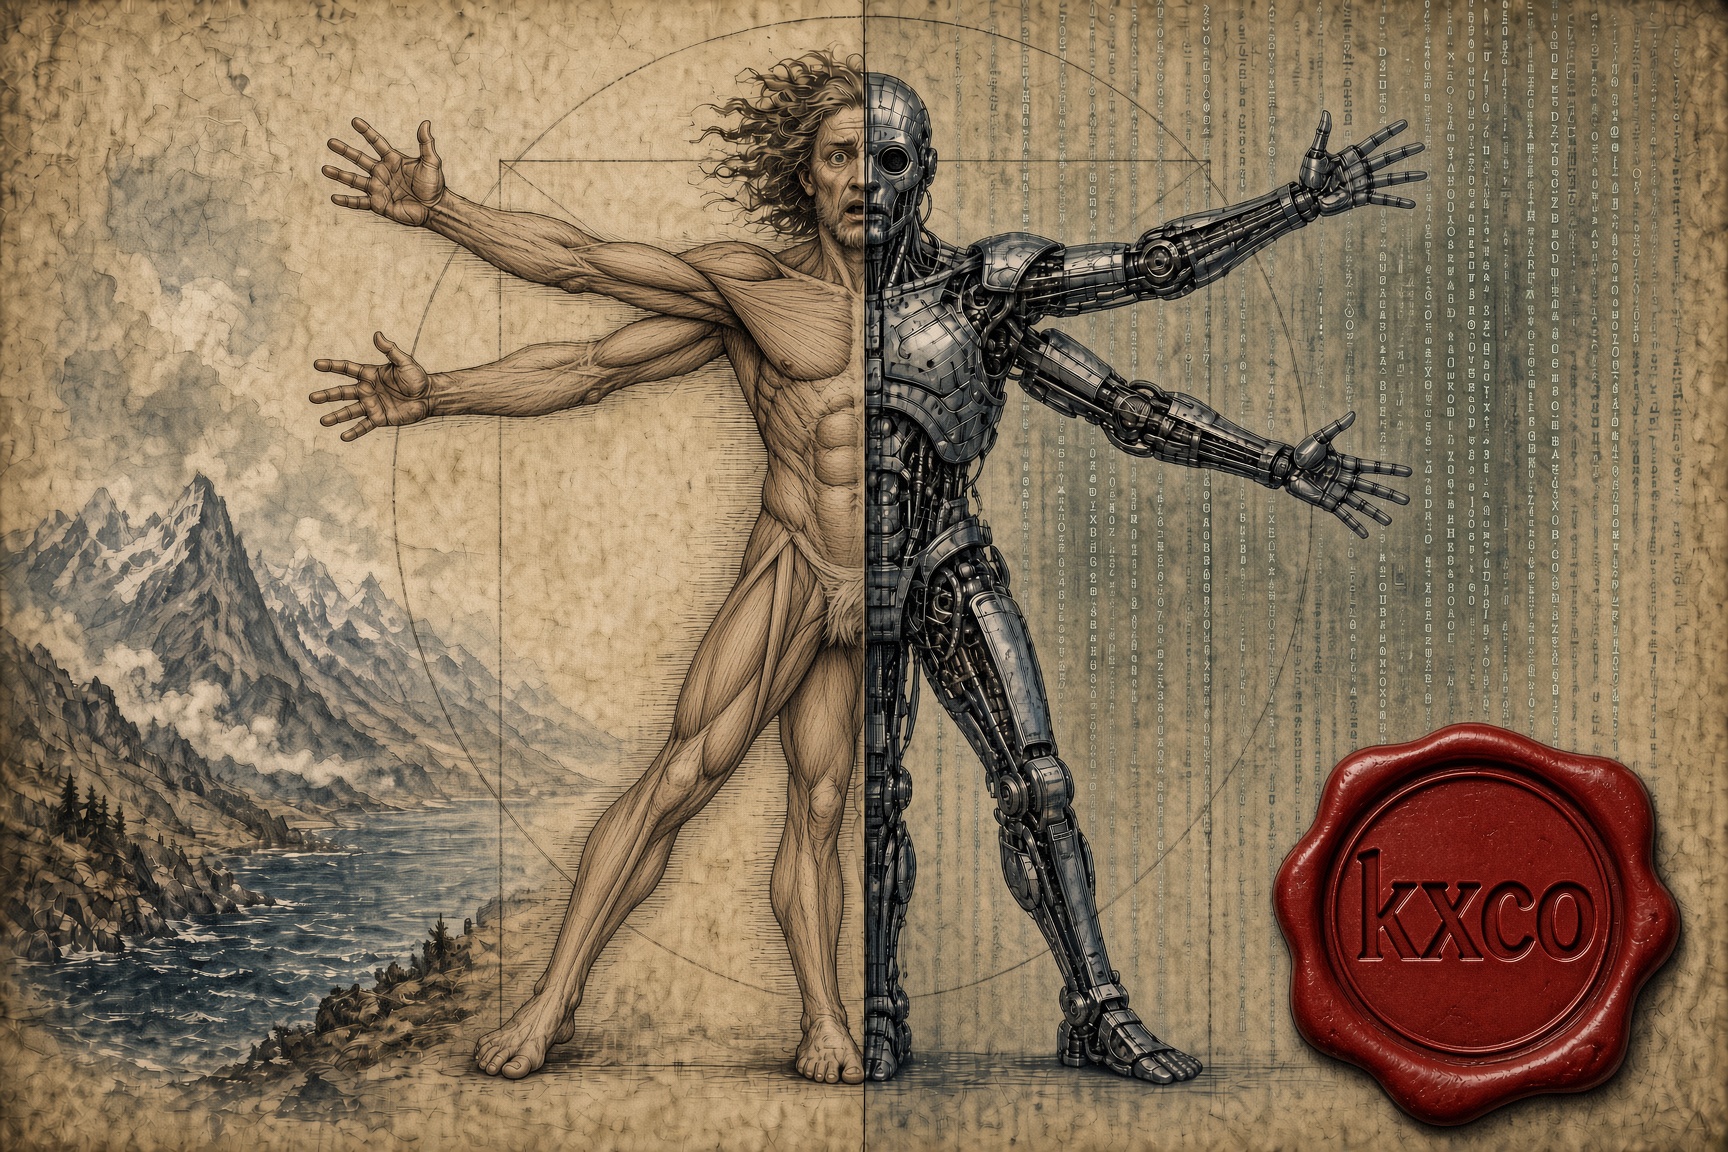
Don't Be the Best, Be the Only: Winning in an AI World
AI is repricing competence downward. What it cannot reproduce is a life. The case for remaining non-fungible, why friction still produces the best ideas, and what it means to build AI systems that keep the human intellect in them.
Every story, signed and delivered.
Subscribe to the kxco channel and get the headline, the AI-written key takeaways, and the chain-anchor link the moment we publish. Audio versions and per-ticker subscriptions arrive in the next iteration.